Featured
We Have Officially Entered a Bull Market
They are officially calling it a bull market as the S&P 500 joined the NASDAQ up 20% from the October 2022 lows. But divergences abound and many indices such as the Dow have not followed. The Mid and Small cap indices jumped this past week. A sign we are really in a bull? Or is it a sign that retail is jumping in at the top. U.S. indices were up but the TSX and EU indices were down.

There is a semiconductor war going on that hardly anyone notices or is paying attention to. The war is against China. It is conducted by the U.S. The aim is to hobble the Chinese semiconductor business, making it difficult for them to develop future technologies such as AI. It is also indispensable to technology development in industries such as pharmaceuticals, health care, and defense. The problem is magnified by the fact that semiconductors are all over the world and different countries do different things.
China is a major manufacturer of semiconductors. It supplies some 35% of the world’s global market. It just manufactures them; however, that’s the end. The beginning is controlled by the U.S. that designs and starts initial production. This is the platform economy, as described by GaveKal Research in their book Our Brave New World (2005). Design and outsource the production. Design could happen in one country, fabricated in another on machines made in another, tested in yet another, and finally, assembled and placed in electronics in yet another. Manufacturing capacity for semi-conductor chips is 92% in Taiwan with the final 8% in South Korea.
The U.S. put export controls on the chips to help block sales to China. They also blocked equipment and knowledge from being exported. The U.S. started trade wars with China while Trump was president, including sanctioning hundreds of individuals and companies. Sanctions may be useful in trying to change the behavior of a country, but history shows that, for the most part, they don’t work. There is always a way to get around them. They often backfire on the country that’s placing the sanctions. For example, when the U.S. placed sanctions on Russia over the invasion of Afghanistan in 1980, using its wheat sales to Russia as the pressure point, all Russia did was switch to someone else. The result was, it left U.S. farmers with a glut of grain and the market crashed. Sanctions on Russian oil? They found new markets in China, India, and Turkey. Not everyone goes along with sanctions. Smuggling also rises. And sanctions beget sanctions as the sanctioned country sanctions back.
This is not much different than the “beggar thy neighbor” policies of the 1930s that helped contribute to a global depression. Maybe we are not there yet, but the direction is in place.
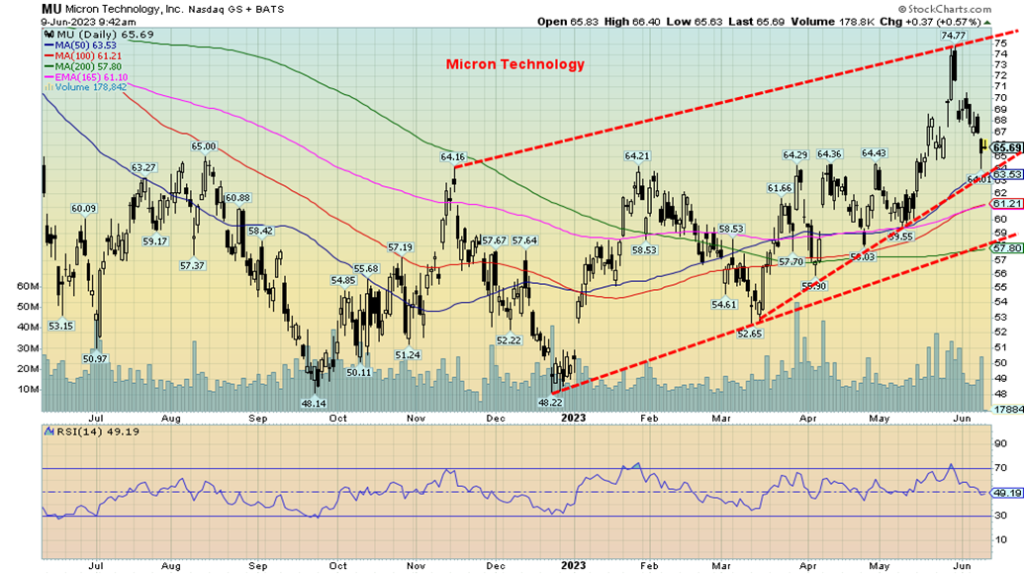
China has hit back against Micron (MU) by announcing on May 22 that they are barring the company from having its chips used in numerous infrastructure projects. Micron stock initially spiked, but is now down 13% from the top. The AI stocks that have led the market higher are now wavering and the NY FANG Index put in a outside day reversal to the downside on June 6. Could the AI rally be ending?
China and the U.S. are sparring elsewhere as well. Whether it is China’s dominance in critical minerals, their attempts in leading de-dollarization (by building their own version of SWIFT and global institutions such as the World Bank and the IMF), or the ongoing game of chicken being played out in the Straits of Taiwan, China and the U.S. are effectively in a state of war. It is just not a physical war. But could it become one?
We note our chart of Micron Technology on the next page. It has plunged from its high and seems poised to break down further, once it is under $63. So far, however, that uptrend line has held. Regardless of this, a collapse of a company like Micron reverberates on the entire market where, as we noted, the NY FANG Index put in an outside reversal day on Wednesday, June 6. Yes, and the NASDAQ did as well. Is the party over?
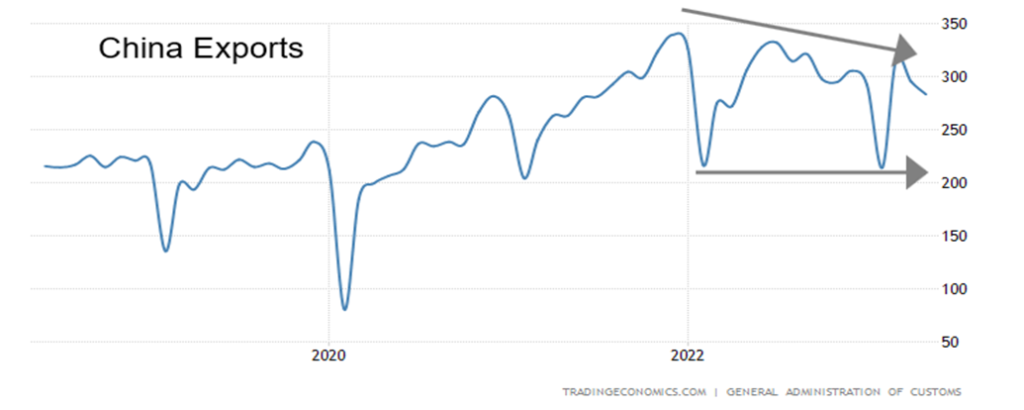
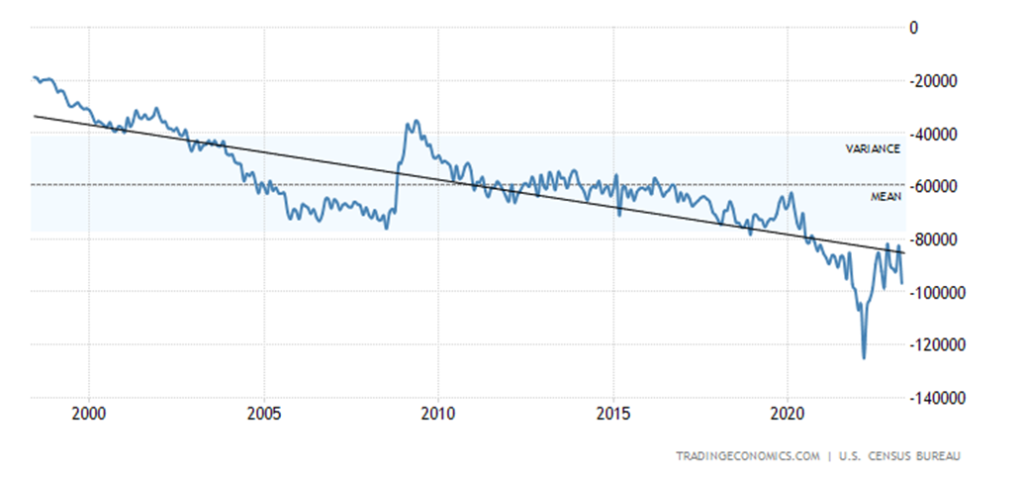
China’s exports have been falling. China’s exports peaked before the 2020 pandemic. The big dips noticeable on the chart coincide largely with the decline due to the 2020/2021 pandemic and the more recent bout of lockdowns that also resulted in a big dip in exports. But have the trade wars, sanctions, and other measures resulted in a big drop in the U.S.’s imports of Chinese goods? Not really. The trade deficit with China (imports less exports) by the U.S. was last reported at $325 billion annually. In 2020, the U.S. trade deficit with China was $314.7 billion and in 2016 the U.S./Chinese trade deficit for the U.S. was $357.5 billion. In 2000, the U.S. trade deficit with China was only $75.3 billion. The U.S. still runs a $1.1 trillion trade deficit with the world. China is the largest component. That deficit has to be financed.
Trade wars, sanctions, and more all have a cost. We are seeing it in a micro sense with the recent drop in Micron, and we are seeing it in a macro sense with the rise in the U.S. trade deficit and China’s declining exports to the world. A lose-lose for all.
Micron Technology
China Exports 2018–2023
The Sliding U.S. Trade Balance 1997-2023
Canada Hikes the Bank Rate
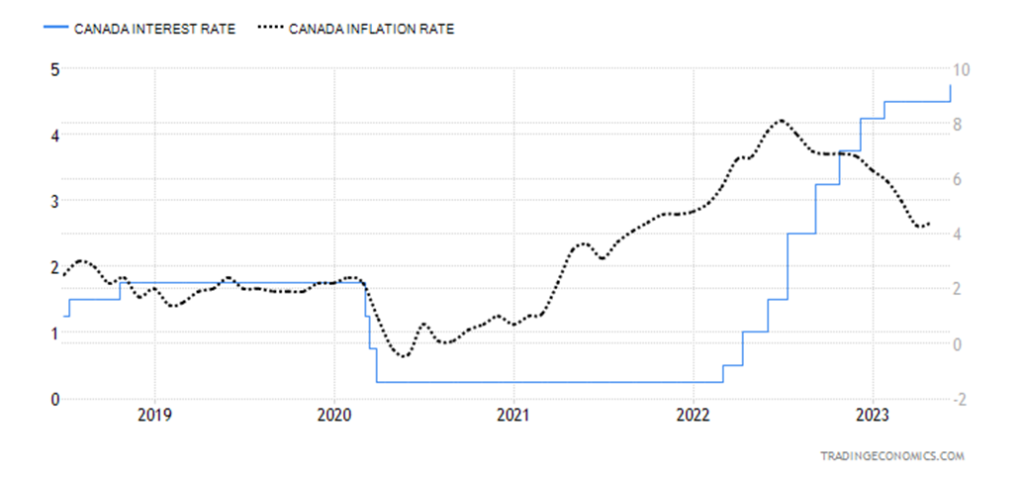
This was somewhat unexpected. Canada hiked its key bank rate on June 7 by 25 bp to 4.75%. Yes, there had been some good economic numbers, including Q1 GDP that was up an annualized 3.1%. Inflation also perked up last month to 4.4% from 4.3% the previous month. The inflation rate was a surprise as they had expected it to fall to 4.1%. Overall, hiking the bank rate was a surprise move.
There was fallout to the rate hike. It could be what caused stock markets to reverse that day and gold to slump. The fear was now that the Fed might, instead of pausing at the June 13–14 FOMC, raise rates by a further 25 bp. An unexpected move begets new fears.
The new bank rate is the highest in 22 years. The aim of the Bank of Canada (BofC) is to bring inflation back to 2%. Instead, what this has done is strike new fear into the market concerning interest rates in an over-indebted consumer credit market, and what it might mean for the beleaguered housing market and mortgages as well as the stumbling commercial real estate market. Although Canada’s job market is not quite stumbling, as noted next.
Canada Bank of Canada Interest Rate, Inflation 2018–2023
Canada Job Numbers
Canada Employed Persons vs. Unemployed Persons 2018–2023
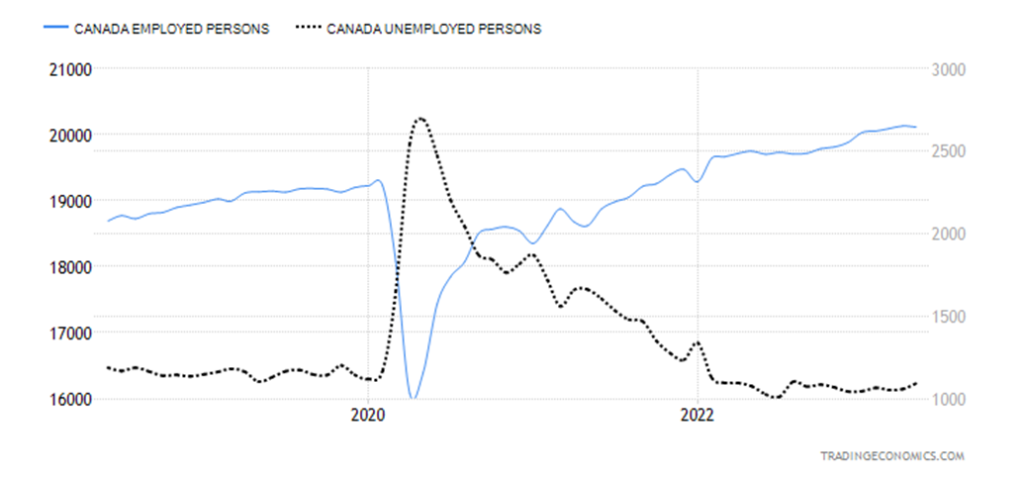
The monthly job numbers can be the most volatile economic report that comes out every month. The trouble is, reports of who is working or not working come from a number of sources. As we noted with the U.S., the Bureau of Labour Statistics (www.bls.gov) puts out two reports: the establishment or population survey which puts out the nonfarm payrolls, and the household survey which puts out the unemployment rate. The two do not necessarily reconcile. The statistics are then reported as well by the Federal Reserve. In Canada, it is handled by one entity, Statistics Canada (www.statcan.gc.ca). The Bank of Canada (www.bankofcanada.ca) also has statistics, but they generally centre on interest rates and money.
And so, once again, we got surprises in the monthly job numbers in Canada. The market was looking for a gain of 23,200 jobs. Instead, jobs actually fell 17,300 a miss of about 40,000. The unemployment rate rose to 5.2% when it was only expected to rise to 5.1%. It had held steady at 5% for the previous five months. No surprise then to see that the number of employed persons was 20,112.9 thousand while the number of unemployed persons rose to 1,093 thousand from 1,058.2 thousand. The unemployment rate reported is Canada’s headline rate, not dissimilar to the U.S.’s U3 unemployment rate. But it is not the same as the methodologies are different. Stats Canada also reports other unemployment rates and its R8 rate, the highest reported (somewhat similar to the U.S.’s U6 rate) was reported at 7.2% which was a decline from April’s 7.5%. The R8 rate includes discouraged searchers and waiting searchers of involuntary part-time workers.
The labour force participation rate actually fell to 65.5% from 65.6%. Usually that helps the unemployment rate but not this time. Full-time employment fell 32,700 while part-time employment rose 15,500. This is the second decline for full-time and second rise for part-time. Wage increases were up only 1.4%, down from the previous month’s 1.9%. Both are annual numbers. Average hourly earnings were up 5.1% (May) on the year vs. the inflation rise that was last reported up 4.4% (April).
The job losses in May may have ended an 8-month upward streak. But don’t expect the BofC to respond with a knee-jerk reaction. May is only one month. The earlier part of the year was quite strong and above expectations. Add that to a rebound in housing activity, plus the strong Q1 GDP report, and the BofC may still feel justified for its latest interest rate hike. The BofC next reports its rate decision on July 12.
Chart of the Week
Going Up in Smoke
Climate change, or should we more accurately call it weather disasters, is challenging and upsetting the insurance companies that provide property and casualty insurance. Devastating fires here in Canada, and in the U.S., especially California, huge deadly hurricanes, floods, and more are costing the insurance industry hundreds of millions and now some insurance companies (many? all?) are pulling that coverage. Major insurance companies such as All State (ALL/NYSE) and State Farm have announced that they will no longer provide home insurance to customers in California due to the costs associated with wildfires. It’s also hitting flood zones and hurricane zones, especially in Florida, Louisiana, and Texas.
Here in Canada, the largest property and casualty insurance company is Intact Insurance (IFC/TO), followed by Aviva. No word on whether they are continuing insurance in fire and flood zones.
Yes, insurance may still be available from some companies, but the cost may be prohibitive. Homes in Nova Scotia are also being impacted as insurance companies have stopped issuing new policies for current evacuation zones. Property insurance may be based on long-term trends, but the trends are narrowing, as weather disasters become more frequent and more deadly. According to one article, there are some 1.5 million homes in Canada that are uninsurable because they are on flood plains. In the U.S., you can probably multiply that by even a factor up to 10 which is the population differential between Canada and the U.S.
Up until 2009, average losses in the U.S. were about $400 million annually. Now that figure is over $2 billion and climbing. They are not just going in the wrong direction—they are accelerating. Yes, there is government aid and even government insurance programs, but they do have their limits and can only provide so much. All this shifts more and more of the responsibility on to the home owner.
State Farm and All State are the largest and fourth largest insurance providers in North America. Not only are they and others citing rising risks, inflation, and reinsurance costs, but they are noting that it is a “rapidly growing catastrophe exposure.” How the home owners are going to respond is unknown, but a lot of people already homeless as FEMA-type camps grow are going to be facing moving. This could also bounce back on mortgage lenders who need to know the property is insured. No insurance, no mortgage?
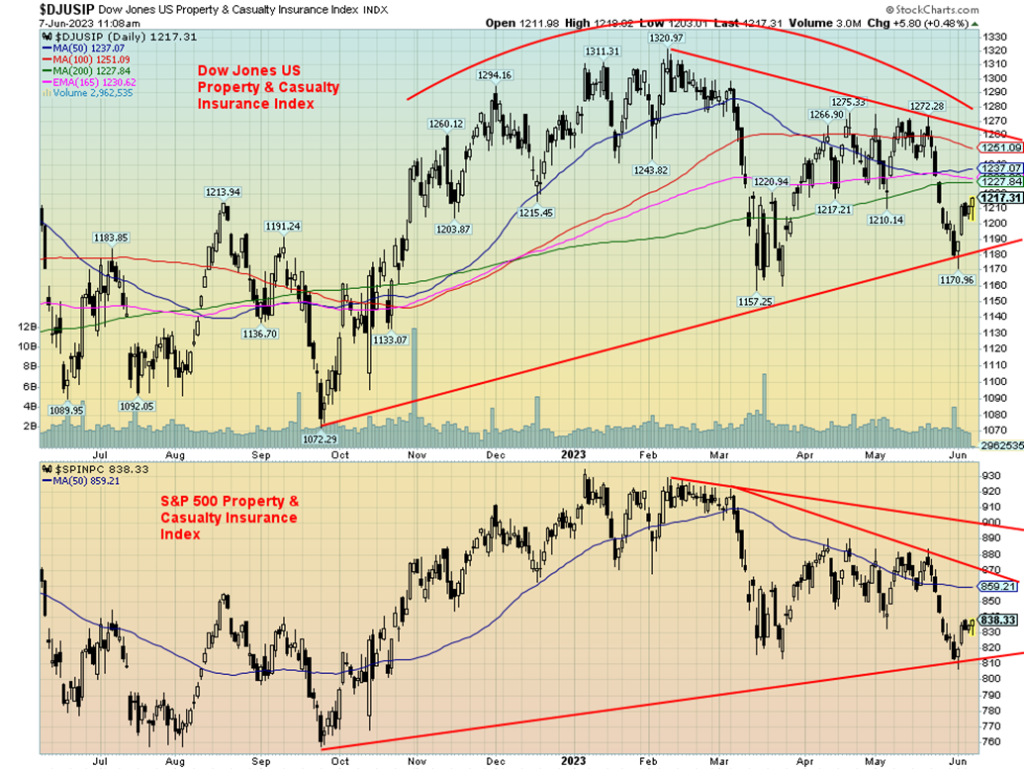
It’s hard to believe that the property and casualty insurance indices pictured above didn’t make their final top until February 2023. However, they have been topping through 2021 and 2022 and may now have put in their final top. That top actually exceeded the top seen in early 2022 when the Dow Jones Industrials (DJI) and the S&P 500 topped. Pictured above is the Dow Jones Property & Casualty Insurance Index as well as the S&P 500 Property & Casualty Insurance Index. Both appear to have broken down and are now trading below the 200-day MA. The chart of All State is very similar, which shouldn’t be a surprise. State Farm is private as it is a mutual insurance company.
But now these indices are clearly diverging with the market as the S&P 500 and NASDAQ have gone on to new highs but the above indices are nowhere near their former highs. The high cost of providing insurance—coupled with huge payouts and now the dropping of insurance coverage for high-risk areas—is undoubtedly putting pressure on their earnings and therefore on the stock price. Both indices are trying to rebound with the market but are well short of previous highs. The Dow Jones Property & Casualty Insurance Index breaks down under 1,180 while the S&P 500 Property & Casualty Insurance Index breaks down under 810. You could say they are both going up in smoke.
Markets & Trends
| % Gains (Losses) Trends | ||||||||
| Close Dec 31/22 | Close Jun 9, 2023 | Week | YTD | Daily (Short Term) | Weekly (Intermediate) | Monthly (Long Term) | ||
| Stock Market Indices | ||||||||
| S&P 500 | 3,839.50 | 4,298.86 | 0.4% | 12.0% | up | up | up | |
| Dow Jones Industrials | 33,147.25 | 33,896.78 | 0.3% | 2.2% | up | up | up (weak) | |
| Dow Jones Transport | 13,391.91 | 14,246.36 | 0.7% | 6.4% | up | up (weak) | up (weak) | |
| NASDAQ | 10,466.48 | 13,259.14 (new highs) | 0.5% | 26.7% | up | up | up (weak) | |
| S&P/TSX Composite | 19,384.92 | 19,892.06 | (0.7)% | 2.6% | down | neutral | up (weak) | |
| S&P/TSX Venture (CDNX) | 570.27 | 610.32 | 0.2% | 7.0% | neutral | neutral | down | |
| S&P 600 (small) | 1,157.53 | 1,204.33 | 1.9% | 4.1% | up | neutral | neutral | |
| MSCI World Index | 1,977.74 | 2,122.55 | 1.9% | 7.3% | down (weak) | up (weak) | up (weak) | |
| Bitcoin | 16,535.23 | 28,947.53 | 7.9% | 75.1% | down | up | neutral | |
| Gold Mining Stock Indices | ||||||||
| Gold Bugs Index (HUI) | 229.75 | 245.77 | 2.5% | 7.0% | down | up (weak) | neutral | |
| TSX Gold Index (TGD) | 277.68 | 295.40 | 1.2% | 6.4% | down | up (weak) | up (weak) | |
| % | ||||||||
| U.S. 10-Year Treasury Bond yield | 3.88% | 3.74% | 1.4% | (3.6)% | ||||
| Cdn. 10-Year Bond CGB yield | 3.29% | 3.38% | 4.6% | 2.7% | ||||
| Recession Watch Spreads | ||||||||
| U.S. 2-year 10-year Treasury spread | (0.55)% | (0.86)% | (4.9)% | (56.4)% | ||||
| Cdn 2-year 10-year CGB spread | (0.76)% | (1.11)% | (2.8)% | (46.1)% | ||||
| Currencies | ||||||||
| US$ Index | 103.27 | 103.95 | (0.2)% | 0.7% | up | down (weak) | up | |
| Canadian $ | 73.92 | 74.91 | 0.6% | 1.3% | up | up (weak) | down | |
| Euro | 107.04 | 107.47 | 0.4% | 0.4% | down | down (weak) | down (weak) | |
| Swiss Franc | 108.15 | 110.68 | 0.6% | 2.3% | down | up | up | |
| British Pound | 120.96 | 125.78 | 1.0% | 4.0% | up | up | down (weak) | |
| Japanese Yen | 76.27 | 71.73 | 0.4% | (6.0)% | down | down (weak) | down | |
| Precious Metals | ||||||||
| Gold | 1,826.20 | 1,977.22 | 0.4% | 8.3% | down | up | up | |
| Silver | 24.04 | 24.41 | 2.8% | 1.5% | neutral | up (weak) | up (weak) | |
| Platinum | 1,082.90 | 1,012.80 | 0.9% | (6.5)% | down | up (weak) | up | |
| Base Metals | ||||||||
| Palladium | 1,798.00 | 1,304.80 | (7.0)% | (27.4)% | down | down | down | |
| Copper | 3.81 | 3.79 | 1.6% | (0.5)% | neutral | neutral | neutral | |
| Energy | ||||||||
| WTI Oil | 80.26 | 70.17 | (2.2)% | (12.6)% | down | down | neutral | |
| Nat Gas | 4.48 | 2.25 | 3.7% | (49.8)% | down (weak) | down | down | |
New highs/lows refer to new 52-week highs/lows and, in some cases, all-time highs.
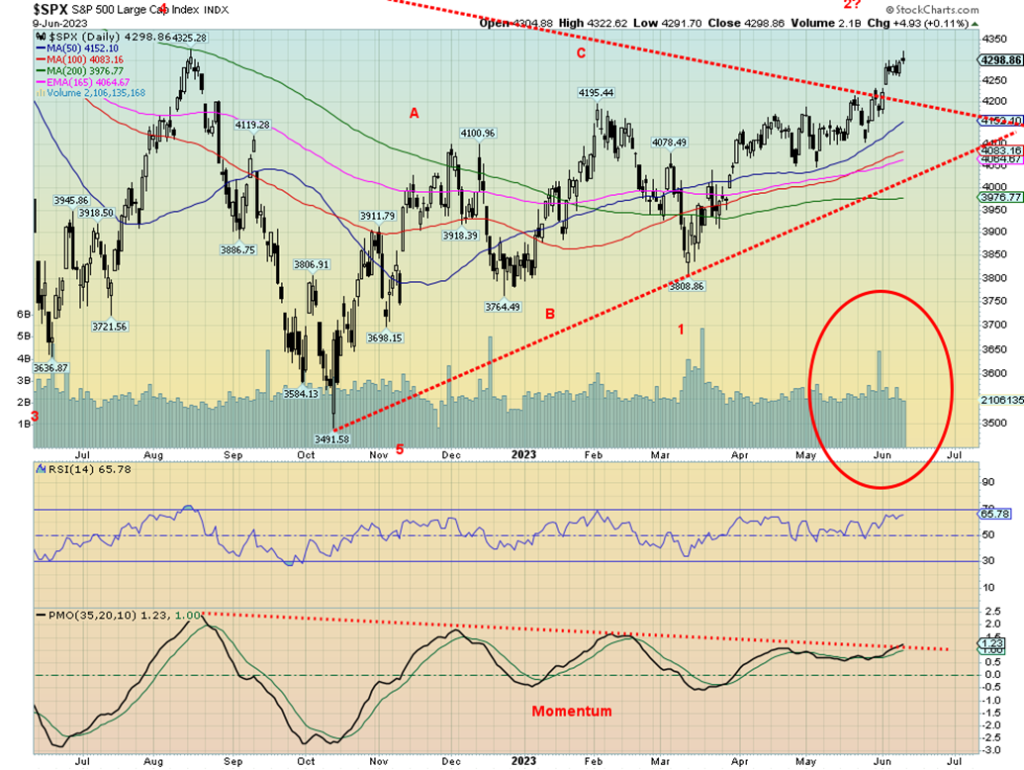
All hail the new great bull market. Okay, just the S&P 500 (the NASDAQ was already there) as this past week the S&P 500 had now gained over 20% from that October 2022 low. On the week it was up 0.4%. We’ve also broken well above the downtrend line from the January 2022 top. All hail the new bull?
Well, that might be premature as, outside of the NASDAQ (and the NY FANG Index) plus a few other NASDAQ related indices, no one else is making new highs. The NASDAQ was up 0.5%. Okay, the S&P 500 is close as the week’s high was just shy of that August 2022 high of 4,325 (high this week was 4,322). Maybe next week? But others refused to confirm. The Dow Jones Industrials (DJI) gained 0.3% on the week, while the Dow Jones Transportations (DJT) fell 0.7%. The S&P 500 Equal Weight gained 0.9% but remains well off its high and is up only 2.4% in 2023 vs. 12.0% for the S&P 500. The S&P 400 (Mid) was up 1.5% while the S&P 600 (Small) gained 1.9%. With the Mid and the Small starting to rise, is that confirmation that we are in a new bull? Or is it that the Johnny-come-latelies are getting in at the top? Retail tends to surge at the top.
In Canada, the TSX Composite didn’t follow, losing 0.7% while the TSX Venture Exchange (CDNX) eked out a 0.2% gain. In the EU, the London FTSE fell 0.6%, the EuroNext lost 0.4%, the Paris CAC 40 was off 0.8%, and the German DAX dropped 0.6%. Europe was a loser. The U.S., a winner. In Asia, China’s Shanghai Index (SSEC) was flat, the Tokyo Nikkei Dow (TKN) did it again with another new high, up 2.4%, and Hong Kong’s Hang Seng Index (HSI) gained 2.3%. U.S. up, EU down, Asia up. Bitcoin may be a leader to the downside as the crypto exchanges continue to be under investigation. Bitcoin lost 7.9% this past week.
We don’t wish to be party poopers, but we are seeing far too many negative divergences to suggest that we are really on the cusp of the great new bull market. A strong correction, yes; a new bull, no. During the down years of 1966–1982, there were five bull markets with gains of 51.2%, 33.4%, 73.1%, 23.1%, and 43.1% before the final bottom came in August 1982. At that point, it wasn’t a new low for the S&P 500 below the 1974 low, but it was new low on an inflation-adjusted basis. None of those bulls back then persisted and all died. During the 2000–2009 bear, we had the spectacular 2002–2007 bull where the S&P 500 gained over 100%. However, the 2009 low was still below the 2002 low and the 2007 high never exceeded the 2000 high by very much, only about 40 points. Still, there is no denying we could go higher. But will the other indices join? That is the question. It has been a very narrow rally as we have pointed out, led by the FAANGs and AI stocks. Nvidia, anyone? Up 165% so far in 2023. And numerous indicators are diverging as we can see from the momentum indicator for the S&P 500, although it appears poised to break over its downtrend line to confirm the up move.
We are not denying that we could go higher, and maybe the good rise in the Mids and the Smalls this past week is a positive sign and not just retail rushing in at the top. We could exceed that August high this coming week, setting fresh 52-week highs. But as of Friday, we were still down about 11% from the January 2022 all-time high. So, while the trend is firmly up there, there are warning signs. And our expectation is that we could well remain in an overall bear for a few more years. Reminds us of that 1966–1982 bear. But also, a reminder that commodities soared in the 1970’s even as the stock markets languished. For the short term, we are a bit overbought and the market is getting a bit frothy.
The Fed this week could help determine if we go higher. A pause could be good for the market and send us higher. But if the Fed hikes, it may also send us higher if they think that they instead will pause in July. That 1966–1982 bear had a lot of ups and downs. Is this market shaping up like that one? Inflation was a common theme in the 1970s, just as it is now. And, just like then, there were a lot of different wars going on, including the Cold War, which was at its height. Today, we have a new Cold War that could get hot. All that could keep the stock markets spinning, with bears followed by bulls, etc.
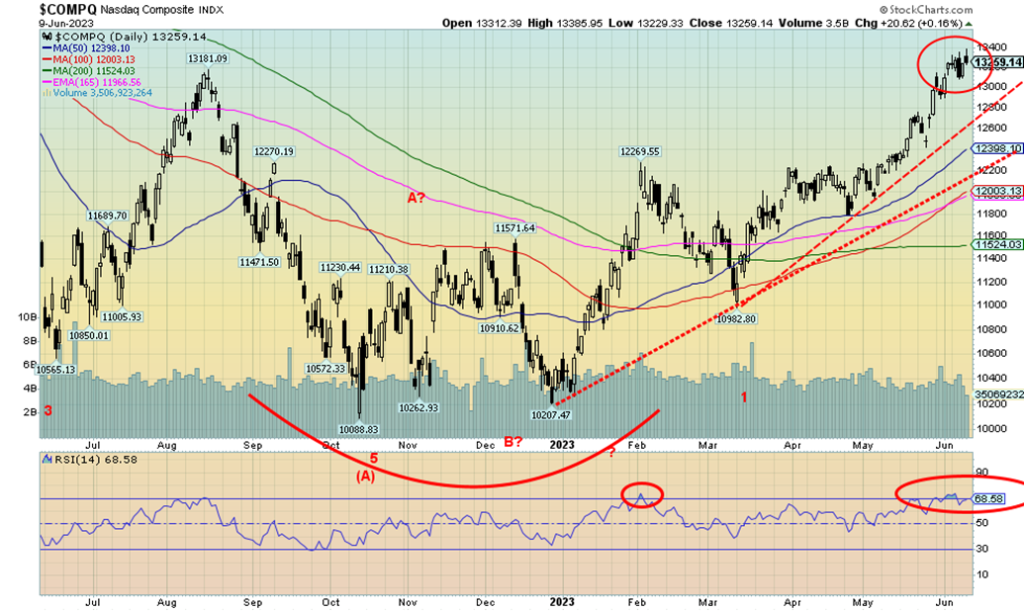
The NASDAQ bull market continues. Last week the NASDAQ gained 0.5% to fresh 52-week highs while the NY FANG Index also made 52-week highs, up 1.2% and up a whopping 67.5% in 2023. The NASDAQ is up 26.7%, continuing its bull market. But it is overbought. The RSI is at 68.58 below the 70 threshold. However, the NASDAQ spent several days over 70 before pulling back this past week. Still, that does not rule out higher prices. Of the FAANGs, five made new 52-week highs, including some making all-time highs. Making new highs were Meta, Apple, Netflix, Google, and Microsoft. Elon Musk has become the richest man in the world again, thanks to a gain of 14.2% this past week for Tesla. Tesla is up 98.3% in 2023. Seems that the other electric car companies want to use a standard charger made, of course, by Tesla. We should note that there was one other significant 52-week this past week, which was not a FAANG. Yes, Berkshire Hathaway also made new highs up 1.6% on the week, but is up only a modest 9.3% in 2023. Didn’t hurt Warren Buffet, did it? But Warren is not quite in Elon’s league. A breakdown under 13,000 would tell us this bull is in trouble. Under 12,600 it’s over. But, right now, it just keeps going higher—and higher.
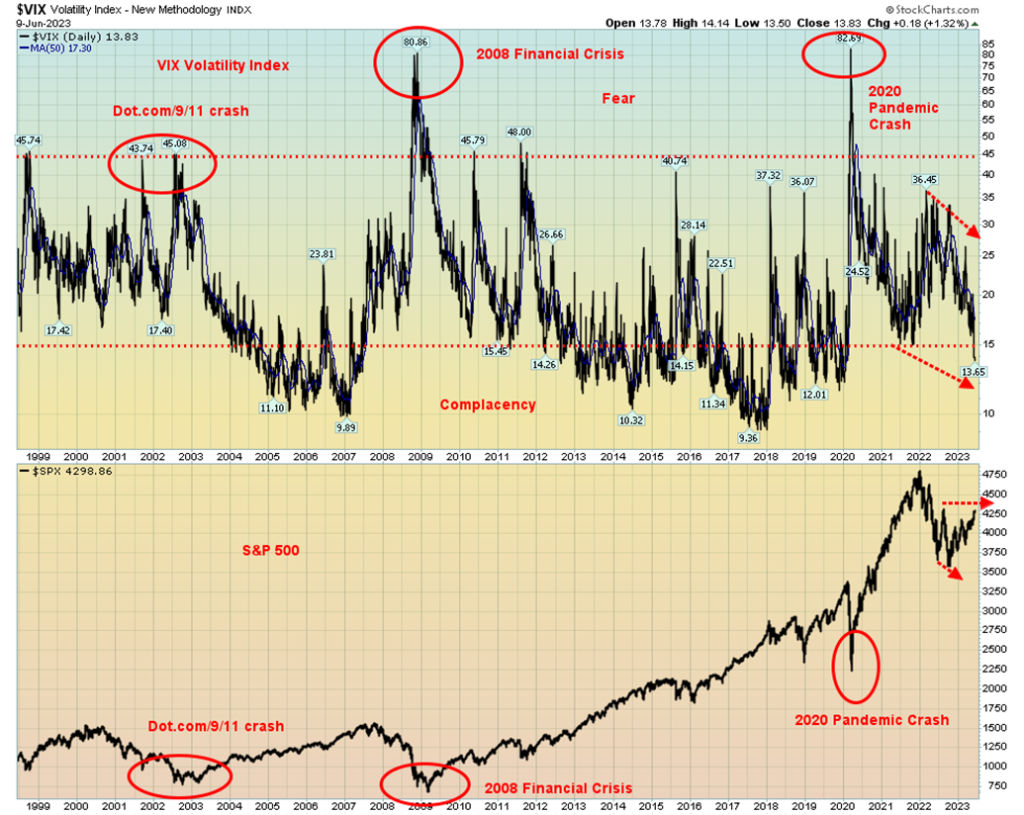
We continue to add to our negative divergences. Here is the VIX Volatility Indicator. Note that it plunged to new lows this past week but the S&P 500 has not yet reached new highs. The VIX is now in the complacency zone. Yes, it can go lower, but at 13.65 it is the lowest seen since just before the 2020 pandemic. Note how at the recent S&P 500 low the VIX was making a lower high, another divergence that suggested we might rally. We did. We also can’t help but notice that the Fear & Greed Index (https://www.cnn.com/markets/fear-and-greed?utm_source=business_ribbon) has reached extreme greed. Something more to keep in mind when everyone is hailing the great new bull market.
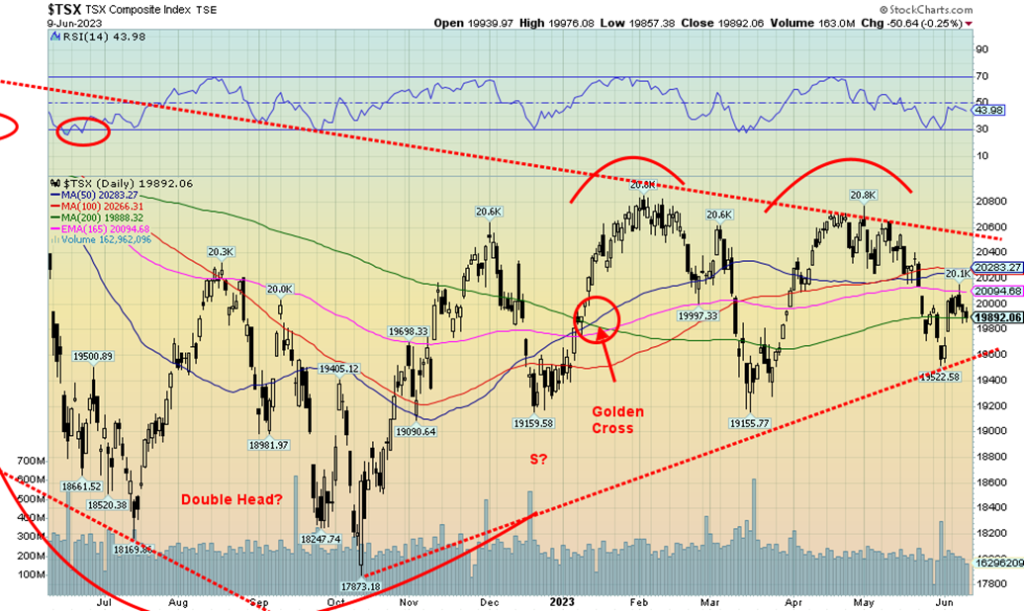
The TSX Composite went against the U.S. stock markets this past week as it was a loser, down 0.7%. That stands in sharp contrast to the U.S. stock markets that were up. And no official bull market for the TSX, unlike the S&P 500 (and NASDAQ). The TSX Venture Exchange (CDNX) was a winner, up 0.2%. Okay, barely a winner. Of the 14 sub-indices on the TSX, only the TSX Energy Index (TEN) was up, gaining 1.0%. The biggest loser? The TSX’s favourite whipping boy Health Care (THC), down almost 6.0%. It keeps going “up in smoke.” Consumer Staples (TCS) was a surprise down, almost 4.0%. Other significant losers were Golds (TGD), down 2.1%, and Industrials (TIN) off 2.6%. Financials, the largest component, fell 0.3%. With Financials off small and Energy being the second largest component, it helped contain the TSX’s loss to 0.7%. Friday’s close was at the 200-day MA so that might provide support for a rise this week. A break under 19,800 could send us lower to that uptrend line near 19,500. A break over 20,300 would be positive, but a break over 20,600 is needed to confirm that we are going higher. Our favourites remain the commodity sectors of Golds, Metals & Mining, Materials, and Energy. Avoid Health Care.
U.S. 10-year Treasury Bond/Canadian 10-year Government Bond (CGB)
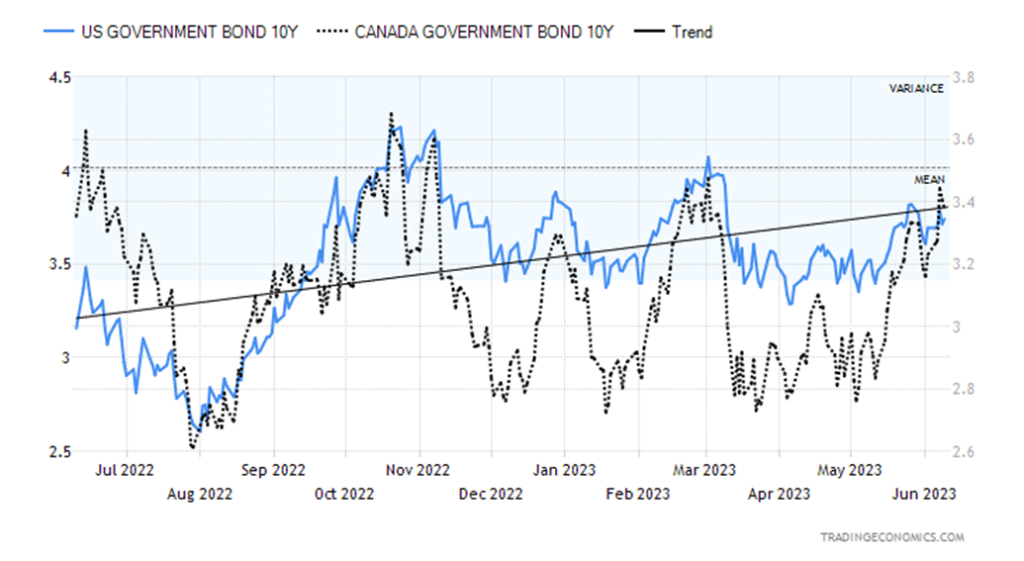
Bond yields rose this past week as some economic numbers continued to point to the resilience of the U.S. economy. The Global Services PMI came in at 54.9, just below expectations of 55.1 but above April’s 53.6; factory orders for April rose 0.4%, below expectations of a gain of 0.8%; the U.S. balance of trade for April was a deficit of $74.6 billion, about on expectation but higher than March’s deficit of $60.6 billion; and initial jobless claims surprised as they were 261,000, above expectations of 235,000 and last week’s 233,000. However, the surprise that might have helped push bond yields higher was the BofC hiking its rate to 4.75% from 4.50%. It had been expected that the BofC would stand pat again, even though there was some above- expectation growth this past quarter. Still, it surprised the market and then the odds began to grow that the Fed might hike again next week, especially given the earlier job numbers.
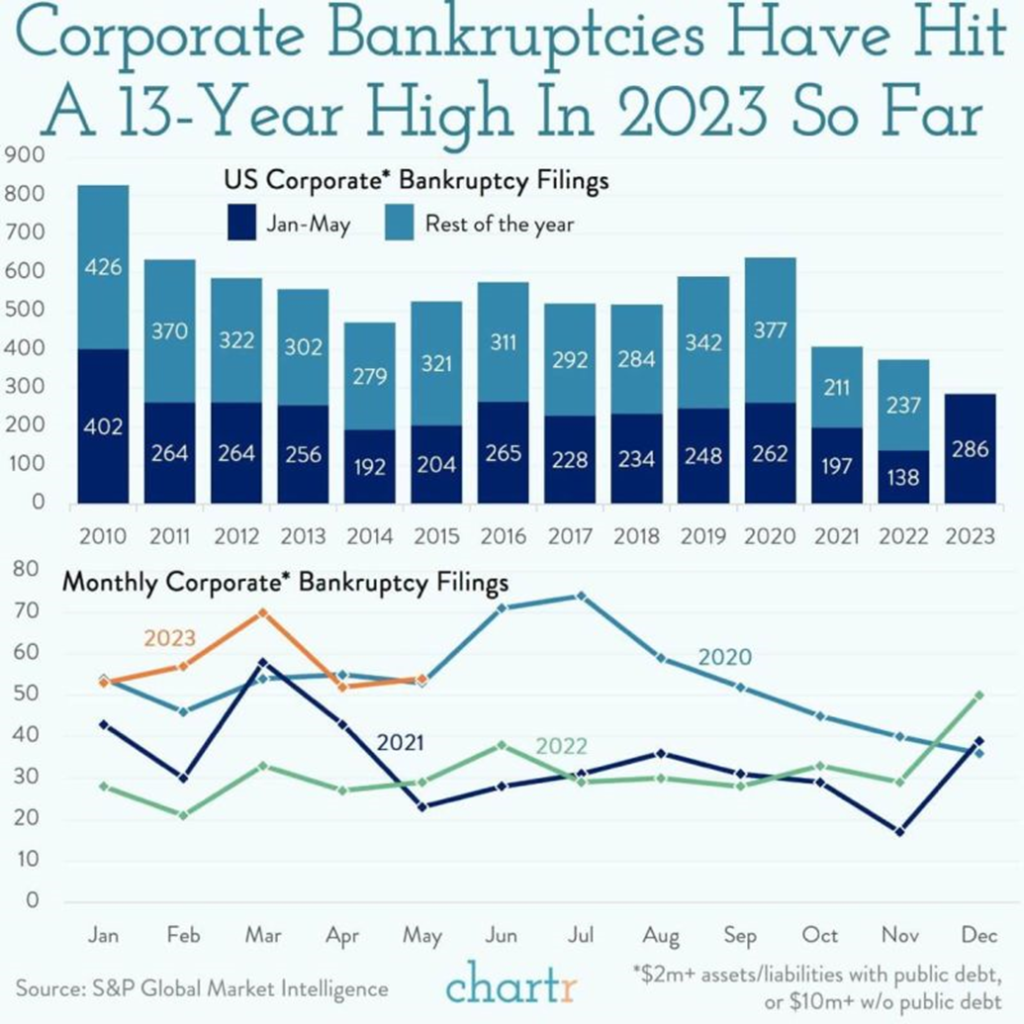
As to the economy, there continue to be layoffs but they are not really showing up in the job numbers, yet. There remain problems in the commercial real estate market and even the household real estate market as well as growing bankruptcies in the corporate sector (see chart below). We’ve seen bankruptcies in the banking sector, led by SVB Bank, and the corporates with Bed Bath and Beyond. Many think the problems in the banking sector are now over, but problems remain.
Overall, the U.S. 10-year treasury note rose to 3.74% from 3.69% and the Canadian 10-year Government of Canada bond (CGB) was up to 3.38% from 3.23%. Our 2–10 spreads continue to widen with the U.S. 2–10 up to 86 bp and the Canadian 2–10 up to 111 bp.
This coming week is a busy one. The FOMC meets on June 13–14 and there is growing expectation that the Fed might actually hike 25 bp. It would be a surprise as there had been thoughts the Fed would pause. We’ll have to wait until 2 pm Wednesday. The fun starts on Monday with consumer inflation expectations. On Tuesday, we get the May CPI looking for a year-over-year (y-o-y) rise of 4.1% vs. April’s 4.9%. Wednesday brings us the PPI looking for 1.5% vs. 2.3% in April. Retail sales are out on Thursday, looking for a decline of 0.1% for May vs. a gain of 0.4% for April. The Philly Fed is also out where the reading is supposed be negative— 13.5% vs. negative 10.4% in May. The week ends with the Michigan Consumer Sentiment Index looking for a reading of 60 vs. 59.2. Lots to ponder for the week.
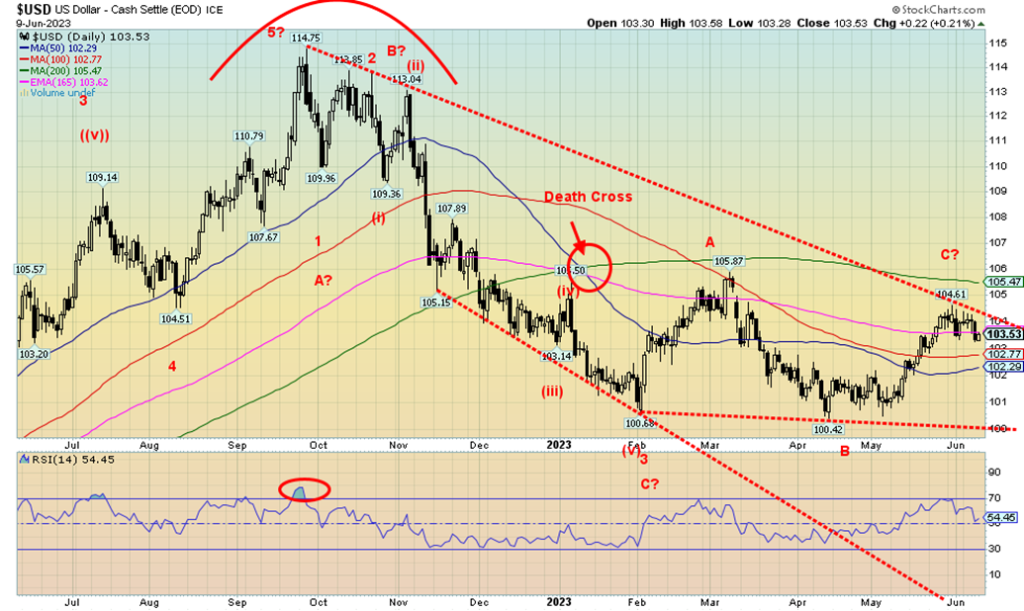
The US$ Index slipped 0.4% this past week. Have we completed the up wave? That is hard to determine at this point. We are currently at support of the 100-day MA and below the downtrend line from the October top. A burst to new highs above 104.61 could send the US$ Index to 105.50 and the 200-day MA. To the downside, only a firm break under 102 would tell us we have most likely topped. Below 100 we enter the next phase of the US$ Index bear. All along we believe we are on the C wave of a potential ABC correction to the five wave downs from October 2022 to the low in February 2023 at 100.60. It appears to us as an ABC flat, which means we shouldn’t exceed that March high of 105.87 by much, if at all.
On the week, the euro was up 0.4%, the Swiss franc gained 0.6%, the pound sterling was up 1.0%, and the Japanese yen gained 0.4%. The Canadian dollar joined the party, gaining just under 0.6%.
Despite the pullback this past week, we remain slightly positive to the US$ Index moving higher before this corrective pattern is finished. This coming week’s FOMC should help determine its move. If the Fed hikes, the US$ Index should rise. If it pauses, then it could fall. But there are a lot of numbers out this week, as outlined under bonds. Depending on how they are received, that will determine if the US$ Index goes higher or lower.
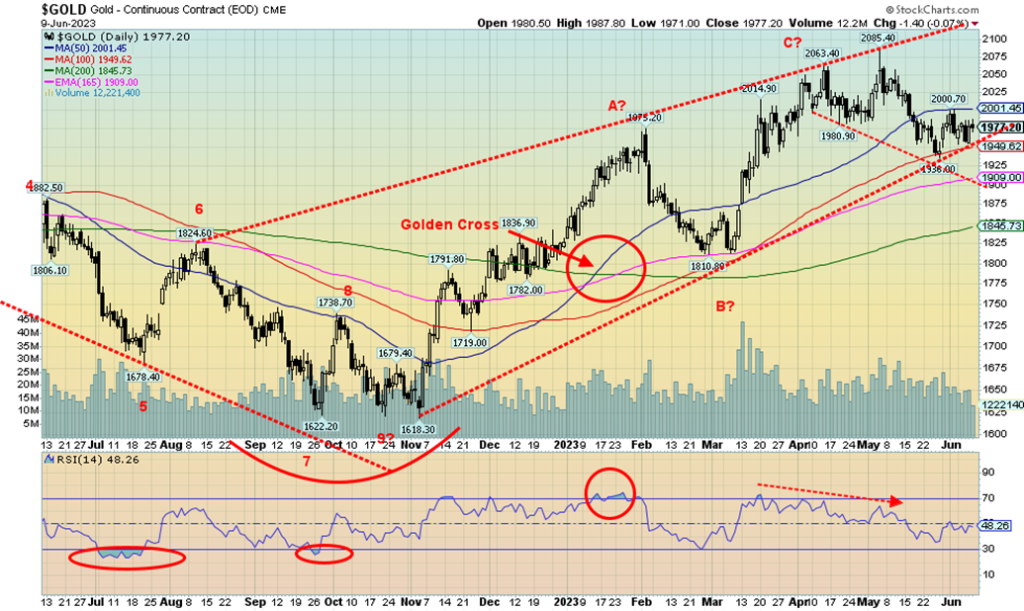
Gold rose this past week by 0.4%. That was feeble beside silver’s rise of 2.8%. Platinum was up 0.8. Of the near precious metals, palladium continued its slide, losing 7.0% but copper rose 1.6%. There are reports that copper could soon be in short supply. As to the gold stocks, the Gold Bugs Index (HUI) fell 1.1% while the TSX Gold Index (TGD) was off 2.1%. Gold, silver up, gold stocks down. A divergence. Gold continues to hold an uptrend line from the November low and also holds above the lower channel of what appears as a potentially developing broadening channel. We could get a rise to $2,100 and still be in that channel, setting up the potential for another drop that could follow.
We keep reminding ourselves that we have not as yet confirmed our cycle lows of 7.83-years and 23.5-years. Was that low last November at $1,618 it? It was in the time frame, but very early. Ideally, that low could come in the fourth quarter. December is a month that has in the past seen significant lows for gold. We noted divergences at the recent highs with the falling RSI indicator, even as gold made slight new highs.
Right now, only a move back above $2,000–$2,025 could indicate we might be going higher. Above $2,050, new highs become probable. That’s after making the high at $2,085, which fell just short of the all-time high set in August at $2,089. Since then, we’ve been in a correction. This might only be the B wave with a C wave to come to the downside.
The gold bulls keep touting the arrival of the great new gold bull market. They may be right, but right now they are early and until we confirm these important cycle lows the risk remains to the downside, not an upside breakout—just yet. A pause this Wednesday by the FOMC could go a long way to at least sparking a near-term rally. A hike could send gold lower.
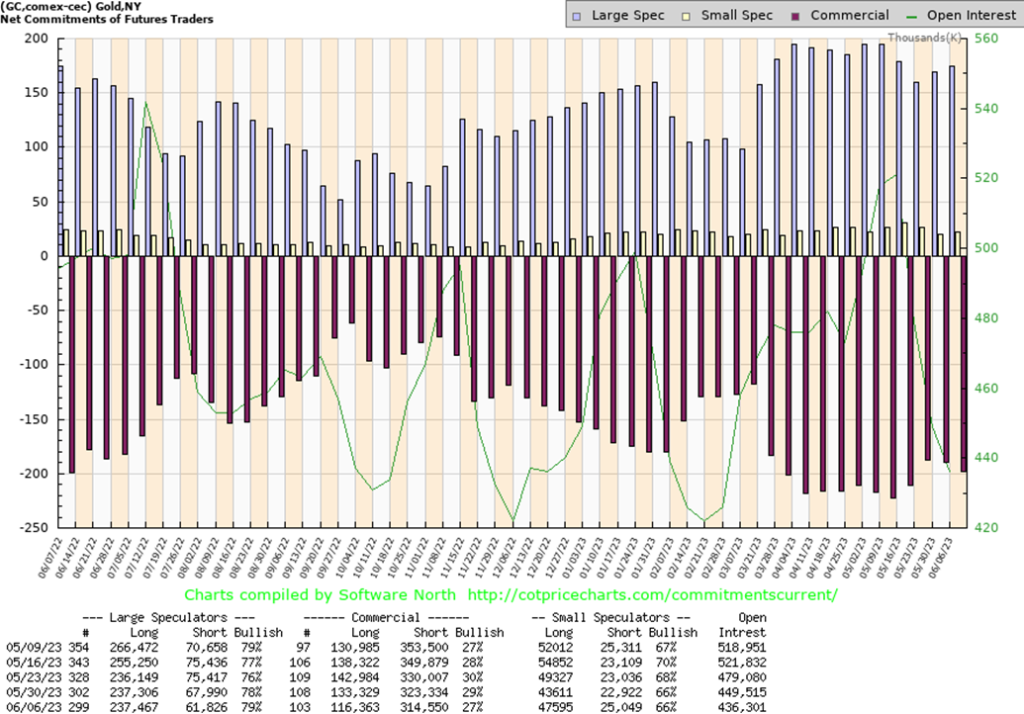
The gold commercial COT (bullion companies and banks) slipped to 27% this past week from 29%. A setback? Long open interest fell roughly 17,000 contracts while short open interest was down about 9,000 contracts. The large speculators COT (hedge funds, managed futures, etc.) rose to 79% from 78% as they slashed their shorts by roughly 6,000 contracts while longs were unchanged. Overall, open interest was down about 13,000 contracts, suggesting this past week was all about long covering. We seemed to have been improving, so this past week was a bit of a setback. We don’t believe it changes the narrative of a rising gold market, but it is a caution. Silver was up, so that helps.
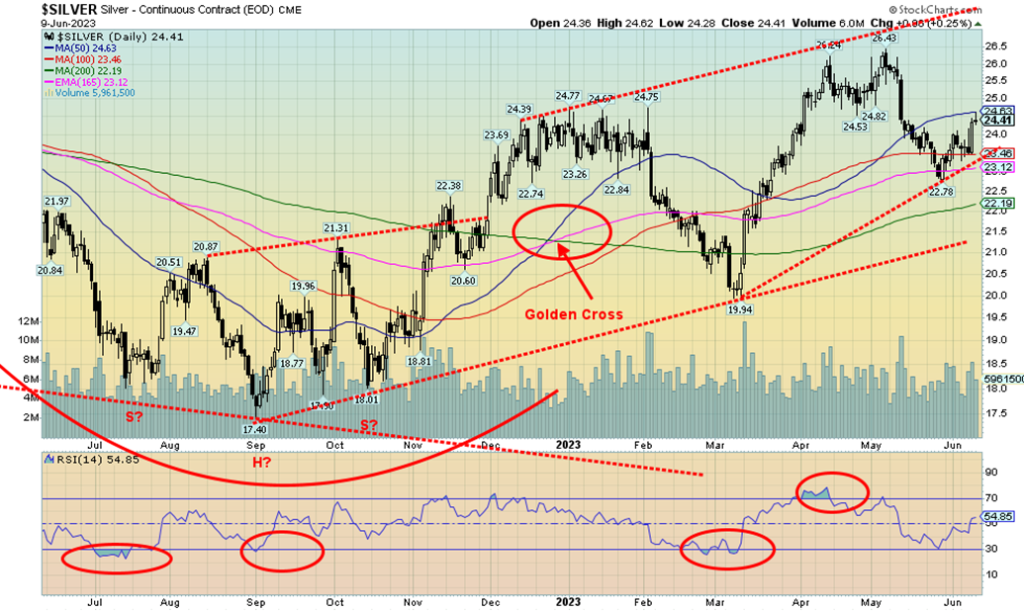
Silver had a good week, gaining 2.8%, outperforming gold by a good margin. But, as we note with the TSX Gold Index (TGD), the stocks did not fare as well. Both gold and silver stocks were down on the week. Who is right? Both cannot be right. Silver rose, but ran into the 50-day MA on Friday before settling back. A move above $25 would go a long way to potentially confirming a low at $22.78. New highs above $26.43 the May high would confirm that we are going higher. Despite the nice gain this past week, it may only be a correction to the downdraft that started in May at $26.43. As with gold, a June low would be good, but we acknowledge we could go into July before we find our low. That long-term uptrend line is near $21.50, so we can’t dismiss it as a potential target. The 200-day MA is at $22.20, so that is another potential target. The FOMC on Wednesday could be key to the next direction for silver.
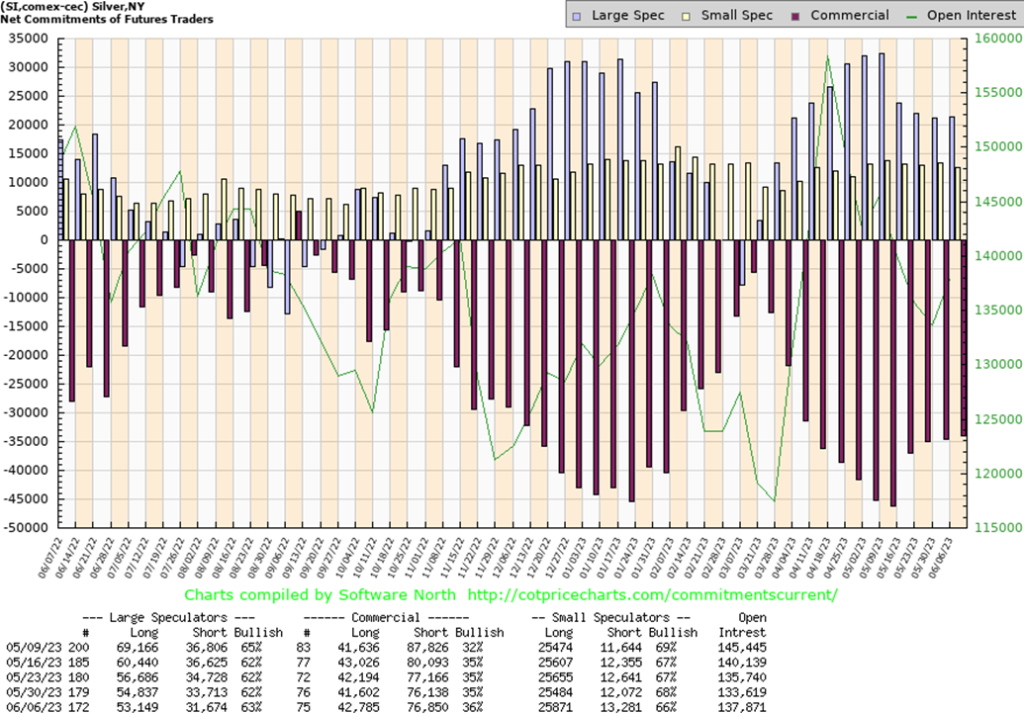
The silver commercial COT rose to 36% from 35% this past week. A potential positive development, given silver’s rise this past week. Long open interest was up only about 1,000 contracts while short open interest was largely unchanged, up about 600 or so contracts. Open interest rose over 4,000 contracts on an up week for silver. The large speculators COT rose to 63% from 62% as they cut roughly 2,000 shorts but also cut over 1,000 longs. Overall, the COT is positive for silver, but definitely not at levels we’d love to see well up in the 40s.
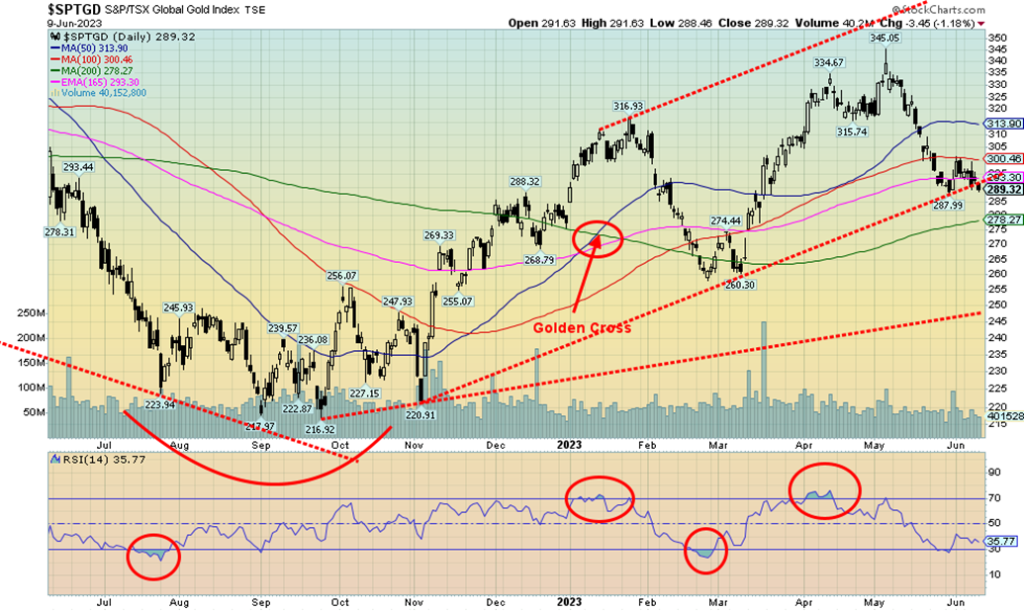
Are the gold stocks breaking down? The TSX Gold Index (TGD) appears to be breaking under its uptrend line the November low. But the Gold Bugs Index (HUI)? Not so much. We don’t put a lot of trust in the TGD going slightly under the uptrend line. Both gold and silver were up on the week. The trouble was that the gold stocks didn’t follow. The TGD lost 2.1% while the HUI fell 1.1%.
For the TGD, the 200-day MA is below at 278 with further support down to 275. Long-term support is way down at 245/250. We don’t expect to reach that low. Regardless of this, with the gold stocks going against both gold and silver this past week it is confusing. Who is right? The commodity? Or the gold stocks? We go with the commodity and if gold and silver follow through with another rise this coming week, we expect the gold stocks could launch a catch-up. That could result in a big up day along the way.
For the TGD, a break over 300 would be helpful, but on the other hand we need to hold 288 which is tantalizingly close to this week’s close of 289. Could we dip slightly under that level before returning to the upside? Yes, but the HUI, which is nowhere near a similar point, probably won’t confirm the TGD making minor new lows. We also have some positive divergences for the TGD, although they are not strong. As noted, a move back over 300 would help confirm a low for the TGD. And, in a worst-case scenario, we need to see the 200-day MA hold at around 275–280.
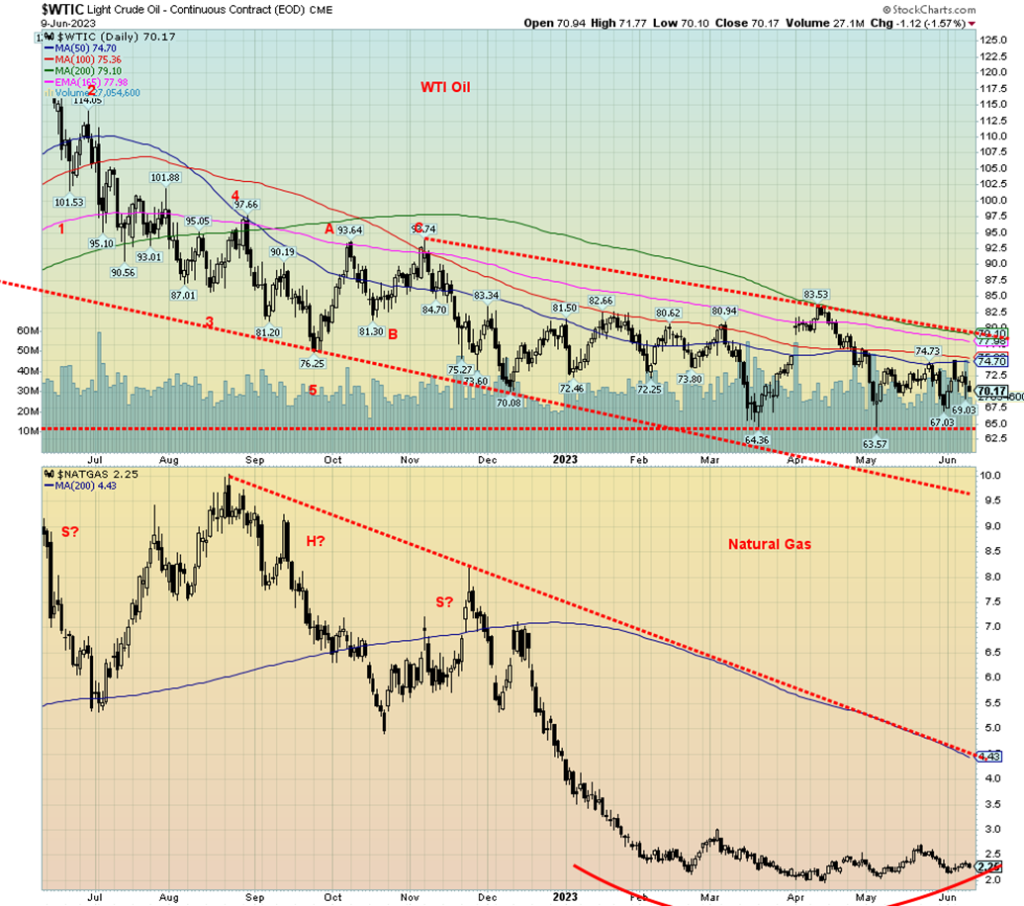
What a confusing week for both oil and gas. First oil. Production cuts were announced by Saudi Arabia at the June 4 OPEC meetings. But Russia didn’t join them and others balked as well. Economic concerns were voiced by China, the U.S., and the EU. All of this resulted in a confusing week for oil that started out going up and ended up going down. On the week, WTI oil lost 2.2% but Brent crude rose 1.8%. What? WTI down and Brent up? Confusing.
This hasn’t changed our outlook for oil that still looks higher once it breaks out over a] $75 and b] $80. At the same time, we must hold above $65. The trouble is, all of this must happen as the seasonals start to turn against oil and gas.
Natural gas (NG) also had its time in the sun. NG at the Henry Hub rose 3.7%, but NG at the Dutch Hub leaped 35.3%. Seems the equation in Europe is changing again. It looked like the EU had ample supplies in storage, but now it’s looking like they have a few problems, with supply issues leaping up again. Storage levels in the EU are at around 70% capacity, but they want 90% by November 1. The U.S. eased off on shipments to the EU as they switched to Asia where demand rose for the summer months. A large French LNG plant is closed for maintenance, although it should open again soon. An LNG plant in Norway is delayed due to technical difficulties. Finally, a Turkish pipeline is closed down for maintenance but should return soon. With all these little problems, that sparked the rise in the EU NG. However, the problems are mostly temporary so we’ll see how this impacts them once they return.
That said, NG continues to form what appears as a potential rounding bottom. Over $3 would help confirm that a low might be in.
The energy stocks seemed to see past all of this and rose this past week. The ARCA Oil & Gas Index (XOI) was up 2.2% while the TSX Energy Index (TEN) gained 1.0%. Both appear to be in a consolidation that could break higher. The XOI must clear 1,750 to confirm a low and the TEN over 240. All the while, their recent lows need to hold. For the XOI that is around 1,570 and the TEN just above 215. If those break instead, we are most likely going lower.
Both oil and gas continue in their recent consolidations. We favour an upside breakout, but recognize until that happens the downside can’t be ignored.
__
(Featured image by nosheep via Pixabay)
DISCLAIMER: This article was written by a third party contributor and does not reflect the opinion of Born2Invest, its management, staff or its associates. Please review our disclaimer for more information.
This article may include forward-looking statements. These forward-looking statements generally are identified by the words “believe,” “project,” “estimate,” “become,” “plan,” “will,” and similar expressions. These forward-looking statements involve known and unknown risks as well as uncertainties, including those discussed in the following cautionary statements and elsewhere in this article and on this site. Although the Company may believe that its expectations are based on reasonable assumptions, the actual results that the Company may achieve may differ materially from any forward-looking statements, which reflect the opinions of the management of the Company only as of the date hereof. Additionally, please make sure to read these important disclosures.
Copyright David Chapman 2023
David Chapman is not a registered advisory service and is not an exempt market dealer (EMD) nor a licensed financial advisor. He does not and cannot give individualised market advice. David Chapman has worked in the financial industry for over 40 years including large financial corporations, banks, and investment dealers. The information in this newsletter is intended only for informational and educational purposes. It should not be construed as an offer, a solicitation of an offer or sale of any security. Every effort is made to provide accurate and complete information. However, we cannot guarantee that there will be no errors. We make no claims, promises or guarantees about the accuracy, completeness, or adequacy of the contents of this commentary and expressly disclaim liability for errors and omissions in the contents of this commentary. David Chapman will always use his best efforts to ensure the accuracy and timeliness of all information. The reader assumes all risk when trading in securities and David Chapman advises consulting a licensed professional financial advisor or portfolio manager such as Enriched Investing Incorporated before proceeding with any trade or idea presented in this newsletter. David Chapman may own shares in companies mentioned in this newsletter. Before making an investment, prospective investors should review each security’s offering documents which summarize the objectives, fees, expenses and associated risks. David Chapman shares his ideas and opinions for informational and educational purposes only and expects the reader to perform due diligence before considering a position in any security. That includes consulting with your own licensed professional financial advisor such as Enriched Investing Incorporated. Performance is not guaranteed, values change frequently, and past performance may not be repeated.


Switzerland’s Medical Cannabis Reform Advances Access, But Barriers Remain
Switzerland’s 2022 medical cannabis reform improved patient access by removing federal approval requirements, but challenges remain. MEDCAN highlights barriers including...


Swisscanto Launches Catastrophe Bond Fund for Portfolio Diversification
Swisscanto launches a Luxembourg UCITS catastrophe bond fund, giving qualified investors access to insurance-linked securities tied to extreme natural events....


AI Agents Transform Payments as Visa, Mastercard, and Qonto Tackle Trust, Liability, and Regulation
Visa and Mastercard are advancing AI-driven autonomous payments, shifting focus to trust, liability, and regulation when agents act without real-time...


Bitcoin ETFs Lead as German Stock Exchange Debuts Mining ETF
Bitcoin and Ethereum remain largely flat, with BTC near 66,600 and ETH around 1,920, while ETFs see steady inflows. A...


Ali G Makes Surprise Wimbledon Appearance with Cannabis-Themed Satire
Sacha Baron Cohen revived his iconic Ali G character at Wimbledon’s men’s final, blending satire with British high society. Dressed...
 |
|
 |  |
 |
|
-

 Cannabis2 weeks ago
Germany Tightens Cannabis Reimbursement Rules: Approved Medicines Must Come First
-

 Crypto1 week ago
Bitcoin’s Price Drops as Investors Turn to Layer 2 Solutions
-

 Crowdfunding2 weeks ago
East Crema Coffee Launches €3.5M Crowdfunding Campaign
-

 Markets3 days ago
Sugar Markets Balance Biofuel Demand and Global Supply