Markets
Why the Bank of Canada Maintained Rates This Past Week
Last week featured the Bank of Canada maintaining rates, S&P 500 and other indices reaching new highs, and notable surges in gold and Bitcoin. Lundin Gold Inc. reported positive production and cost results. Our chart of the week looks at the job numbers surpassed expectations in the U.S. and Canada, but underlying data reveals nuances and divergences, particularly in the U.S.

After three weeks of traveling in the central highlands of Mexico, one gets to see how the other side lives. Mexico is a country with a fascinating history, given that one of the world’s great civilizations grew in Mesoamerica. Of course, that all changed following the Spanish Conquista in 1521, and for the next three hundred years Mexico was New Spain.
Then came the 19th century and the disaster years for Mexico, as one of our tour guides referred to them. In the end, Mexico, following independence from Spain in 1821, found itself embroiled in a century of wars both civil and external. The Mexican-American war of 1846–1848 saw Mexico lose roughly half its territory, giving up what is now Texas, New Mexico, Arizona, California, Colorado, and more.
The civil wars following the Mexican-American war led to the intervention of France and eventually the setting up of the Second Mexican Empire with the installation of Maximillian, an Austrian archduke, as emperor of Mexico. In 1867 Maximillian was executed and the Mexican Republic got underway, leading to the rise of Porfirio Diaz whose period lasted from 1876 until his resignation in 1911. Civil strife continued, culminating in the Mexican Revolution of 1910–1921 that saw over two million killed, mostly civilians.
Mexico has a challenging environment. Unlike the U.S. and even Canada, Mexico is not blessed with an abundance of navigable rivers. Nor does it have much in the way of natural ports on its Pacific, Gulf of Mexico, or Caribbean coasts. The Rio Grande can’t even qualify as really navigable, unlike the Mississippi in the U.S. with its many tributaries. It is a mountainous country throughout, with mountains and jungles in the south and mountains and deserts in the north.
The bulk of the population lives in the central highlands while the arid north and tropical south are only sparsely populated. Mexico’s cities, particularly Mexico City, are overcrowded. Some four-fifths of the population live in urban centres such as Mexico City, Puebla, and Guadalajara. Most of the population lives in three states: Mexico City, the State of Mexico, and the State of Morelos.
Even the coasts are not heavily populated, with the only major cities being Veracruz on the Gulf of Mexico and Acapulco on the Pacific. The border town of Tijuana across from San Diego in the U.S. is also a major population centre. And Cancun on the Caribbean has grown considerably. The north is plagued with cartels and the flourishing drug trade.
Because of the lack of large rivers and lakes, the arid conditions that prevail throughout the country are becoming a major problem. Mexico City and the country are generally facing huge water shortages that threaten the population. The geography, large population, and leaky infrastructure, combined with climate change, are making the country hotter and drier and leading to significant drought conditions. The decline of Mesoamerica was well underway before the Spanish Conquista because of long periods of climate change and drought.
All this is one of the drivers of migration to places perceived as better. However, the U.S. south is also facing some of the same water shortages and drought conditions prevalent in Mexico. Changing climate also impacts weather, as we note the rise of wild fires everywhere, even up into Canada and more recently in Texas, as well as freak storms such as the recent blizzards in California. The resulting cost is largely unknown, but it is estimated to be in the trillions. Insurance companies are taking a lead with refusal to cover significant flood zones or wild fire zones. That alone will change behaviour as to where people live.
We note all this as climate change is merely one of the major issues the world is facing. It is also facing a debt crisis. It seems that we and others have talked about this for ages, but when nothing happens it makes us appear that we are overstating things. After all, the stock market has been booming and the economy hasn’t fallen into recession, while employment remains high and unemployment low despite the sharp rise in interest rates over the past two years.
But all that may be about to change. Delinquencies and bankruptcies are rising in both Canada and the U.S., thanks to high interest rates. We are seeing it everywhere, whether it be mortgages, auto and auto lease loans, credit cards, lines of credit, student loans, etc. The rise in interest rates since 2022 is unprecedented, but to put things in perspective the Fed Funds rate is actually lower today than in 2000. 2000 ended with an effective Fed Funds rate of 6.40%. Today it stands at around 5.33%, but that is up over 6,000% since February 2022. Simply put, people did not prepare for the inevitability of rising interest rates, believing these zero percent rates would last forever.
Canada, for example, has one of the highest household debt/GDP and household debt to disposable income ratios in the world. In household debt/GDP they ranked third in the world in 2023 and in debt/annual disposable income they ranked ninth. The governor of the Bank of Canada, Tiff Macklem, along with others, has warned for some time that Canada’s household debt was unsustainable. Yet it piled on, particularly for mortgages, as many pursued higher and higher house prices.
Performance U.S. Selected Indicators – 2000–2024 % Gain (Loss)
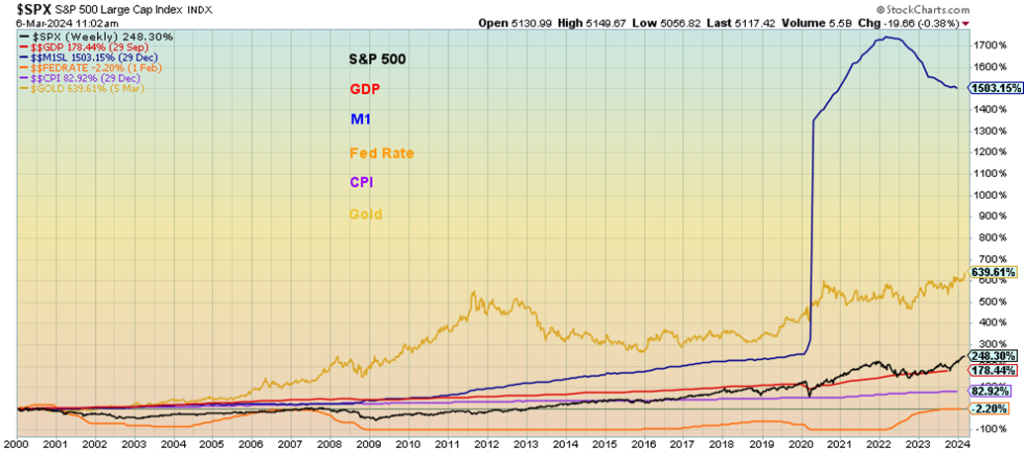
What is interesting about the chart above is not so much that M1 money supply has seen the biggest gain since 2000, up over 1,500% but that gold is also up almost 640% despite the struggles of the past decade. Too bad we can’t say the same for the gold stocks and silver. GDP is up only 178%. The S&P 500 is up 248% despite hitting all-time highs recently. The 2000s were a lost decade for the stock market even as gold soared. A question we need to ask is, would GDP and the stock market have risen to the extent they have without the injection of unprecedented amounts money and ultra-low interest rates? Answer—probably not.
If households are under strain, the corporate market is also seeing strain. Commercial real estate delinquencies are rising and stories of banks in trouble, particularly regional banks in the U.S., are also rising. Recall it was in 2023 that high-profile regional banks such as Silicon Valley Bank (SVB), Signature Bank, Heartland Tri-State, and First Republic Bank suddenly collapsed. There apparently are others on the brink. An example was New York Community Bancorp until it was announced that former Trump Treasury Secretary Steven Mnuchin bailed it out with a $1 billion injection from his company Liberty Strategic Capital. A report from the Social Science Research Network noted there were 186 banks in the U.S. at risk of failure or collapse because of high interest rates, high uninsured deposits, and badly mismatched assets and liabilities.
There has been considerable concern expressed about the high U.S. federal debt that now stands at $34.5 trillion, up 24.5% since 2020 and up over 600% since 2000. Globally, the world has hit $313 trillion in debt. That far surpasses global GDP estimated at $105 trillion in 2023 and the market capitalization of all the stock market indices in the world at $109 trillion in 2023. Global debt to GDP stands at 298%. Western countries, G7, and OECD countries have some of the highest debt in the world and the highest debt/GDP. The U.S. alone represents over 30% of all global debt.
The countries at the biggest risk of default are: Ukraine, Greece, Venezuela, Belize, Jamaica, Argentina, and Belarus. Some 84 countries are listed below a BBB credit rating, the lowest investment grade rating. We counted some 14 countries with a rating of CCC and lower. Some, like Russia and Belarus, are already considered in default even though they were put there artificially through sanctions.
Whether we like it or not, there is a coming sovereign debt crisis. The pandemic years were lost years and, to stave off the effects of the pandemic, governments everywhere spent unprecedented amounts of money as M1 and debt levels soared. The preference was to spend rather than risk a steep recession or worse. But the unprecedented amount of money also found its way into stock markets, housing markets, and more as asset prices soared into a bubble. When the bubble bursts, we await the hangover.
If trouble is brewing, the question is, where will it happen? Will it be a major sovereign default like Russia in 1998 that triggered a market meltdown? Or will it be a major bank or dealer like Lehman Brothers in 2008 that also triggered a market meltdown? We just don’t know. But gold, considered a safe haven, has suddenly leaped to a new record high. Is gold anticipating something?
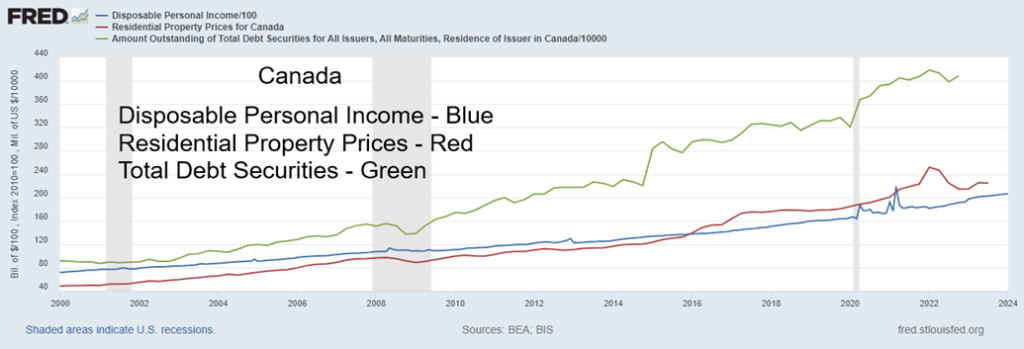
We leave with an interesting chart that highlights the debt problem. The chart above uses Canadian statistics. We note that since 2000 Disposable Personal Income has increased roughly 290%. However, property prices have soared some 466% while total debt is up roughly 446%. Total debt includes federal, provincial, municipal, corporate, and household debt. Soaring debt, soaring housing prices even as they have cooled, with disposable income not even remotely keeping up. It’s a recipe for a very difficult period ahead to deal with the excess debt while property prices are now falling and even with falling house prices income is not keeping up.
We keep asking the question: are we setting ourselves up for the perfect storm? There is immense uncertainty—geopolitical and political unrest, inflation, AI, climate change, massive debt, and potential for social strife and upheaval. We just don’t know where or how it will all fall out.
Chart of the Week
U.S. Job Numbers
U.S. Employed Persons, Unemployed Persons 2014–2024
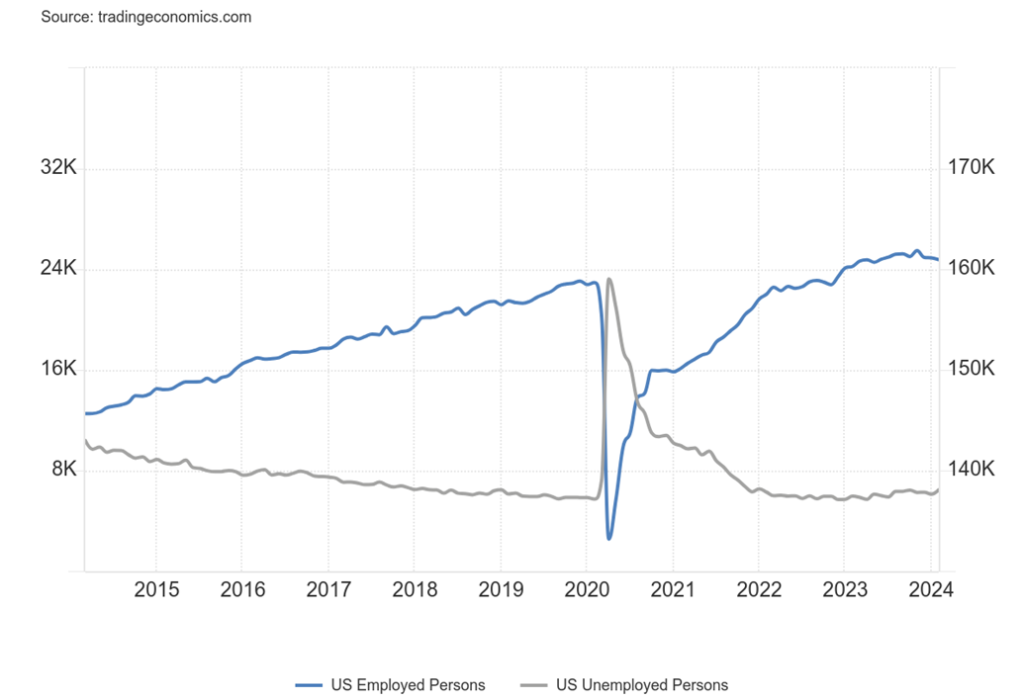
Once again, the nonfarm payrolls surprised to the upside. The January nonfarm came in at up 275,000 when all the market was expecting was 190,000 to 200,000. Ah, but hold on. Both January and December were revised downward by 167,000. Average job gains since August remained high at 288,000 per month. It all sounds great.
But, as we have noted, the jobs report continues to appear to be a report of two different worlds. Yes, there is the establishment report from which we get the nonfarm payrolls, which is based on interviewing establishments measuring employment, hours worked, and earnings by industry. But then there is what many consider more important—the household report which measures labour force status, unemployment,
population, demographics and more. It’s really the tale of two reports. And it’s no surprise that one appears strong (establishment) while one appears weak (household).
The bulk of the numbers comes from the household report. Here it was reported that unemployment rose (U3) to 3.9% from 3.7%, while the U6 unemployment, which adds in all those marginally employed, employed part-time for economic reasons and all those marginally attached to the labour force, rose to 7.3% from 7.2%.
The Shadow Stats (SS) (www.shadowstats.com) unemployment number was 25.8% vs. 25.7%. SS adds U6 unemployment plus all those defined out of the workforce in a revision in 1994. The civilian labour force rose by 150,000, but the employment level fell by 184,000 as full-time employment dropped 187,000 and part-time employment rose by 51,000.
That’s no surprise, since many jobs in February were in food services, bars, etc. with others in social assistance and health care. The labour force participation rate was unchanged at 62.5% while the employment population ratio fell to 60.1% vs. 60.2%. There were fewer participating, and fewer employed as a percentage of the population.
The number unemployed (U3) actually rose by 334,000 while the total population level rose by 171,000. The number of those not in the labour force fell by 687,000 to 100,426 thousand. Of those, 58.6 million are retirees and 8.5 million are on disability. The number for those holding multiple jobs was steady at 5.1%.
The average number of weeks unemployed rose to 20.9 vs. 20.8 while the number unemployed for 27 weeks or longer fell by 26,000. Average weekly hours actually rose to 34.3 from 34.2, seeming to stop a downward drift. Average hourly earnings on a month-to-month basis rose by only 0.1% vs. the expected 0.3% and last month’s gain of 0.5%. Moderating wage gains it seems, although on a year-over-year (y-o-y) basis they were up 4.3% as expected, slightly lower than January’s 4.4%.
So, two surveys. One rosy, one not so rosy. We guess the market liked the not so rosy one as bond yields fell, gold rose to yet another record but then so did the S&P 500. With the strong nonfarm number, the odds of a rate cut from the Fed in March are about zip, but thoughts of a rate cut into May/June remain. The trouble is, despite the job gains, they were part-time ones, and temporary jobs are falling, indicating that employers are not really expanding. Job cuts also continue but don’t seem to be showing up yet in the numbers.
Canada Job Numbers
Canada Employed Persons, Unemployed Persons 2014-2024
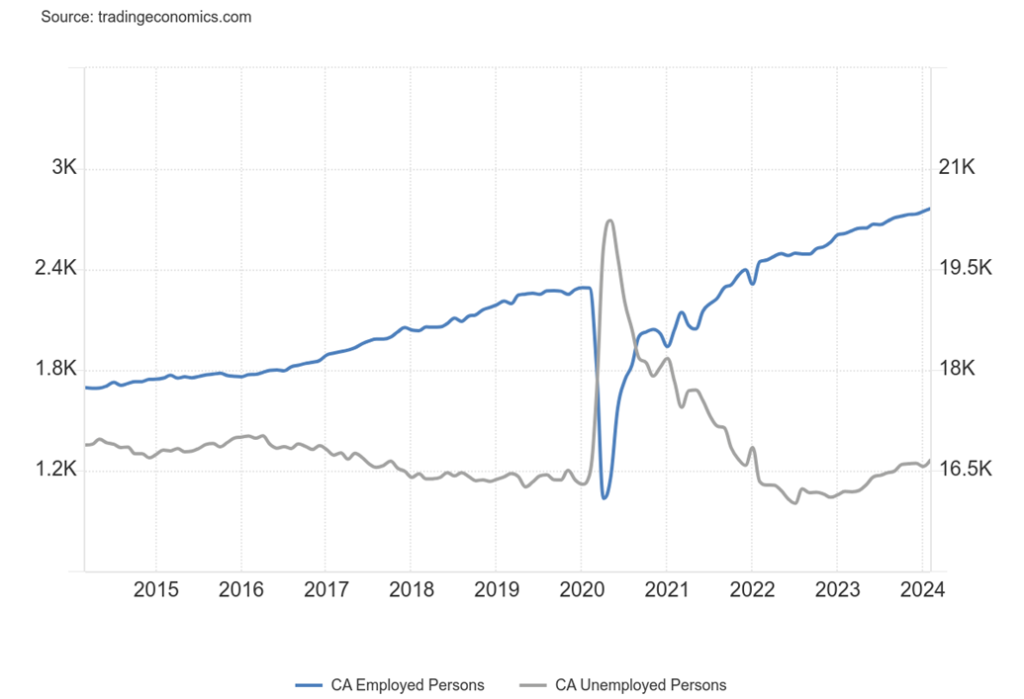
Canada too can’t seem to stop creating jobs. Canada added 40,700 jobs in February, exceeding expectations of adding only 18,000 and against the January gain of 37,300. On a comparison basis with the U.S., Canada is actually doing better. And Canada gets all its numbers from one source only: Statistics Canada (www.statcan.gc.ca). But, like the U.S., there are mixed numbers. The employment rate fell by 0.1% while the population level rose by 0.2%. More people, but fewer working percentage-wise despite the gain in jobs. Of the job gains, 70,600 were full-time while part-time fell by 29,900. And the number of people unemployed actually rose by 35,800. Talk about a mixed report.
The unemployment rate rose to 5.8% from 5.7%, but that was below the expected 5.9%. The R8 unemployment rate, which adds in discouraged job seekers and a portion of involuntary part-timers, was unchanged at 8.4%. The R8 unemployment is the highest unemployment rate reported by Statistics Canada.
Canada’s methodologies differ from the U.S. as Canada’s numbers are usually consistently higher than those in the U.S.
Like the U.S., wage growth moderated as average hourly earnings y-o-y came in at 4.9% vs. the expected 5.3% and January’s rise of 5.3%. The labour force participation rate was 65.3% unchanged from January. With a higher labour force participation rate, it means more people are employed and are participating in the economy percentage-wise than in the U.S. That also gets reflected in a higher unemployment rate as proportionally the pool is larger.
This leaves Tiff Macklem and the BofC in a quandary. The stronger job numbers with full-time gains means the odds of a rate cut even into June have diminished. Of course, some may depend on what the Fed does. As was expected the BofC left the bank rate unchanged at its March meeting this pasts week. The TSX rose to new highs, but it remains shy of all-time highs. Gold in Cdn$ is at an all-time high.
Markets & Trends
| % Gains (Losses) Trends | ||||||||
| Close Dec 31/23 | Close Mar 8, 2024 | Week | YTD | Daily (Short Term) | Weekly (Intermediate) | Monthly (Long Term) | ||
| Stock Market Indices | ||||||||
| S&P 500 | 4,769.83 | 5,123.69 (new highs)* | (0.3)% | 7.4% | up | up | up | |
| Dow Jones Industrials | 37,689.54 | 38,722.69 | (0.9)% | 2.7% | up | up | up | |
| Dow Jones Transport | 15,898.85 | 15,718.22 | (0.7)% | (1.1)% | neutral | up (weak) | up | |
| NASDAQ | 15,011.35 | 16,085.11 (new highs)* | (1.2)% | 7.2% | up | up | up | |
| S&P/TSX Composite | 20,958.54 | 21,737.53 (new highs) | 0.9% | 3.7% | up | up | up | |
| S&P/TSX Venture (CDNX) | 552.90 | 574.75 | 0.6% | 4.0% | up | neutral | down | |
| S&P 600 (small) | 1,318.26 | 1,310.75 | flat | (0.6)% | up | up | up | |
| MSCI World | 2,260.96 | 2,359.62 (new highs) | 1.8% | 4.4% | up | up | up | |
| Bitcoin | 41,987.29 | 68,856.77 (new highs)* | 5.5% | 64.0% | up | up | up | |
| Gold Mining Stock Indices | ||||||||
| Gold Bugs Index (HUI) | 243.31 | 228.66 | 8.5% | (6.0)% | up | neutral | down | |
| TSX Gold Index (TGD) | 284.56 | 272.44 | 7.5% | (4.3)% | up | down (weak) | down | |
| % | ||||||||
| U.S. 10-Year Treasury Bond yield | 3.87% | 4.08% | (3.1% | 5.4% | ||||
| Cdn. 10-Year Bond CGB yield | 3.11% | 3.33% | (2.9)% | 7.1% | ||||
| Recession Watch Spreads | ||||||||
| U.S. 2-year 10-year Treasury spread | (0.38)% | (0.40)% | (14.3)% | (5.3)% | ||||
| Cdn 2-year 10-year CGB spread | (0.78)% | (0.76)% | (15.2)% | 2.6% | ||||
| Currencies | ||||||||
| US$ Index | 101.03 | 102.75 | (1.1)% | 1.7% | down | neutral | neutral | |
| Canadian $ | 75.60 | 74.17 | 0.5% | (1.9)% | neutral | neutral | down | |
| Euro | 110.36 | 109.38 | 0.9% | (0.9)% | up | up (weak) | neutral | |
| Swiss Franc | 118.84 | 113.97 | 0.6% | (4.1)% | down (weak) | up | up | |
| British Pound | 127.31 | 128.56 | 1.6% | 1.0% | up | up | neutral | |
| Japanese Yen | 70.91 | 68.00 | 2.1% | (4.1)% | up | up | down | |
| Precious Metals | ||||||||
| Gold | 2,071.80 | 2,185.50 (new highs) * | 4.3% | 5.5% | up | up | up | |
| Silver | 24.09 | 24.55 | 5.1% | 1.9% | up | up | neutral | |
| Platinum | 1,023.20 | 914.80 | 3.0% | (10.6)% | up | down (weak) | down | |
| Base Metals | ||||||||
| Palladium | 1,140.20 | 1,025.30 | 6.5% | (10.1)% | up | down | down | |
| Copper | 3.89 | 3.89 | 0.8% | flat | up | up | down (weak) | |
| Energy | ||||||||
| WTI Oil | 71.70 | 78.01 | (2.5)% | 8.7% | up | neutral | neutral | |
| Nat Gas | 2.56 | 1.80 | (2.2)% | (29.7)% | down | down | down | |
New highs/lows refer to new 52-week highs/lows and, in some cases, all-time highs.
- * New All-Time Highs

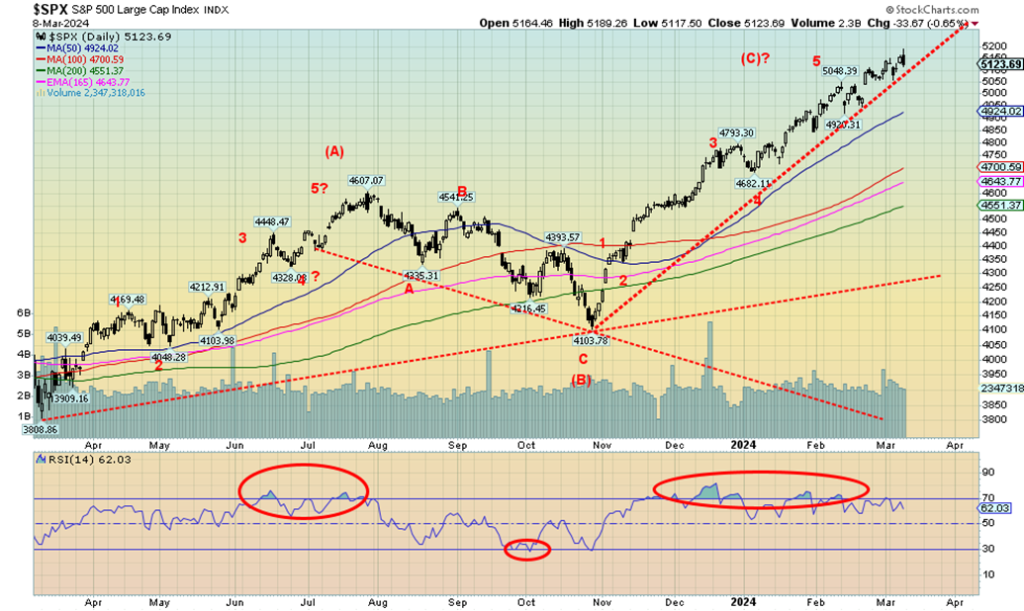
We love front covers like that of The Economist for the March 2nd–8th edition. They often signal a top. Even The Globe and Mail got into the act with a story in the March 9, 2024 ROB edition, titled “What’s driving the bull market? Nearly everything.”No, it doesn’t mean that the top is actually in, but it is usually at tops that we get stories like this. At bottoms we get gloom and doom stories. However, who knows? Maybe we are making a top. After all, for the past month or so we’ve been calling for a final top to occur, possibly in March. And this Friday we saw signs as the S&P 500 (SPX) soared to new all-time highs, then reversed and closed below the low of the previous day, making what may be a key reversal day. Naturally, we’ve seen these reversals before and every one of them was eventually taken out. So, it’s wait and see.
Making new all-time highs along with the SPX and NASDAQ (barely) was the Value Line (VLE), NYSE Composite, NASDAQ 100, S&P 100 (OEX), S&P 400 (Mid), Wilshire 5000, Russell 1000, and Russell 3000. Notably, the NY FANG Index and the Dow Jones Industrials (DJI) did not. A divergence?
This divergence continues with the Dow Jones Transportations (DJT), which is nowhere near its all-time high. Dow Theory says the indices must confirm each other. The DJT hasn’t been anywhere near the DJI in months. Maybe the theory doesn’t work anymore, as some suggest. Well, it doesn’t work until it does.
On the week, the SPX fell 0.3%, the DJI fell 0.9%, the DJT dropped 0.7%, and the NASDAQ lost 1.2%. The S&P 400 was up 1.4%, diverging with the rest while the S&P 600 (Small) was flat. In Canada, the TSX Composite was up 0.9% while the TSX Venture Exchange (CDNX) gained 0.6%. In the EU, the London FTSE was flat, the EuroNext 100 gained 1.3% to new all-time highs, the Paris CAC 40 was up 1.2%, and the German DAX gained 0.5%, both also to new all-time highs.
In Asia, China’s Shanghai Index (SSEC) was up 0.6%, the Tokyo Nikkei Dow (TKN) also made new all-time highs again (barely after 34 years) but fell 0.7%. Hong Kong’s Hang Seng (HSI) fell 0.3% while the MSCI World Index made new 52-week highs, up 1.8%. Seems things were better overseas. Oh yes, and as we note Bitcoin soared to new all-time highs at $70,000, gaining 5.5%, and is up a big 64.0% in 2024, far and away the winner this year.
We can’t tell whether a high is in. We won’t know that until the SPX falls under 5,050 and it really won’t confirm a high until we are under 4,900. As we noted, we’ve seen these reversals before and in no time, we are making new highs once again. Such is the bull market of 2023–2024. Up, up, and away. Until it isn’t.
Bitcoin
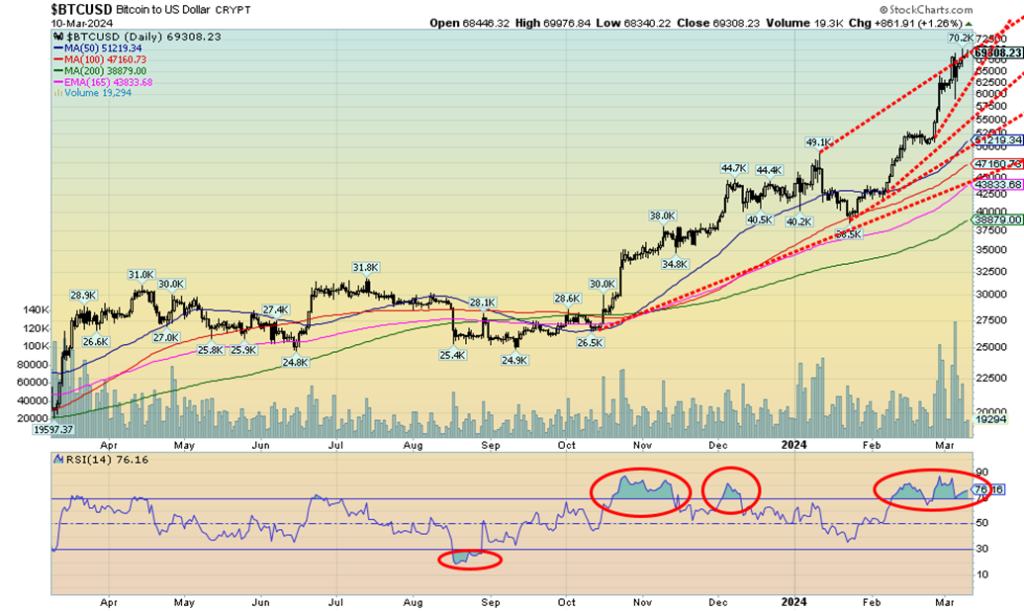
Bitcoin soared to new all-time highs this past week, hitting over $70,000. On March 5 Bitcoin made the high on sharply increased volume, then suddenly reversed, falling over 12% from the high of the day, then closing below the low of the previous day. A huge outside key reversal day? Bitcoin closed almost 7% lower than the previous day. So, is that it? The top is in? Well, just after that, Bitcoin recovered and then went to new highs again. So, the jury is out on the key reversal day.
Bitcoin, by many measurements, is grossly overbought on a daily, weekly, and monthly basis. No, that doesn’t mean that Bitcoin is about to collapse, but it does suggest that buying up here might not work out. It seems strange to the gold bugs that a virtual currency such as Bitcoin is performing better than a hard currency like gold. Nonetheless, the patterns appear positive for gold while the patterns appear negative for Bitcoin. That could be an ascending wedge triangle forming. If that’s correct, then a breakdown under 55,000 could prove to be very dangerous. A breakdown under 45,000 could suggest that the rally is over and a top is in. Still, if Bitcoin were to regain and take out $88,000, we could go higher. But, given the key reversal day and overbought conditions, we wouldn’t place too many bets on it.
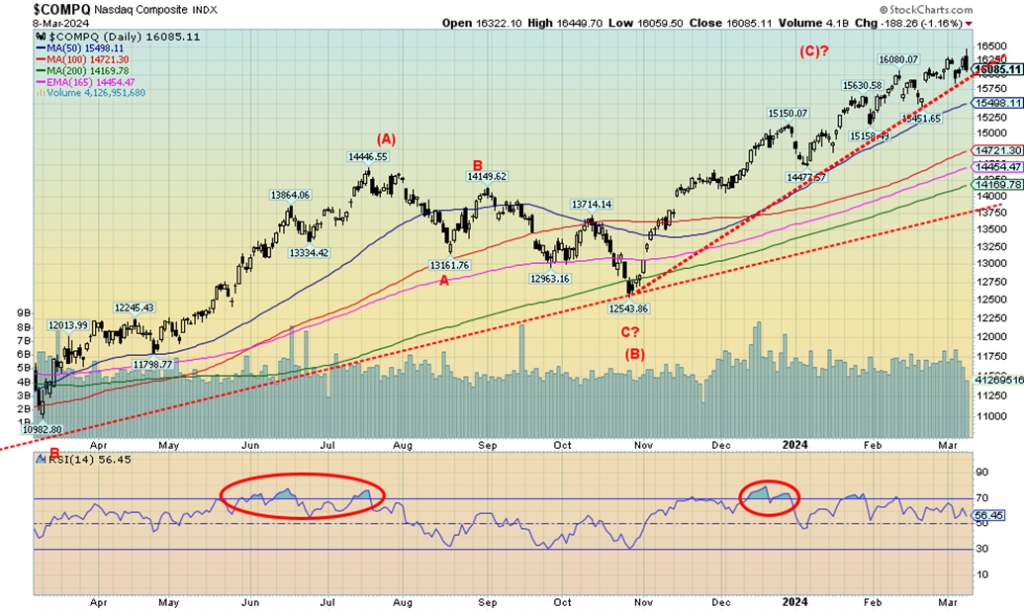
The NASDAQ joined the all-time highs parade this past week, but barely. With a high of 16,450 it barely exceeded the 2022 high of 16,212. However, after making that high, the NASDAQ turned down and closed the week lower at 16,085 for a loss of 1.2%. A reversal? It wasn’t quite a key reversal; while we took out the low of the previous week, we did not close below the low of the previous week. Still, it was a reversal.
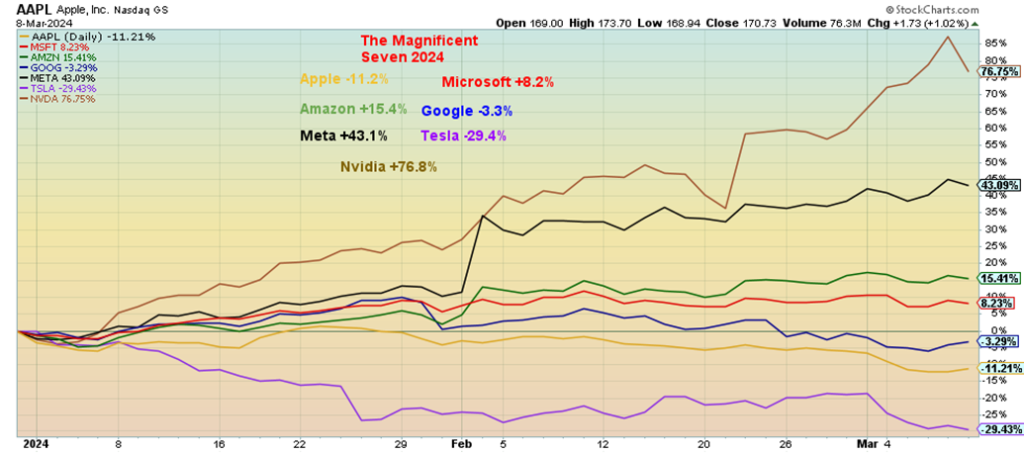
The NASDAQ wasn’t helped by the FAANGs as the NY FANG Index fell 2.8% and did not make new all-time highs. But some FAANGs did, notably Meta (again), Amazon, Nvidia, Advanced Micro (AMD), and Broadcom. Netflix made 52-week highs but is still short of all-time highs. However, Amazon and Broadcom both turned negative and closed lower on the week. Nvidia was the big winner, once again up 6.4%. But there were big losers too. Apple is falling losing 5.0% this past week. Tesla’s star has fallen, losing 13.5% this past week.
Snowflake is also a loser, down 13.0% on the week and over 18% on the year. Tesla is the big loser, down 29% this year while Apple is now down 11.3%. Jeff Bezos has briefly surpassed Elon Musk as the U.S.’s richest man. Elon Musk is falling rapidly, actually. Even the vaunted Google is down over 3% this year. But Nvidia, up 76.8%, and Meta, up 42.9% in 2024, are the big stars. If they fall, then the famous FAANG rally or the Magnificent Seven (and falling) rally is truly over. It’ll be one for the history books, à la 1929, 1972, and 1999. All ended in tears, and not tears of joy. This time is not different.
Magnificent Seven Performance 2024
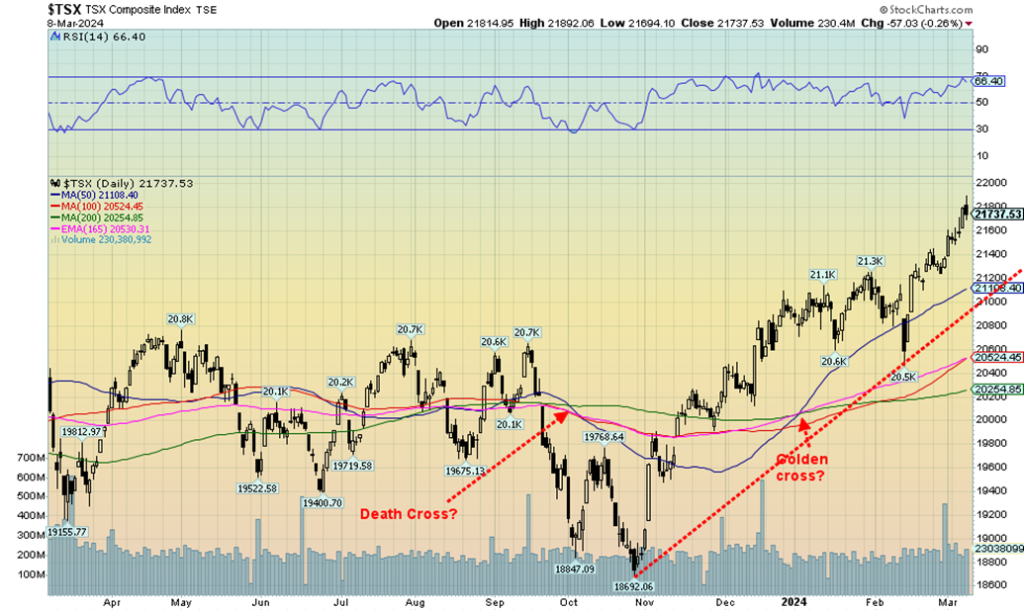
The TSX Composite remains short of its all-time high, but did see fresh 52-week highs. That was made on Friday, following Canada’s robust job numbers. But then the TSX followed the U.S. markets and reversed, closing lower. Not quite the reversals the U.S. markets saw but a reversal, nonetheless. We weren’t even overbought, falling short of seeing the RSI climb over 70. So, this may be temporary, or not. We have some room to pull back and only below 21,000 might we believe that top could be in.
Of the 14 sub-indices, 10 were higher while four were lower. Leading the lower was Health Care (THC) off 3.9% while Telecommunications (TTS) fell 1.8%. The up leader was Golds (TGD), gaining 7.5% followed by Materials (TMT), up 5.1%, and Metals & Mining (TGM) and Utilities (TUT) gaining 2.8%. TUT looks like a sector as it is one you can hide in during a general market pullback. We’ve noted further the strength being exhibited by golds, miners, and materials. Financials (TFS) hit new 52-week highs and gained 1.0%.
Consumer Discretionary (TCD) and Industrials (TIN) made new all-time highs, even as TCD was flat while TIN gained 0.7%. The TSX has gained 16% since that October 2023 low and everything looks positive going forward. But the U.S. market remains key even as our best sectors remain golds, metals, materials, and energy.
U.S. 10-year Treasury Bond/Canadian 10-year Government Bond (CGB)
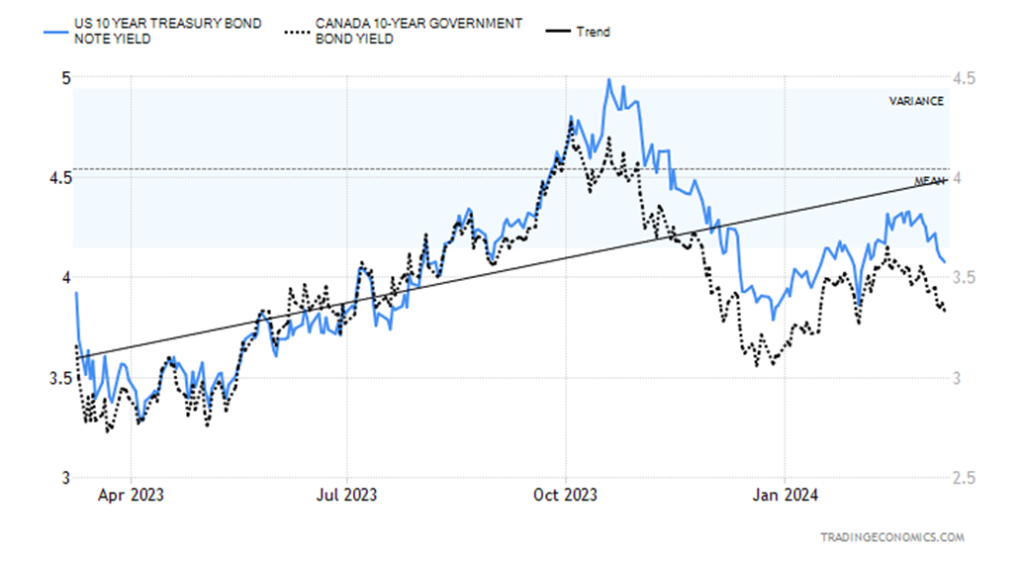
Despite the stronger than expected nonfarm payrolls this past week, the bond market seemed to focus on the other numbers which were, as we noted, showing signs of economic weakness not strength. Both the U.S. 10-year treasury note and Canada’s 10-year Government of Canada bond (CGB) fell this past week to 4.08% and 3.33% respectively, declines of 3.1% and 2.9%. But the 2–10 spreads widened, suggesting that while a recession is still coming it is not imminent. The U.S. 2–10 spread rose to 40 bp from 35 bp while Canada’s 2–10 spread widened to 76 bp from 66 bp.
Economic numbers continued to be okay. The S&P Global PMI was 52.5 and the Services PMI 52.3, but the same indicators in Canada were weak at 47.1 and 46.6 respectively. Canada is showing recession while the U.S. is still robust. The Bank of Canada (BofC) left interest rates unchanged as was widely expected. Still no sign of a rate cut and that weakened after Canada reported robust job numbers on Friday. JOLTS job numbers were weaker for openings and higher for quits but not at any level of concern.
Canada had an unexpected positive balance of trade for January of $0.5 billion while the U.S. was weaker at minus $67.4 billion. Canada’s positive balance of trade contributes to a positive GDP. Used car prices in the U.S. weakened more than expected as demand softens. This coming week we get the inflation numbers for the U.S. CPI and PPI. They are both expected to show further easing of inflation. Retail sales for February are also out and are expected to show weakness. All that might keep the Fed focused on June for a rate cut which is still widely expected.
Bond yields are down and a break under 4% in the U.S. could signal further declines, whereas Canada appears to be headed towards 3%. We note that the 2-year notes and bonds also weakened this past week but not as much as the 10-year. Of the two, Canada appears closer to a recession. With the EU and Japan showing weak, even negative, growth and China weakening, Canada and the U.S. falling into recession wouldn’t be a surprise. But many believe the Goldilocks economy is here and growth can continue, albeit at a lower rate.
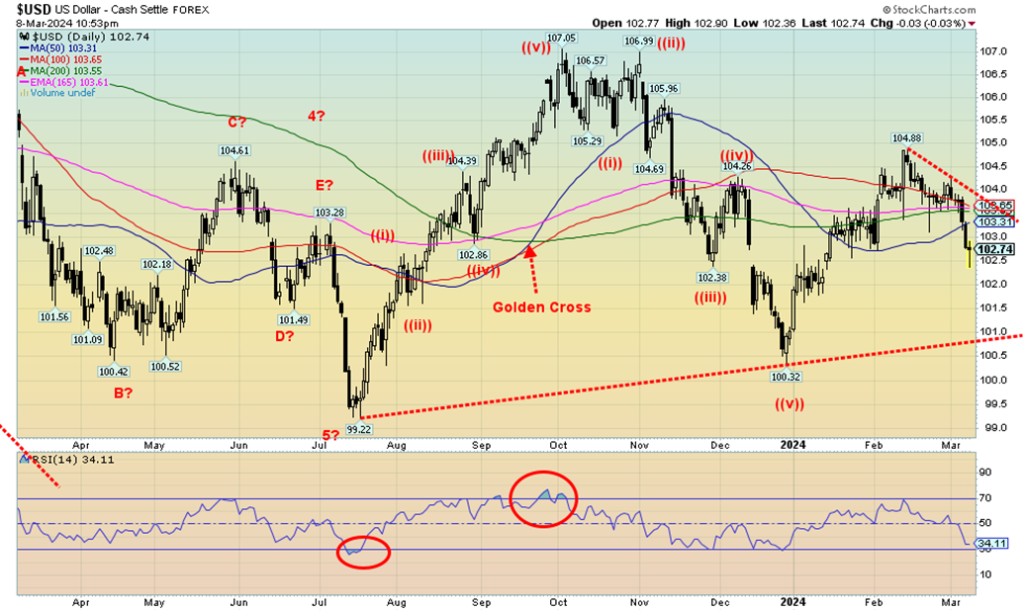
The US$ Index broke down this past week, closing below key MAs. A weak US$ Index was one of the prime reasons for gold’s rise this past week. The US$ Index fell 1.1% as the euro rose 0.9%, the Swiss franc was up 0.6%, the pound sterling gained 1.6%, and the Japanese yen jumped 2.1%, thanks to the BOJ hinting at the end of negative interest rates.
The Cdn$ rose 0.5%. It appears to us that the US$ Index’s recent rise is over with the top at 104.88 and the subsequent breakdown under 103. Friday saw the US$ Index bounce back after initially plunging, so there might be some backing and filling this coming week. We are fast approaching oversold. But that trend line, currently down near 101, looks tempting. Only above 104 do we believe that low could be in. However, we are not expecting that to happen. Resistance is at 103, then up to 104.
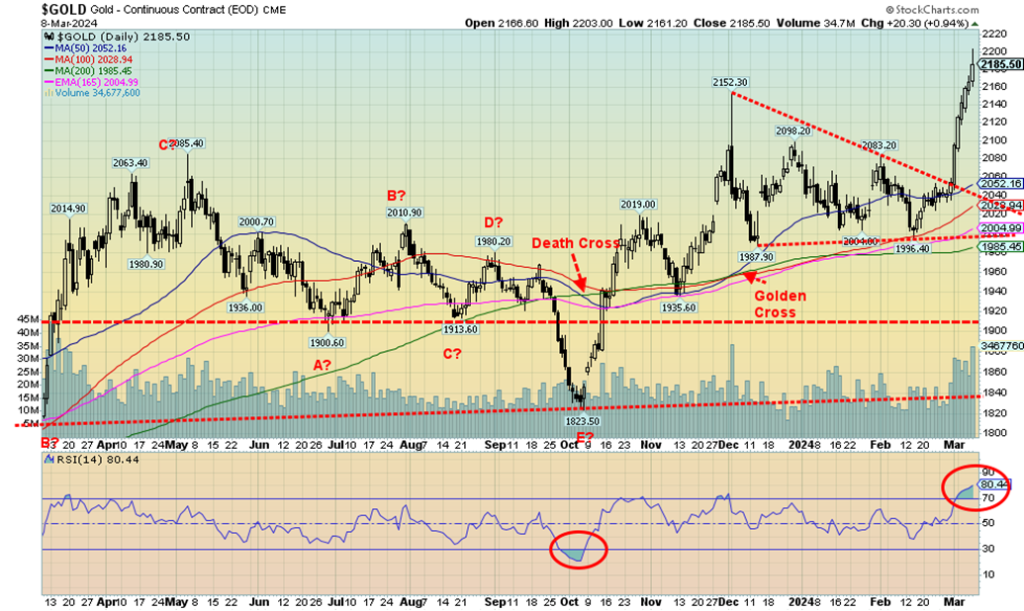
Gold joined the all-time high crowd this week when it burst to a high of $2,203 before settling back to close at $2,185. Yes, $2,200. The gold bugs must have been dancing in the street. Maybe best said by Peter Spina, President and CEO of Gold Seek (www.goldseek.com), who noted when gold was languishing and the gold stocks were sinking, he received all sorts of hate mail and insulting messages.
We know the feeling. One of the best was that gold bugs have been blinded by the belief that the future is AI and crypto, not gold. Martin Armstrong of Armstrong Economics says that the gold bugs get slaughtered with their unwavering support for gold. There is a time to own it, and there is a time not to own it. The time to own it may be about to occur. Even Armstrong is getting friendly towards gold, but he is not a raging bull and warns that a short-term top could be nigh.
Since the major top in 2011 followed by the devastating wipeout in 2013, gold bugs have had little to cheer about. There was a nice little run-up in 2016 before settling back and then there was an even better run from 2018 to 2020, interrupted by the COVID pandemic in March 2020. Gold soared 79% during that run.
Silver hit new lows during the COVID collapse, then leaped 160% into February 2021 while the Gold Bugs Index (HUI) rose 185% during 2018–2020 and the TSX Gold Index (TGD) was up 183% in the same period. The much-maligned junior gold mining market also had a nice run as the TSX Venture Exchange (CDNX) rose 236% from March 2020 to a peak in February 2021. Alas, after that they all sunk again, sending the gold bugs into despair.
Yes, the CDNX fell 54%, the HUI also fell 54%, the TGD dropped 48%, silver fell 43% and gold, the best performer, was down only 23%. While gold has now surpassed its all-time highs, silver is still down over 50% from its all-time high, the HUI is down 64%, and the TGD is down just over 40% from its respective all-time highs seen in 2011. Yet, gold itself has been the best performer of the century so far (not counting Bitcoin), outpacing the stock market. It’s now been a good three years since those last highs in 2021. So maybe the sector is overdue.
This past week gold rose 4.3%, silver was up 5.1%, palladium gained 3.0%, and the near precious metals also saw gains as palladium rose 6.5% and copper was up 0.8%. The HUI rose 8.5% and the TGD gained 7.5%. All in all, a good week.
But the sector needs to follow through. The catalyst was signs of the economy slowing, a potential Fed pivot, geopolitical uncertainty, domestic political uncertainty, and maybe a desire to hold a hard asset rather than a virtual one. Funds that had been flowing out of gold ETFs flowed back in. Gold set aside the stronger than expected nonfarm payrolls and, instead, focused on things like weak wage gains and some perception that inflation was easing. Gold is the ultimate safe haven asset. Now, if only silver and the gold stocks would recognize that.
With $2,200 now in sight, the next stop above that level could be $2,300, which is our minimum target. And it could also mean a temporary top anywhere from $2,250 to $2,300. If $2,300 were exceeded, then the next target could be $2,500. But let’s not get ahead of ourselves. Clearly now, $2,100 is major support and below that $2,000. If $2,000 ever fell, it’s all over and another wipe-out is on the way. For the short term, gold is somewhat overbought so a pullback wouldn’t surprise.
But the weeklies and monthlies still have room to move higher, even if the dailies wobble. This could be the big move and perfect storm the gold bugs have long dreamed about. But the fear is that the gold bugs, as usual, get ahead of themselves and then get slaughtered. The conditions are perfect with a trapped Fed, record debt, political divisions everywhere, war, and the potential for more devastation from climate change. But, as we rise towards $2,300, beware of a temporary top.
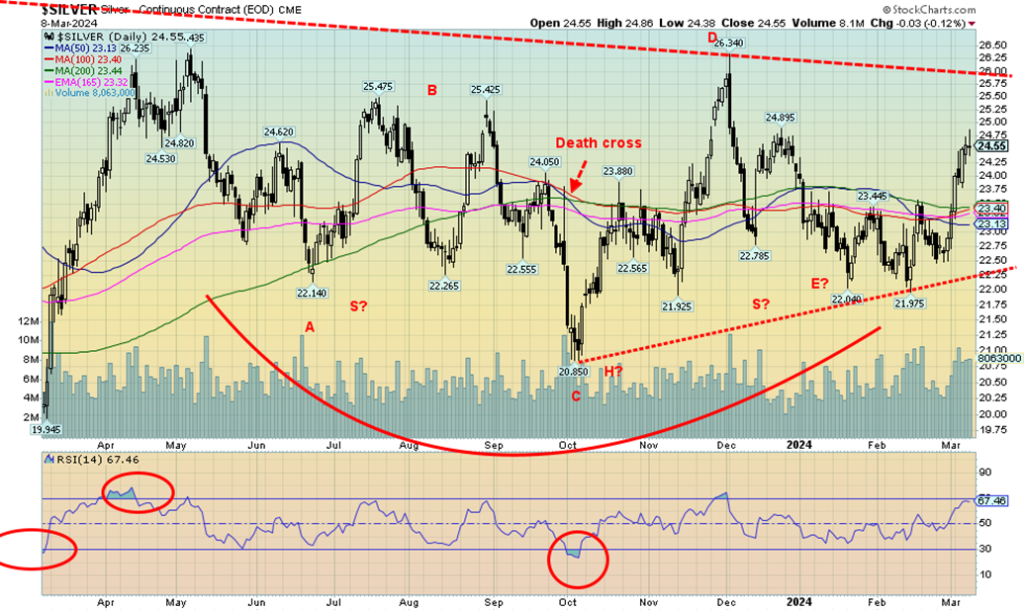
Silver had a good move this past week, outpacing even record-breaking gold. But, alas, while gold is setting new records, silver isn’t even close. That’s a very distant almost $50. Instead, we’re half that at $24.55. Still, silver gained 5.1% this past week, outpacing gold’s 4.3%. Despite the gain, a big breakout above $26 still seems far away, although with another week like this past one, we could soon break it down. Above $26 silver still has resistance up to $27.50/$28.00.
Silver tends to ride high when it’s going up as we saw last October to December with a move from $20.85 to $26.34, but then it equally takes it on the chin when it falls from $26.34 to $21.98. Silver, it seems, is either loved or hated with little in-between. So right now, it’s loved, or at least it looks like a love-in is underway. We’ll save our joy until we break above $26, but that is merely a start. After that we need to break over the high of the past decade at $30.35. That high occurred in February 2021 and we’ve come nowhere near it since.
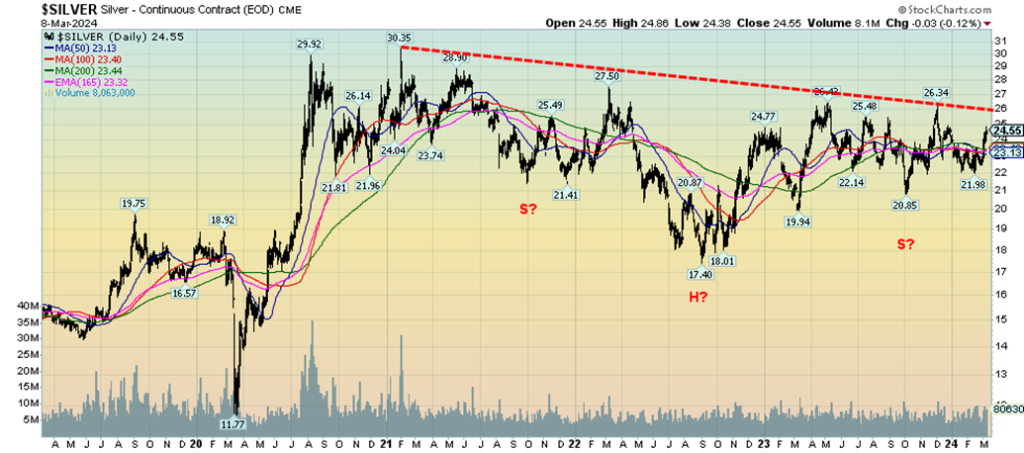
We decided to stretch out the chart (next page) to see what silver looked like over the past five years. And the first thing that caught our attention was the look of a potential head and shoulders reversal being formed. That’s bullish. The breakout is, of course, above $26 and the pattern has potential to see silver rise to at least $39. That would please the silver bulls, but a rise once again to $50 would be even better. In the interim, we wouldn’t want to see silver fall back under $23 and especially under $22.50. The pattern is encouraging.
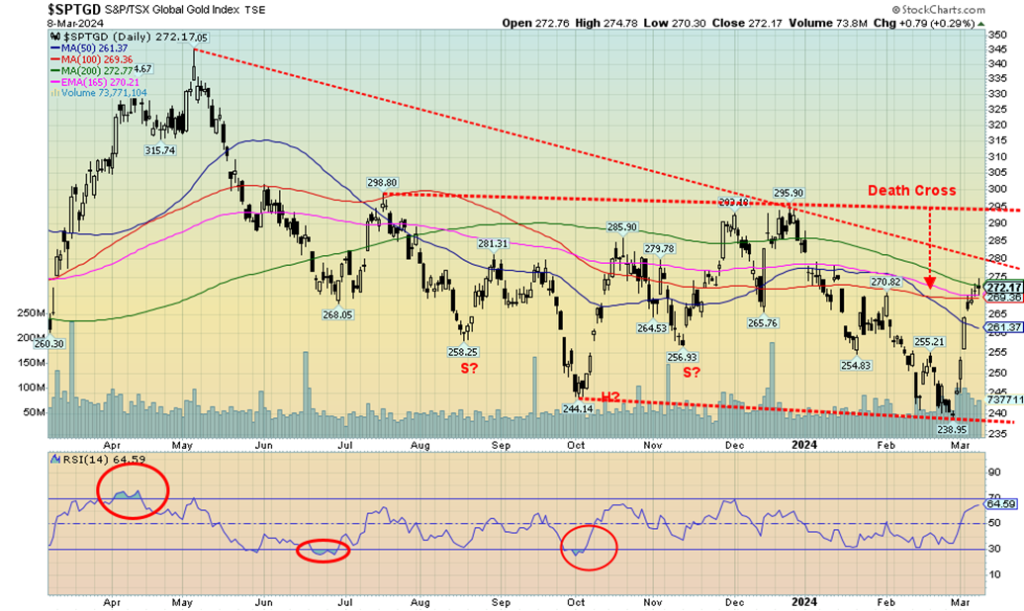
Despite a nice move off the lows with a gain so far of almost 14%, gold stocks still get no respect. The big star of the week was Bitcoin ETFs. Yes, the TSX Gold index (TGD) had a good week, up 7.5%, while the Gold Bugs Index (HUI) was even better, up 8.5%. The gold stocks remain below key breakout levels. For the TGD that is first above 280, then above 295/300. If we can successfully break above 295/300, then targets could be up to 355. Gold stocks, as we know, can be streaky both up and down. It’s such a small market that it doesn’t take much to move them one way or the other.
Junior mining stocks are another story, but even here we saw some jumps this past week. But largely it’s a market that everyone ignores or worse, dumps on, until they don’t any longer—then it’s like pushing a mountain through a garden hose. A sharp rise this past week, but surprisingly we are not really overbought yet. And even if we do become overbought, the condition can hang around, at least for a short period. We’d only get concerned if we were to fall back under 260, but overall, the move, despite being straight up, looks good against the backdrop of gold making all-time highs. The Gold Miners Bullish Percent Index (BPGDM) is still only at 28.6, off the low of 17.8 but nowhere near nosebleed territory above 75. The sector is a buy.
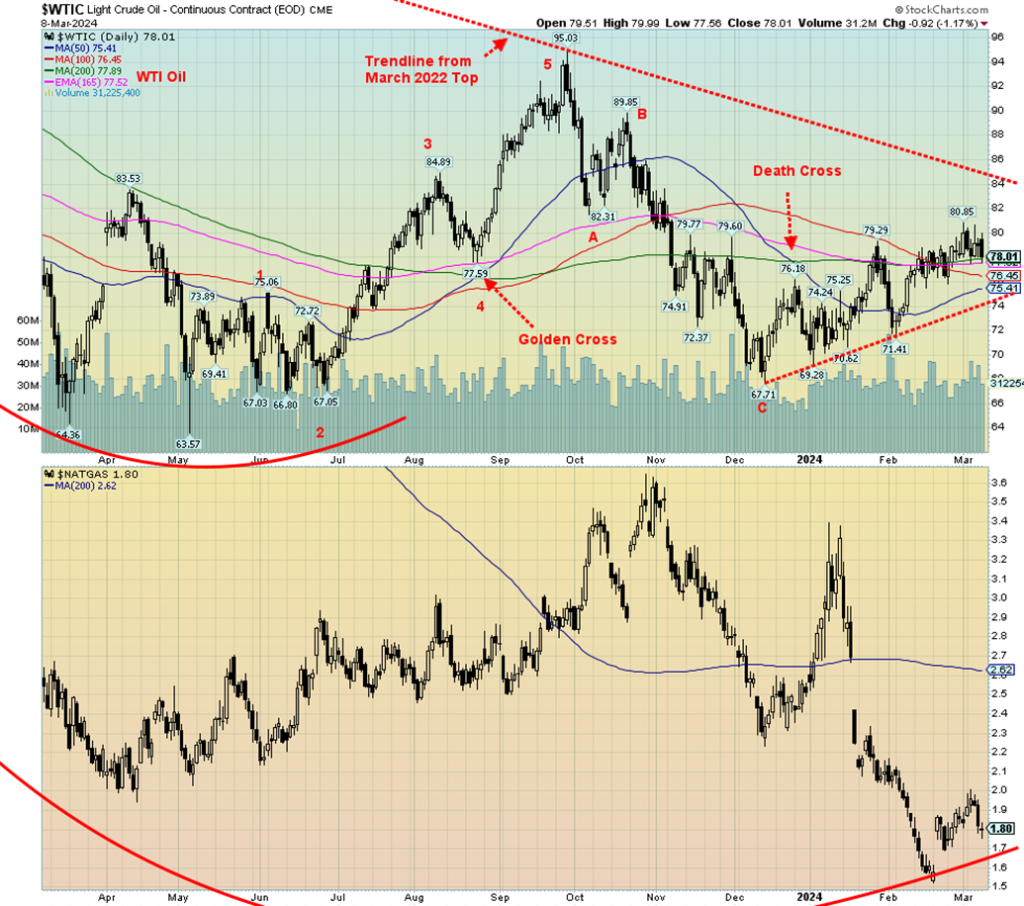
WTI oil prices flatlined this week, despite some increase in Chinese and Indian demand and continued extension of cuts from OPEC. Breaking out over $80 remains elusive. WTI oil fell 2.5% this past week while Brent crude was off 2.0%. Natural gas (NG) continued its woes, losing 2.2%, but NG at the Dutch EU hub rose 5.8% despite ample supplies in storage, subdued demand, and warm temperatures. Oil stocks were mixed. The ARCA Oil & Gas Index (XOI) managed to make all-time highs, gaining 0.9%, but Canada’s TSX Energy Index (TEN) fell 1.0%.
The good news for WTI oil is it is continuing to hold above key MAs. The bad news is it is not getting any liftoff, despite risks in the Middle East that could send oil prices soaring. NG is possibly making a bottom as we’ve had no new lows despite the recent pullback. NG may need more work here and the risk of new lows has not abated. But with energy stocks showing some life, the expectation might be that prices may lift off soon. A firm break over $80 would start things and a move over $84 would seal the deal. We’re not that far away. A breakdown under $75, however, would be negative.
__
(Featured image by Jason Hafso via Unsplash)
DISCLAIMER: This article was written by a third party contributor and does not reflect the opinion of Born2Invest, its management, staff or its associates. Please review our disclaimer for more information.
This article may include forward-looking statements. These forward-looking statements generally are identified by the words “believe,” “project,” “estimate,” “become,” “plan,” “will,” and similar expressions. These forward-looking statements involve known and unknown risks as well as uncertainties, including those discussed in the following cautionary statements and elsewhere in this article and on this site. Although the Company may believe that its expectations are based on reasonable assumptions, the actual results that the Company may achieve may differ materially from any forward-looking statements, which reflect the opinions of the management of the Company only as of the date hereof. Additionally, please make sure to read these important disclosures.
Copyright David Chapman 2024
David Chapman is not a registered advisory service and is not an exempt market dealer (EMD) nor a licensed financial advisor. He does not and cannot give individualised market advice. David Chapman has worked in the financial industry for over 40 years including large financial corporations, banks, and investment dealers. The information in this newsletter is intended only for informational and educational purposes. It should not be construed as an offer, a solicitation of an offer or sale of any security. Every effort is made to provide accurate and complete information. However, we cannot guarantee that there will be no errors. We make no claims, promises or guarantees about the accuracy, completeness, or adequacy of the contents of this commentary and expressly disclaim liability for errors and omissions in the contents of this commentary. David Chapman will always use his best efforts to ensure the accuracy and timeliness of all information. The reader assumes all risk when trading in securities and David Chapman advises consulting a licensed professional financial advisor or portfolio manager such as Enriched Investing Incorporated before proceeding with any trade or idea presented in this newsletter. David Chapman may own shares in companies mentioned in this newsletter. Before making an investment, prospective investors should review each security’s offering documents which summarize the objectives, fees, expenses and associated risks. David Chapman shares his ideas and opinions for informational and educational purposes only and expects the reader to perform due diligence before considering a position in any security. That includes consulting with your own licensed professional financial advisor such as Enriched Investing Incorporated. Performance is not guaranteed, values change frequently, and past performance may not be repeated.


Ali G Makes Surprise Wimbledon Appearance with Cannabis-Themed Satire
Sacha Baron Cohen revived his iconic Ali G character at Wimbledon’s men’s final, blending satire with British high society. Dressed...


Medelon Shooting Club Restores Hall After Successful Crowdfunding Campaign
The St. Engelbertus Shooting Club in Medelon raised €10,260 through crowdfunding to renovate its shooting hall after unexpected dry rot...


Biotech Revival: Big Pharma Bets on Innovation and Acquisitions
After a downturn, biotechnology is regaining attention as major pharmaceutical companies invest heavily in innovative platforms to offset patent losses...


PAASIFEJ: Results-Based Financing Driving Inclusive and Sustainable Rural Growth in Morocco
Morocco’s PAASIFEJ program, funded with 2.4 billion dirhams, supports smallholder farmers, women entrepreneurs, and youth across seven regions while promoting...


Ecobnb Turns Sustainable Tourism Into Measurable Impact
Ecobnb’s sustainable tourism platform generated significant environmental and social impact in 2025, avoiding 58,207 kg of CO₂ and adding 583...
 |
|
 |  |
 |
|
-

 Crowdfunding2 weeks ago
East Crema Coffee Launches €3.5M Crowdfunding Campaign
-

 Markets2 days ago
Sugar Markets Balance Biofuel Demand and Global Supply
-

 Africa1 week ago
Morocco Cuts Card Fees to Spur Digital Payments, but Uncertainty Remains
-

 Cannabis7 days ago
Virginia Cannabis Market Could Reshape Regional Competition