Markets
Why a Financial Black Swan on the Stock Market Remains a Possibility
The stock markets are still spiking, and the way things are going continues to give some credence to a potential top into March. At the other end gold, as noted, appears poised for a breakdown washout that should be swift as the background remains very compelling for owning the metal. Massive amounts of debt are due in 2024 and the question is who is going to buy it all.

The records keep on falling on the stock market. Thank you, Nvidia, as the S&P 500 (SPX) soars to new highs again. But so did the other suspects like the Dow Jones Industrials (DJI), NY FANG Index, the S&P 100 (OEX), the Wilshire 5000, and the Russell 1000 and 3000. But the divergences are growing and the Dow Jones Transportations (DJT) is still nowhere near its former high.
Microsoft is now the largest company in the world supplanting Apple who falls to number 2. With a market cap over $3 trillion MSFT is almost as big as France the world’s 7th largest economy. Nvidia is now the 4th largest company with a market cap of almost $2 trillion. Canada with a GDP of $2.1 trillion is the world’s 10th largest economy. Yes, NVDA almost as big as Canada.
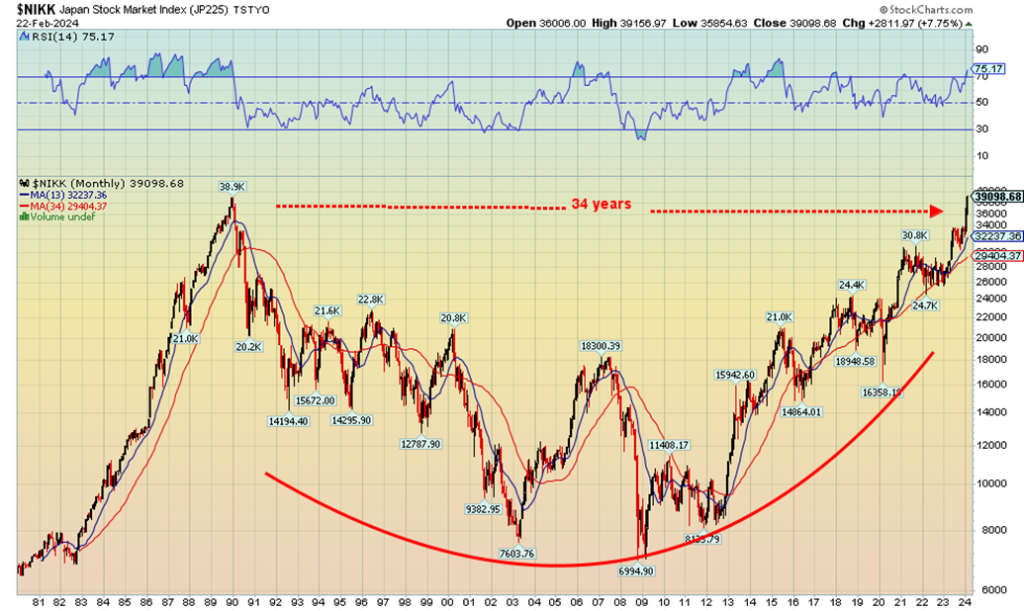
Guess who else just made all-time highs on the stock market? The Tokyo Nikkei Dow (TNK). Yes, it took only 34 years to beat that record high seen at year end in 1989, or was it early 1990. No matter, it made it. Pop the champagne. Except that’s in nominal terms only. In inflation-adjusted terms, even at Japan’s low rate of inflation it still has a way to go.
Japan’s lost decade(s) is over. Or is it really? Our chart looks pretty good and the suspicion here is that the TNK still has room to rise further. That’s a nice uptrend in place since those lows way back in 2008–2012. If you look at the uptrend from 1982 to 1989, it was almost straight up, uninterrupted. Not this time. That’s why we believe the TNK probably has some further upside, although it is starting to spike.
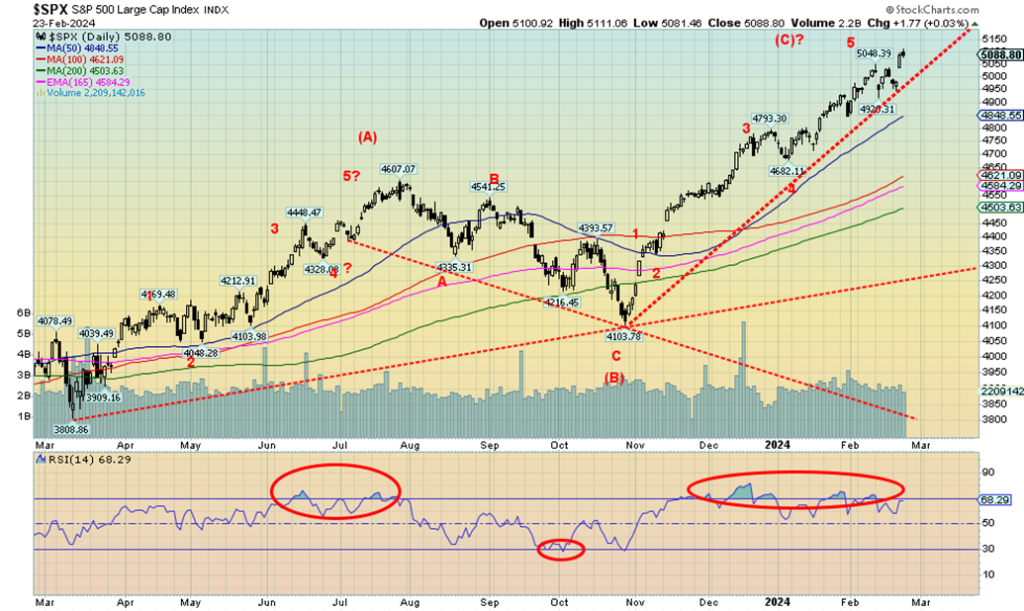
As for the SPX, it most likely has a bit further to go. But the stock market is getting frothy. And that’s all they talk about on CNBC. The Ais. Back in 1999-2000 all they talked about was the dotcoms. It fits well with our thoughts that our top could be in March. The Magnificent Seven—or is it Six now—rally fits with the dot.com rally of 1995–2000 that also topped in March 2000. One just has to wonder, though, is Nvidia today’s Cisco? Many think not. Cisco later collapsed 90%. Could that befall Nvidia? Time will tell.
In looking at the chart of SPX, right now it is just going straight up almost without interruption since that low last October. The last time we saw that was from the pandemic low in March 2020 to the high in January 2022. At that time the run-up was fueled by QE4 and ultra-low zero percent interest rates.
These are two conditions that don’t exist this time. Instead, we have 5% interest rates and QT, although we’ve noted before that there appears to be backdoor fueling of the economy to keep things alive. All this is against the backdrop of two wars, although neither of the wars is impacting North America.
The U.S. economy has remained the strongest in the world. With wars on the edge of Europe and the Middle East, economic trouble in China and Japan, and higher interest rates in the U.S. than anywhere else, you have the classic setup for funds flowing out of the regions to the U.S. where the funds appear to be parked in the booming U.S. stock market. That has contributed to the strong U.S. dollar, even as interest rates have remained high.
That the stock market rally has been fueled primarily by the Magnificent Seven (or Six, if one thinks Tesla is faltering—hint: it is) seems to be beside the point. 4,900 and then 4,650/4,700 appear to be the breakdown points, with the latter signaling that the rally is most likely over. Our straightforward calculation as to how high we could go currently has a target up around 5,111. We’re not that far away. If that target should be exceeded, the next one could be up around 5,400.
No matter how we look at it, the stock market is rising and there appears to be little in the way of anything stopping it. Until something out of the blue does; i.e. the proverbial black swan event. A major bankruptcy? An unexpected turn in the wars? Something else? Be prepared. A turn could come at any time. Nothing goes up forever. No, this time is not different.
Speaking of a black swan we’ve learned that the U.S. has almost $10 trillion of debt maturing in 2024. That’s made up of $7.6 trillion public debt (federal, state, municipal) and some $800 billion of corporate debt with another $1 trillion corporate debt due in 2025. How much is BBB and lower? Answer, most of it. The EU has over a trillion euros due and corporate EU debt due is over four trillion maturing through 2025. Who is going to buy all of this debt? Global debt now tops $313 trillion.
Last week the SPX gained 1.7% and the DJI was up 1.3%, both to new all-time highs. The NASDAQ made 52-week highs but remains short of its all-time high, up 1.4%. The DJT is nowhere near its all-time highs but did pop 1.9% this past week. The S&P 400 (Mid) gained 1.1% to new 52-week highs but the S&P 600 (Small) fell, losing 0.7%.
In Canada, the TSX Composite continued its recent upward march, gaining 0.3% to new 52-week highs. Joining the TSX was the TSX 60, and both Consumer Staples (TCS) and Industrials (TIN) made all-time highs. In the EU, the London FTSE fell a small 0.1%, the EuroNext was up 1.4% to new all-time highs, as was the Paris CAC 40, up 2.6%, while the German DAX was up 1.8%.
Seems the EU stock markets are in a bubble rise as well, despite the stalemated war next door. In Asia, China’s Shanghai Index (SSEC) continued its recent recovery, thanks to PBOC cutting rates, up 4.8%. As we noted, the Tokyo Nikkei Dow (TKN) finally took out its all-time high, up 1.9%, and Hong Kong’s Hang Seng (HSI) gained 2.4%.
Over at the other side, gold continues to baffle and confuse. Gold bugs can’t figure out why, but with the background we have, gold is not at record prices. Well, it did make a record high back in December on a spike overnight that by morning had washed away completely. Silver, the gold stocks, platinum? All are so far away from their all-time highs that we have trouble seeing where the old high was.
Silver remains 54% under its all-time high, the Gold Bugs Index (HUI) is 67% away, the TSX Gold Index (TGD) remains down 46%. Platinum is still down 60% from its high way back in 2008. The junior mining dominated TSX Venture Exchange (CDNX) is down 84% from its all-time high back in 2007. Ouch!
Gold gained 1.3% this past week, but silver gave back following its strong up week last week, losing 2.1%. Platinum was off 0.4%, palladium gained 3.8%, and copper was up 1.6%. We consider copper a leader, so watch it. The HUI lost 0.7% and the TGD fell 1.9%. All this against a backdrop of the currencies doing little as the US$ Index fell 0.3% and the euro was up 0.4%.
The rest were just mixed. Speaking of currencies, we keep reading Bitcoin is going to overtake and replace the U.S. dollar (don’t count on it). Bitcoin is within 26% of its all-time high even as it fell 1.1% this past week. But Bitcoin is still a big winner in 2024, up 21.5%.
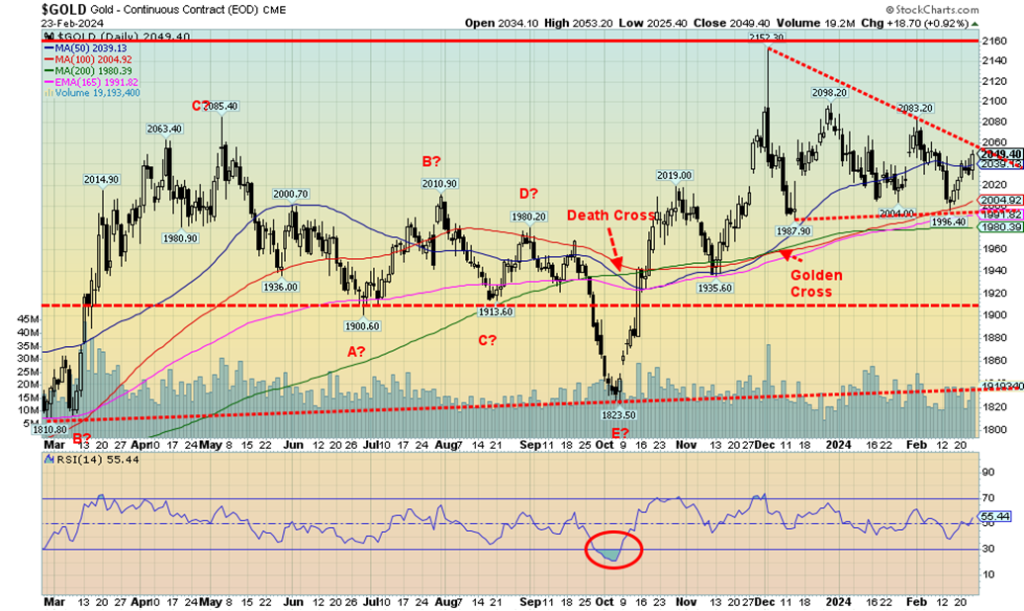
What worries us about gold is the forming what appears to be a descending triangle. Naturally, we don’t want to see that, but if that bottom end near $2,000 falls out, the fall could be a drop to $1,835. The upside breakout is near $2,060 and projects up to $2,225. If the former happens, it should be the last hurrah for a drop but it will shake the market to the bone. Sentiment would fall swiftly and maybe this time the gold bugs will leap out of windows.
Whatever, it would be final shakeout. We’d prefer not to see a drop on teh stock market but recognize we shouldn’t dismiss the potential nasty descending triangle. Once that low is made, a major rally should get underway as the background remains too compelling to ignore gold. And, no Bitcoin is not the same as gold.
“Be prepared” seems to be a motto for both stock markets and gold markets.
Markets & Trends
| % Gains (Losses) Trends | ||||||||
| Close Dec 31/23 | Close Feb 23, 2024 | Week | YTD | Daily (Short Term) | Weekly (Intermediate) | Monthly (Long Term) | ||
| Stock Market Indices | ||||||||
| S&P 500 | 4,769.83 | 5,088.80 (new highs)* | 1.7% | 6.7% | up | up | up | |
| Dow Jones Industrials | 37,689.54 | 30,131.53 (new highs)* | 1.3% | 3.8% | up | up | up | |
| Dow Jones Transport | 15,898.85 | 15,921.02 | 1.9% | 0.1% | up | up | up | |
| NASDAQ | 15,011.35 | 15,996.82 (new highs) | 1.4% | 6.6% | up | up | up | |
| S&P/TSX Composite | 20,958.54 | 21,313.15 (new highs) | 0.3% | 1.7% | up | up | up | |
| S&P/TSX Venture (CDNX) | 552.90 | 548.14 | (1.6)% | (0.9)% | down | down (weak) | down | |
| S&P 600 (small) | 1,318.26 | 1,295.48 | (0.7)% | (1.7)% | up | up | up (weak) | |
| MSCI World | 2,260.96 | 2,294.93 (new highs) | 1.7% | 1.5% | up | up | up (weak) | |
| Bitcoin | 41,987.29 | 51,020.52 (new highs) | (1.1)% | 21.5% | up | up | up | |
| Gold Mining Stock Indices | ||||||||
| Gold Bugs Index (HUI) | 243.31 | 207.96 | (1.4)% | (14.5)% | down | down | down | |
| TSX Gold Index (TGD) | 284.56 | 251.57 | (0.2)% | (11.6)% | down | down | down | |
| % | ||||||||
| U.S. 10-Year Treasury Bond yield | 3.87% | 4.25% | (0.7)% | 9.8% | ||||
| Cdn. 10-Year Bond CGB yield | 3.11% | 3.46% | (3.6)% | 11.6% | ||||
| Recession Watch Spreads | ||||||||
| U.S. 2-year 10-year Treasury spread | (0.38)% | (0.44)% | (23.3)% | (15.8)% | ||||
| Cdn 2-year 10-year CGB spread | (0.78)% | (0.71)% | flat | 9.0% | ||||
| Currencies | ||||||||
| US$ Index | 101.03 | 103.96 | (0.3)% | 2.9% | up | up (weak) | up (weak) | |
| Canadian $ | 75.60 | 74.10 | (0.2)% | (2.0)% | down | neutral | down | |
| Euro | 110.36 | 108.21 | 0.4% | (2.0)% | down | neutral | down (weak) | |
| Swiss Franc | 118.84 | 113.47 | (0.2)% | (4.5)% | down | up | up | |
| British Pound | 127.31 | 126.70 | 0.6% | (0.5)% | down | up (weak) | neutral | |
| Japanese Yen | 70.91 | 66.45 | (0.2)% | (6.3)% | down | down | down | |
| Precious Metals | ||||||||
| Gold | 2,071.80 | 2,024.10 | 1.3% | (1.1)% | neutral | up | up | |
| Silver | 24.09 | 22.98 | (2.1)% | (4.6)% | down (weak) | down | neutral | |
| Platinum | 1,023.20 | 909.60 | (0.4)% | (11.1)% | down | down | down | |
| Base Metals | ||||||||
| Palladium | 1,140.20 | 988.50 | 3.8% | (13.3)% | down | down | down | |
| Copper | 3.89 | 3.90 | 1.6% | 0.3% | up | up | down (weak) | |
| Energy | ||||||||
| WTI Oil | 71.70 | 76.49 | (2.5)% | 6.6% | up | neutral | neutral | |
| Nat Gas | 2.56 | 1.70 (new lows) | 5.6% | (33.6)% | down | down | down | |
__
(Featured image by Nicholas Capello via Unsplash)
DISCLAIMER: This article was written by a third party contributor and does not reflect the opinion of Born2Invest, its management, staff or its associates. Please review our disclaimer for more information.
This article may include forward-looking statements. These forward-looking statements generally are identified by the words “believe,” “project,” “estimate,” “become,” “plan,” “will,” and similar expressions. These forward-looking statements involve known and unknown risks as well as uncertainties, including those discussed in the following cautionary statements and elsewhere in this article and on this site. Although the Company may believe that its expectations are based on reasonable assumptions, the actual results that the Company may achieve may differ materially from any forward-looking statements, which reflect the opinions of the management of the Company only as of the date hereof. Additionally, please make sure to read these important disclosures.
David Chapman is not a registered advisory service and is not an exempt market dealer (EMD) nor a licensed financial advisor. He does not and cannot give individualised market advice. David Chapman has worked in the financial industry for over 40 years including large financial corporations, banks, and investment dealers.
The information in this newsletter is intended only for informational and educational purposes. It should not be construed as an offer, a solicitation of an offer or sale of any security. Every effort is made to provide accurate and complete information. However, we cannot guarantee that there will be no errors. We make no claims, promises or guarantees about the accuracy, completeness, or adequacy of the contents of this commentary and expressly disclaim liability for errors and omissions in the contents of this commentary.
David Chapman will always use his best efforts to ensure the accuracy and timeliness of all information. The reader assumes all risk when trading in securities and David Chapman advises consulting a licensed professional financial advisor or portfolio manager such as Enriched Investing Incorporated before proceeding with any trade or idea presented in this newsletter. David Chapman may own shares in companies mentioned in this newsletter. Before making an investment, prospective investors should review each security’s offering documents which summarize the objectives, fees, expenses and associated risks.
David Chapman shares his ideas and opinions for informational and educational purposes only and expects the reader to perform due diligence before considering a position in any security. That includes consulting with your own licensed professional financial advisor such as Enriched Investing Incorporated. Performance is not guaranteed, values change frequently, and past performance may not be repeated.


Ali G Makes Surprise Wimbledon Appearance with Cannabis-Themed Satire
Sacha Baron Cohen revived his iconic Ali G character at Wimbledon’s men’s final, blending satire with British high society. Dressed...


Medelon Shooting Club Restores Hall After Successful Crowdfunding Campaign
The St. Engelbertus Shooting Club in Medelon raised €10,260 through crowdfunding to renovate its shooting hall after unexpected dry rot...


Biotech Revival: Big Pharma Bets on Innovation and Acquisitions
After a downturn, biotechnology is regaining attention as major pharmaceutical companies invest heavily in innovative platforms to offset patent losses...


PAASIFEJ: Results-Based Financing Driving Inclusive and Sustainable Rural Growth in Morocco
Morocco’s PAASIFEJ program, funded with 2.4 billion dirhams, supports smallholder farmers, women entrepreneurs, and youth across seven regions while promoting...


Ecobnb Turns Sustainable Tourism Into Measurable Impact
Ecobnb’s sustainable tourism platform generated significant environmental and social impact in 2025, avoiding 58,207 kg of CO₂ and adding 583...
 |
|
 |  |
 |
|
-

 Cannabis1 week ago
Germany Tightens Cannabis Reimbursement Rules: Approved Medicines Must Come First
-
 Crypto7 days ago
Bitcoin’s Price Drops as Investors Turn to Layer 2 Solutions
-

 Crowdfunding2 weeks ago
East Crema Coffee Launches €3.5M Crowdfunding Campaign
-

 Markets2 days ago
Sugar Markets Balance Biofuel Demand and Global Supply