Featured
Why is the Canadian TSX Venture Exchange prone to booms and busts?
Markets have a history of being prone to booms and busts, and few have been more prone to them than the Canadian TSX Venture Exchange (CDNX).

‘’Stocks are super-attractive when the Fed is loosening and interest rates are falling. In sum: Don`t fight the Fed!’’—Martin Zweig, fund manager, Winning on Wall Street
‘’You know a country is falling apart when even the government will not accept its own currency.’’—Jim Rogers, financier, adventure capitalist, Quantum Funds
‘’A weak currency is the sign of a weak economy, and a weak economy leads to a weak nation.’’—Ross Perot, American businessman, 2-time 3rd-party presidential candidate, 1992 and 1996
Bear market talk abounds! We suppose it is not surprising, given that the S&P 500 had fallen almost 11.5 percent from its September 21, 2018, or 9.9 percent on a close basis. On just two pages of the October 31, 2018, edition of The Globe and Mail there were six bear stories. Maybe it was because it was October 31 (Halloween) and they just wanted to scare the bejesus out of us. But the headlines were there: “What if there’s a crash just as you retire?,” “Hunting for bargains? Try health care,” “Is it a good time to have a five-year GIC ladder?,” “Beware, markets haven’t hit rock bottom yet,” “As stocks’ nine-year bull run fades, a bear market beckons,” and “Seeking companies that have shown they can weather the storm.”
Maybe they caught the Dr. Doom disease (Marc Faber, author of the Doom, Boom & Gloom Report). Dr. Doom once said the S&P 500 was going to fall 50 percent. Except that was in August 2016 when the S&P 500 was 2,180. The S&P 500 rose another almost 35 percent after that. Faber did note that the market has not been driven by any genuine buying. Instead it had been driven by stock buybacks, takeovers, acquisitions, and it had been rising on narrow leadership (FAANG stocks). He forgot low interest rates and QE. The tax cuts had not yet been enacted.
No one has ever claimed that we are perma-bulls. “Perma-bear” and “gold bug” are words that we have been referred to as. Unfortunately, history is littered with financial crises, recessions, and depressions accompanied by stock market crashes of 50 percent or more. Since 1970, there have been 15 stock market declines for the Dow Jones Industrials (DJI) of 14 percent or more. That’s roughly a decline every three years.
But also, during that time the DJI is up 25-fold. We have had amazing advancements in communications, health care and more. But half the world lives in poverty, and in North America (Canada and the U.S.), over 10 percent live in poverty even if that poverty is better than 100 years ago. If you stick around long enough, the market recoups it for you. That fits well with the Warren Buffett philosophy. But a reminder, it does take a little longer when the market falls more than 50 percent. While the DJI really only did that once since 1970 (2007–2009), most markets are not the DJI. On average, since 1900, DJI bear markets fell 30.6 percent and lasted 401 days.
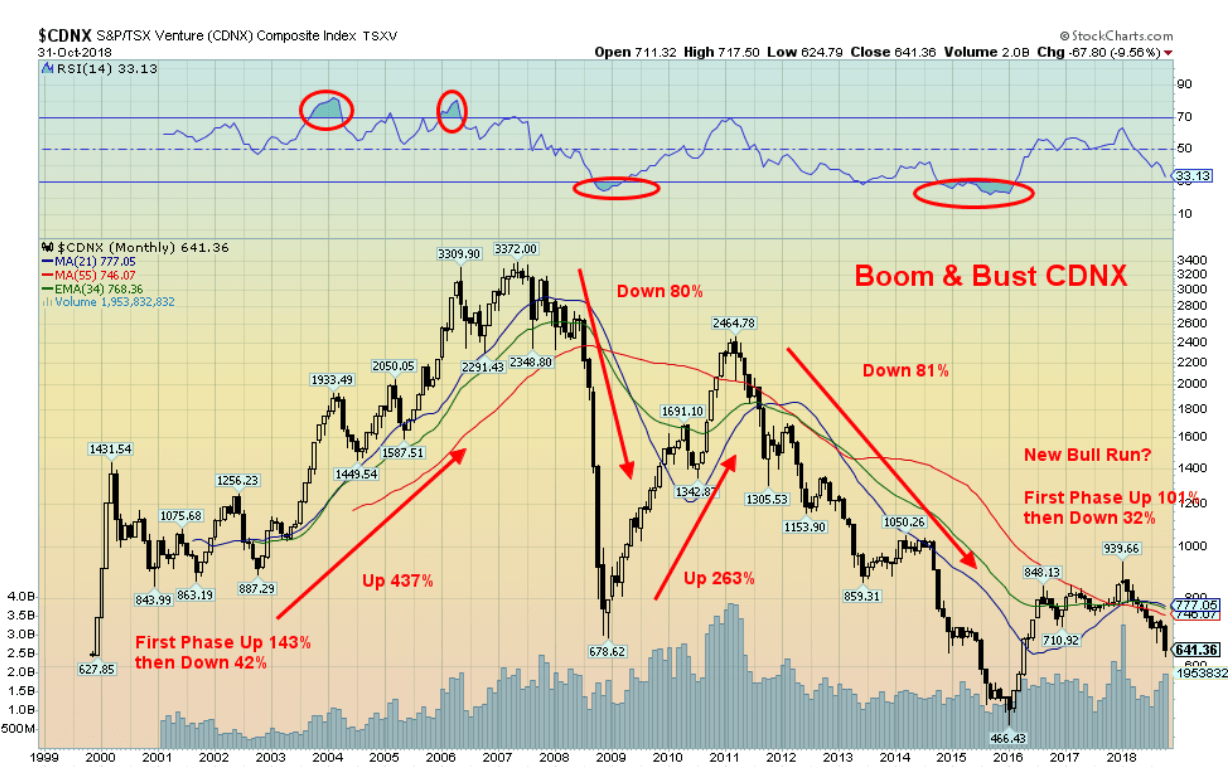
Things could be worse—a lot worse. Take, for example, the TSX Venture Exchange (CDNX). The CDNX only came into existence in November 1999 following the merger of the Vancouver Stock Exchange (VSE), the Montreal Stock Exchange (MSE), and the Alberta Stock Exchange (ASE). The CDNX has had two bulls: 1999–2007 with a gain of over 400 percent and 2008–2011 for a gain of over 260 percent. It has also had two bears: first in 2007–2008 where it fell 80 percent and in 2011–2015 where it dropped 81 percent. Despite a rally from 2015–2018 where it gained just over 100 percent, the CDNX has dropped back by 32 percent. It remains down 81 percent from its 2007 all-time high. Since its beginnings in late 1999, the CDNX as an index has returned absolutely nothing. Now, that is pain.
But don’t despair. After rising over 143 percent from its beginnings in late 1999 to a top in March 2000, the CDNX promptly fell 42 percent over the next nine months. Once it found its low, it didn’t stop rising until the high in May 2007. So maybe history will repeat itself and once the market finds a bottom, a long bull market could follow. Cyclically, it is overdue for a new bull. The CDNX does give true meaning to boom and bust.
© David Chapman
But is it just venture capitalist type indices that follow a boom and bust pattern? The CDNX is made up of roughly 50 percent junior mining ventures. In the bust phase, it is not unusual for many of them to fall 90 percent or more. Boom and bust is a pattern quite familiar with markets. A long period of boom is often followed by a vicious bust. The Grand Daddy of them all in the past century was the “Roaring Twenties” stock market boom that saw the Dow Jones Industrials (DJI) gain 345 percent 1923–1929. It was followed by an 89 percent bust from 1929–1932. It was the period of the Great Depression.
We haven’t been immune to boom and bust since then. The post-war boom of 1949–1966 saw the DJI rise 515 percent. The bust followed in 1966–1974 and the DJI fell 42 percent. Other markets fell even more. Gold soared 766 percent 1976–1980, then fell 68 percent 1980–1985. The Tokyo Nikkei Dow (TKN) soared 462 percent 1982–1990, only to fall into a long slump. From 1990–2003 the TKN fell 80 percent. The TKN is still down 44 percent from its all-time high in 1990 twenty-eight years later.
From 1999–2008, WTI oil was up an astounding 1,283 percent. When the crash came, WTI oil fell 77 percent in a matter of months from July 2008–February 2009. From 1990–2000 the high-tech/Internet boom was underway and the NASDAQ rose an incredible 1,489 percent. The crash saw it lose 78 percent from 2000–2002. Many companies just disappeared. Finally, the DJI ran up 97 percent from 2002–2007. The financial crash of 2007–2009 saw the DJI fall 54 percent. More recently saw Bitcoin rise 292 thousand percent 2010-2017 to be followed by a crash of over 70 percent. Many cryptos fell 90 percent or more and many just disappeared. Bitcoin is, however, still up over 105,000 percent from its humbling beginnings.
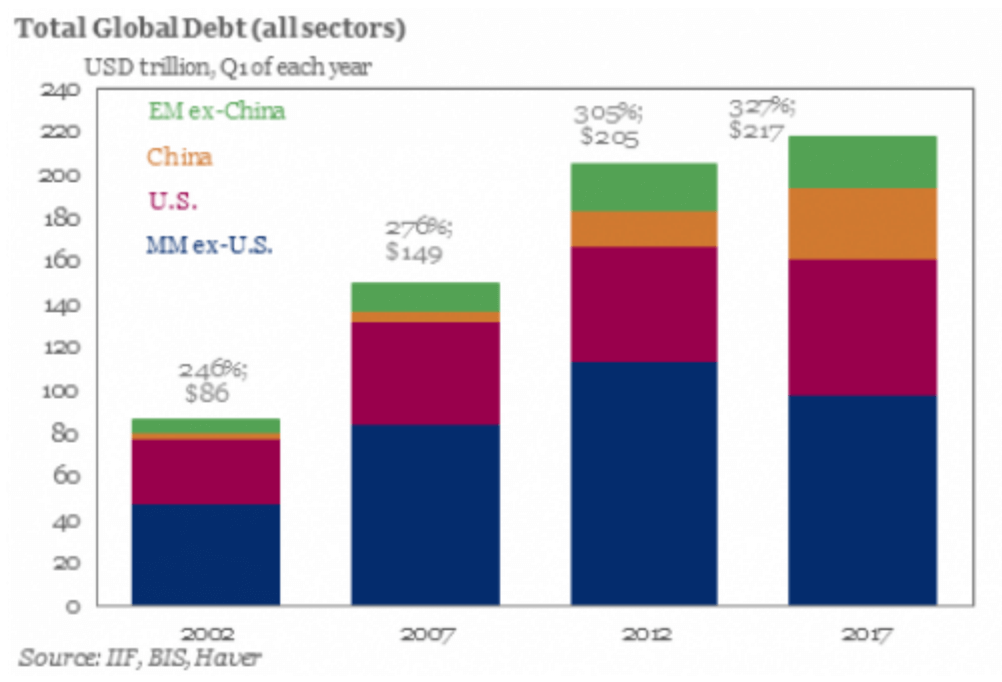
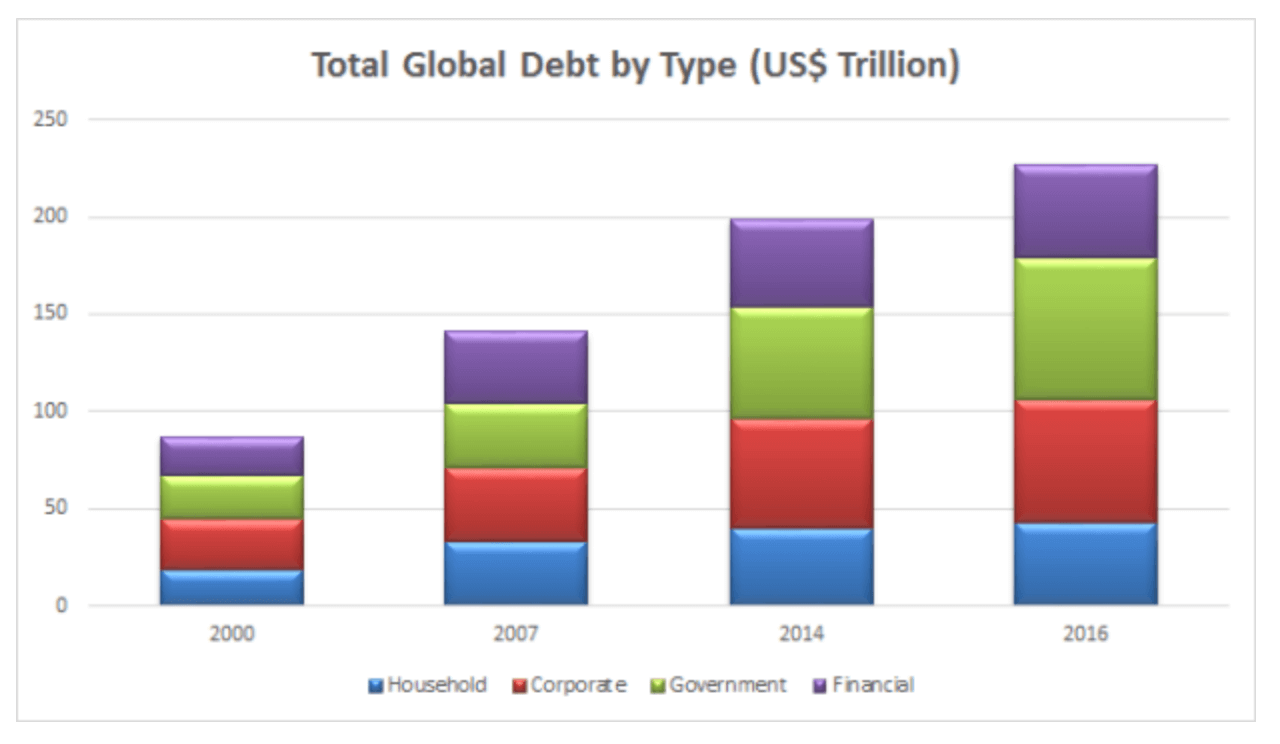
So, there should be no complacency with the current bull market that has seen the DJI rise 317 percent from 2009–2018. History tells us that, when it ends, it most likely will end badly. The major systemic risk is debt. Since the financial crash of 2008, the world has accumulated a massive amount of debt, estimated now to be about $250 trillion. That’s almost $100 trillion higher than it was back in 2007 at the beginning of the financial crisis. Never in history has so much debt accumulated in such a short period of time. It doesn’t matter whether it is government, corporations, or consumers. They have all been on a debt binge. Debt is an illusion of wealth. As long as the stock markets or housing prices are rising we believe we are wealthy.
© David Chapman
© David Chapman
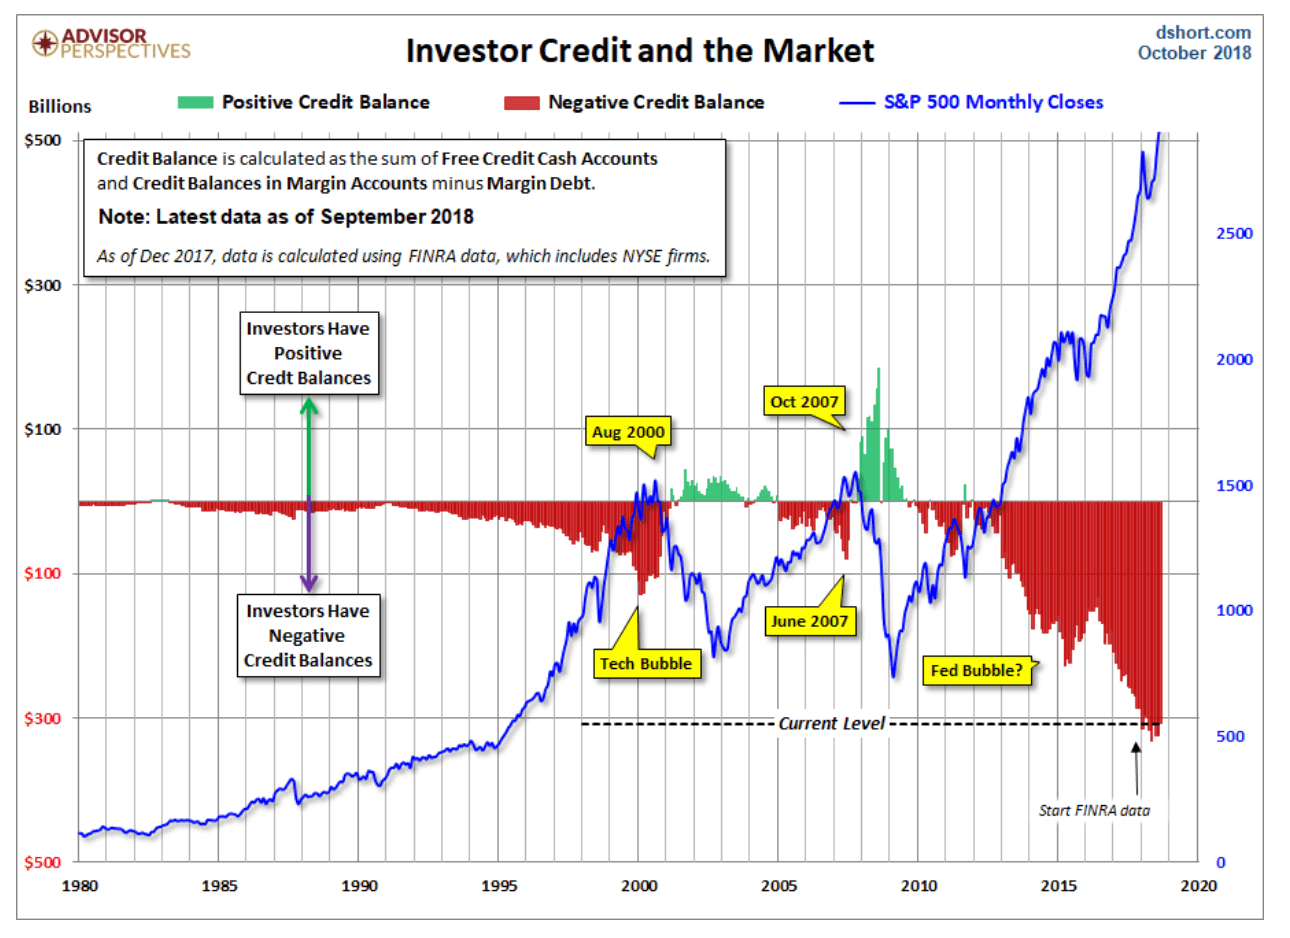
Possibly nothing illustrates the massive debt growth better than examining margin debt on the NYSE. The chart below examines margin debt in a larger context. It includes free cash accounts and credit balances in margin accounts. The credit balance is the sum of free credit cash accounts and credit balances in margin accounts minus margin debt. It overlays with the S&P 500. The chart is nominal and not adjusted for inflation. What it shows is that the negative credit balance has never been so huge. Not only does it pale where it was before the 2000–2002 high-tech/dot.com crash, but the level seen before the financial crash of 2008 seems puny compared to now. Debt has fueled the rise of the stock market. When the markets shift to down from up, leverage can be deadly.
The data here only goes until the end of September 2018. It will be interesting to see the October numbers, given the drop in the stock market this past month. Nonetheless, the extremes seen here bear close watching.
© David Chapman
None of this is to suggest that markets are about to crash. A plethora of stories in the mainstream papers is probably a sign that the market may have bottomed for this phase. There are numerous stories on the internet coming from the Marc Faber’s and others constantly preaching that doom and gloom lie just around the corner. Eventually, they could be right. But, as Martin Zweig said, “Don’t fight the Fed.” For years, the Fed held interest rates near zero and flooded the financial system with liquidity through quantitative easing. Now they are raising interest rates, and typically the Fed starts too late and hikes them too high.
We are not at that point yet where interest rates are too high. At 2.25 percent, the current Fed rate is roughly in line with current headline inflation. The Fed rate will become too high when it is well over the rate of inflation. Given the potential for another hike in 2018 and potentially three more in 2019, that suggests to us that the potential for a recession should not be upon us until late 2019 or early 2020. Add in the currency wars, trade wars, and global big power tensions, plus the potential for political instability in the U.S. after the mid-terms, there exists at some point the potential for another Lehman Brothers moment. Just not right now.
The good times just keep rolling along and the stock markets, for the most part, appear to be dealing with the hiccups. The recent good employment numbers are a case in point as was the strong Q3 GDP. Earnings remain strong, and just when the trade wars threaten to intensify, word comes that they might make a deal (China/U.S.). A rise back towards the September stock market highs by year-end or early 2019 is not out of the question. Keep an eye on the U.S. dollar and gold for clues that the market is amiss. Following nine years of what may be the most historic bull market ever, history tells us that it will not end well. Time is running out.
Bitcoin watch
© David Chapman
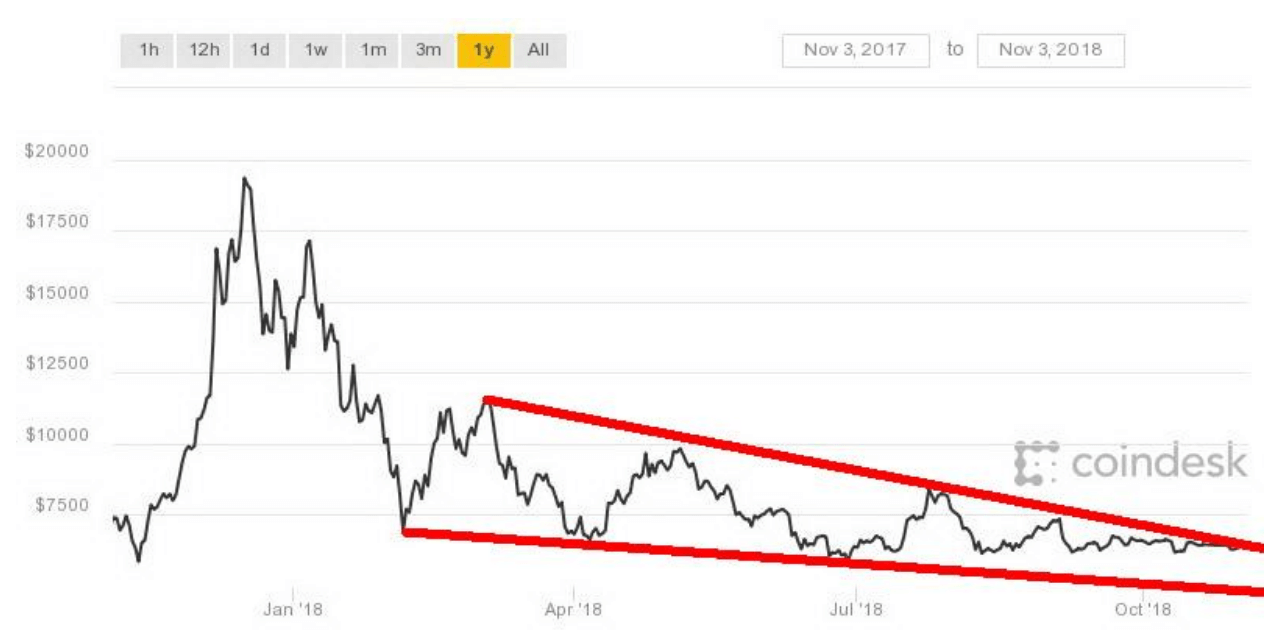
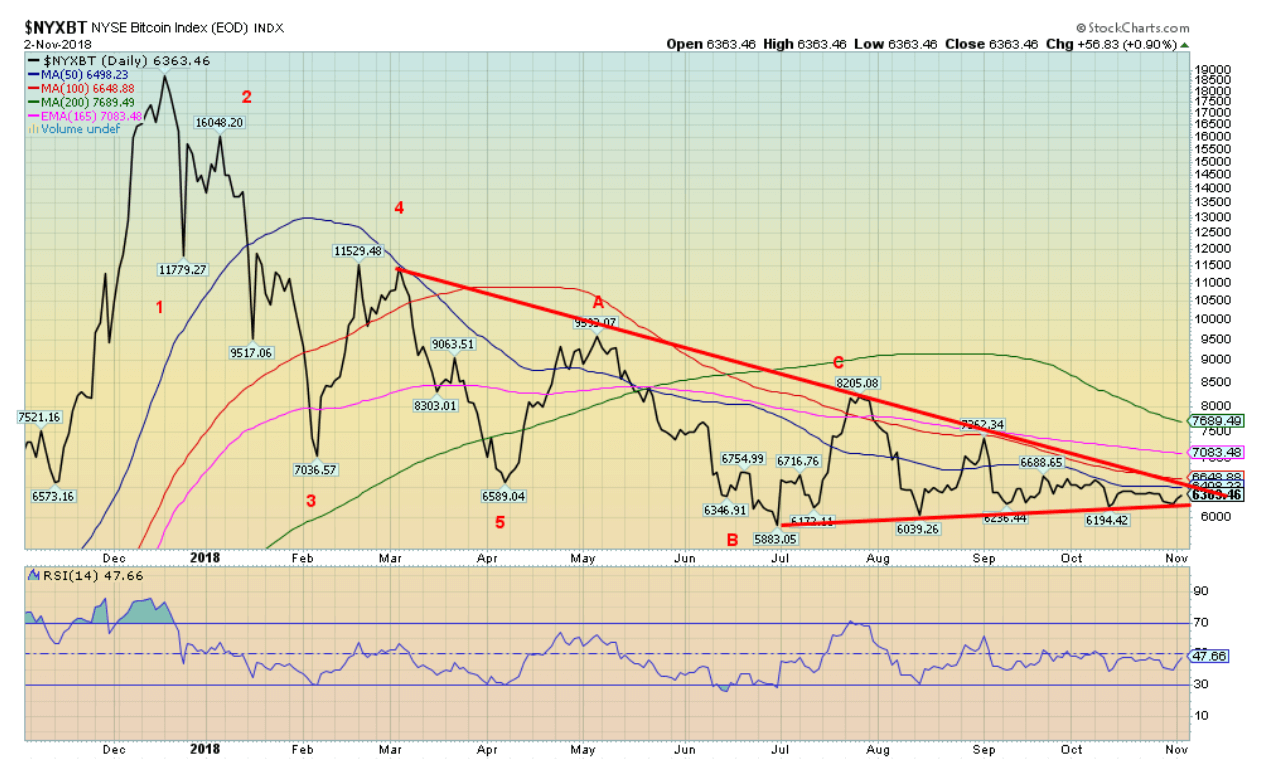
For the past two months, Bitcoin has traded in a narrow range roughly between $6,200 and $6,700. As well, Bitcoin ended October in the red, marking three consecutive months of losses. That was the first sustained period of losses since 2015. It is not as if the losses were large. August was the worst, down 9.2 percent while September fell 5.8 percent. October dropped 4.3 percent. The glory days of 2017 are becoming a distant memory. In May 2017 Bitcoin leaped an astounding 72.9 percent as it charged towards $20,000. Despite all that, one of the first stories we saw for November was how Bitcoin has historically enjoyed positive Novembers. The bulls became excited that this could be their month.
It is not as if Bitcoin or the cryptos have been around that long to really establish seasonal patterns. Measuring from 2010 does not make for a large number of observations. But the author of the report contending that Bitcoin may break a three-month losing streak was clearly trying to be optimistic that November would bring better times. The three-month high seen back in September was around $7,400. That is the point that Bitcoin would need to take out. Support appears to have materialized at $6,200 and further support is seen down to $5,800. But below that a decline to $5,000 is likely. The most likely outcome is another month of boredom, waiting to see whether Bitcoin goes up or down.
Remember Dogecoin (DOGE)? Well, it apparently had a bad October, falling some 36 percent. Amazingly, Dogecoin remains in the top 25 of cryptos by size, with a recent reported market cap of some $442 million. That is pretty amazing for what many consider a joke. Dogecoin is a meme-themed crypto. Dogecoin hit its zenith in January 2018 with a market cap of $1,257 million actually make that read $1.257 billion, yes billion. Dogecoin has been down 65 percent since then. All we can say is, “Woof.” There are 116.8 billion Dogecoins circulating around the crypto world. Well what does one expect when a Dogecoin = US$0.003784. You’d need 800 to buy a tall-boy Starbucks coffee. Not that you actually could. Not even sure what you could buy with a Dogecoin, but apparently you can. The most popular uses are in the online pornography and poker industries.
The market cap of all cryptocurrencies was reported on November 2, 2018, as $206.1 billion. That is down $2.4 billion on the week. Amazingly enough there were 2,092 cryptos reported at Coin Market Cap, up from 2,070 a week earlier. The universe just keeps on expanding. There were 15 cryptos listed with a market cap over $1 billion. That is down from 16 a week earlier. The number of dead coins appears to have stalled out. It remains at 929 as reported by Dead Coins.
The conclusion seems to be there are more cryptos giving birth than there are dying. No wonder regulators are tearing their hair out.
© David Chapman
U.S. and Canada job numbers
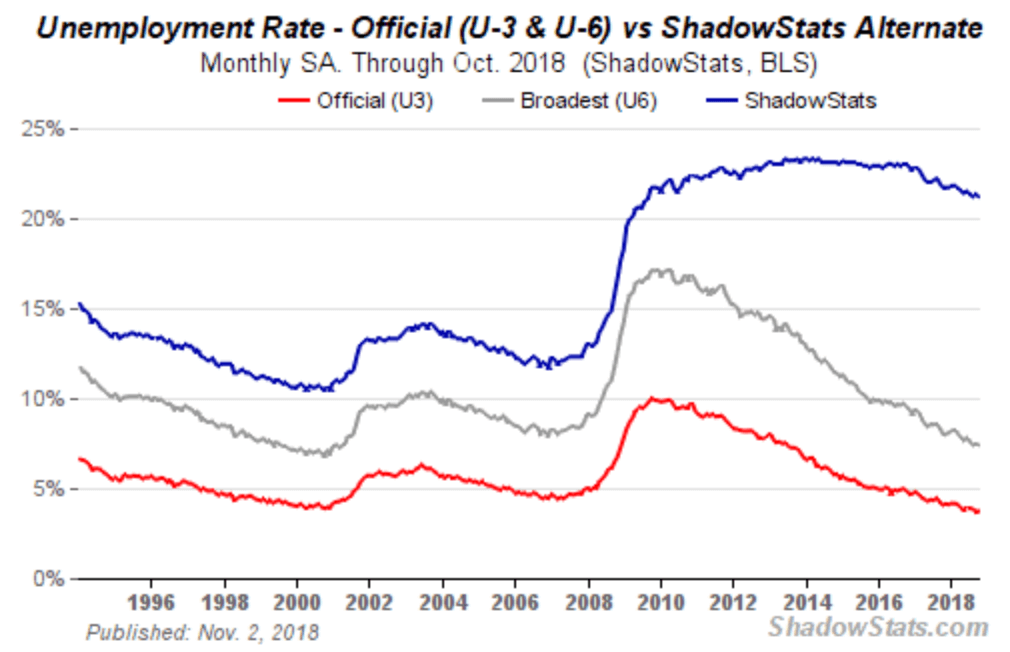
The October job numbers for both the U.S. and Canada came out on November 2. The U.S. reported a gain in the nonfarm payrolls for October of 250,000. The market had expected only 190,000. The September nonfarm payrolls were revised, down to 118,000 from 134,000. Generally, this was considered a strong report. Initially the stock market rallied, but later came off and turned negative. The unemployment rate (U3) was unchanged at 3.7 percent, although technically it rose to 3.74 percent from 3.68 percent in September. The broader U6 unemployment slipped to 7.43 percent from 7.45 percent while the Shadow Stats unemployment rate (U6 plus long term unemployed and discouraged workers defined out of the labour force in 1994) came in at 21.2 percent down from 21.3 percent.
© David Chapman
The nonfarm payrolls most likely jumped because of previous distortions caused by the hurricanes in North Carolina and Florida. As usual, however, when one looks at the other numbers reported by the Fed they don’t necessarily add up. The civilian labour force grew by 711,000 in October. As a result, the labour force participation rate jumped to 62.9 percent from 62.7 percent. More people looking helps push up the unemployment rate. The employment level was up 600,000 while those employed full-time rose by 318,000. Those employed part-time rose by 242,000. As a result, the civilian employment population ratio also rose to 60.6 percent up from 60.4 percent.
The total number of unemployed also rose up 111,000. But the number not in the labour force fell by 540,000, thus helping hike the labour force participation rate and fueling the increase in the civilian labour force. The number of men searching for work who are not in the labour force fell by 9,000 and for women it was down 77,000. Those who are not in the labour force but want a job fell to 2,298,000 down 83,000 on the month. An interesting figure is the number of people who are multiple job holders. This is a number that has been rising. In 2010 the number was only 6,657,000. The latest figure was 7,883,000, up 176,000 in the month. The number of people who hold two part-time jobs also rose up 130,000 in the month. All of this suggests that people are struggling to get by and many need two jobs just to make ends meet.
Average hourly earnings rose 0.2 percent and, year over year, they are up 3.1 percent. This number will catch the attention of the Fed and, coupled with the strong employment numbers, the pressure will remain for the Fed to hike interest rates another 25 bp in December. They will hike, despite Trump’s musings that he doesn’t like it.
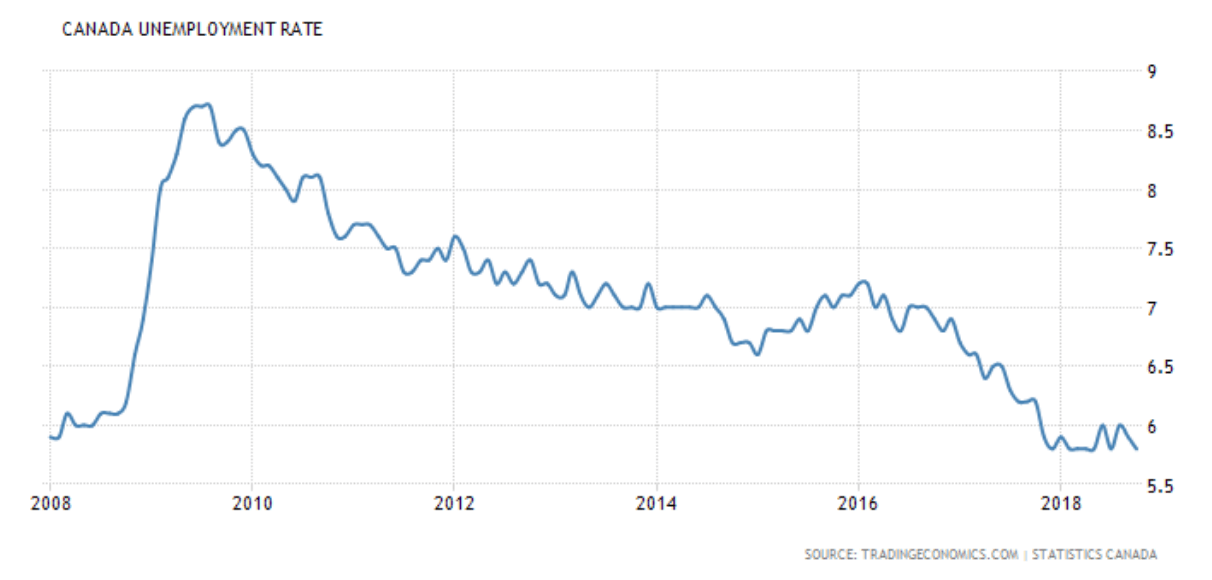
In Canada, Statistics Canada reported that Canada added 11,200 jobs in October. In September, they reported a gain of 63,300. There were an additional 33,900 full-time jobs while part-time jobs saw a decline of 22,600. The unemployment rate came in at 5.8 percent, down from 5.9 percent. The labour force participation rate slipped to 65.2 percent from 65.4 percent. That helps lower the unemployment rate. The Ontario unemployment rate fell to 5.6 percent, the lowest in a decade. Ontario has added 83,000 jobs in the past year, many full-time.
© David Chapman
Markets and trends
© David Chapman
© David Chapman
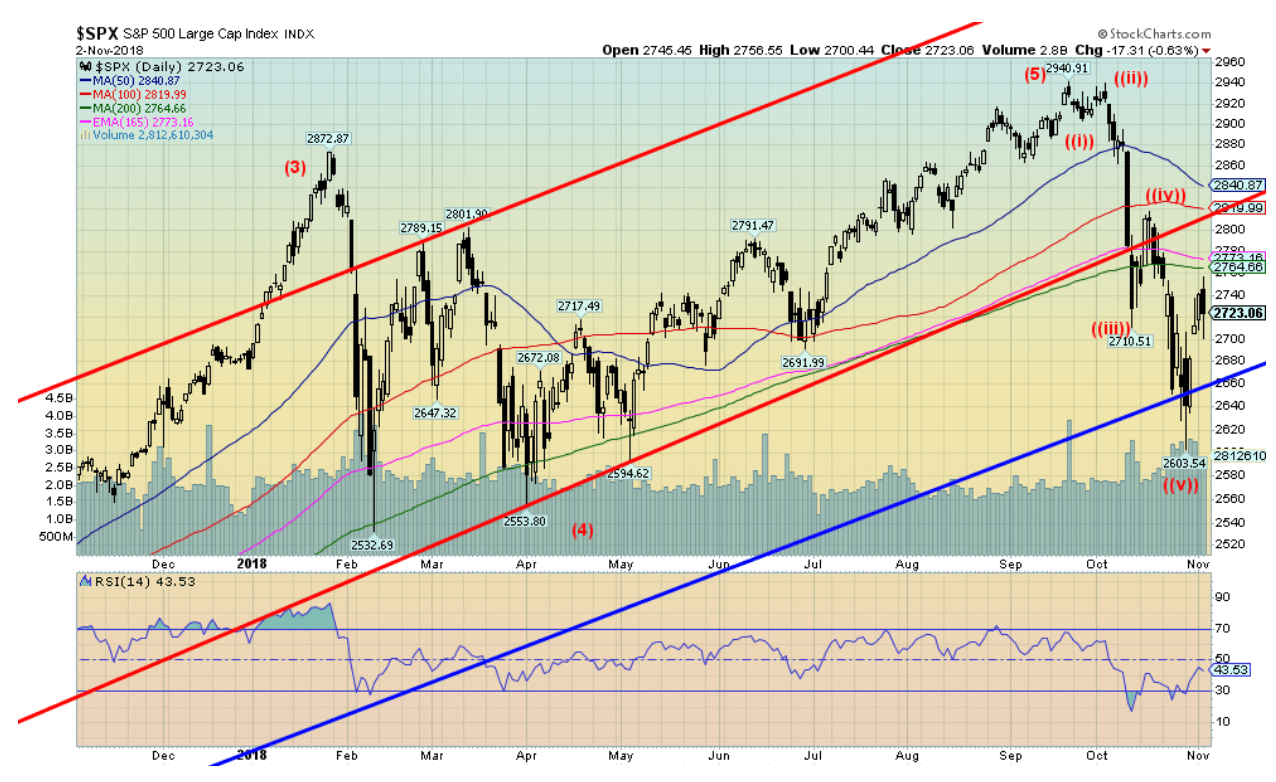
We believe that a new bear market is now underway. The recent decline from the September high appears to have fallen in five waves, suggesting an impulse wave to the downside. It should be noted that the rise to all-time highs in September was largely predicated on just two stocks—Amazon and Apple. They accounted for a full third of the rise seen in 2018. That reminds us of the famous “nifty-fifty” rally of 1972 that saw the market peak in January 1973. What followed was the devastating 1973–1974 bear market that saw the DJI fall 45 percent and many other indices lose even more. There are two trendlines shown here. First, the one in red is up from the February 2016 low, and the second one in blue is coming up from the March 2009 low. Interestingly, it took out the March 2009 trend line, but just barely. We believe the S&P 500 has completed a five-wave advance to the peak in September and the collapse in October is the first wave down. A corrective wave should now follow that could, in theory, take us all the way back to the highs and even slightly higher.
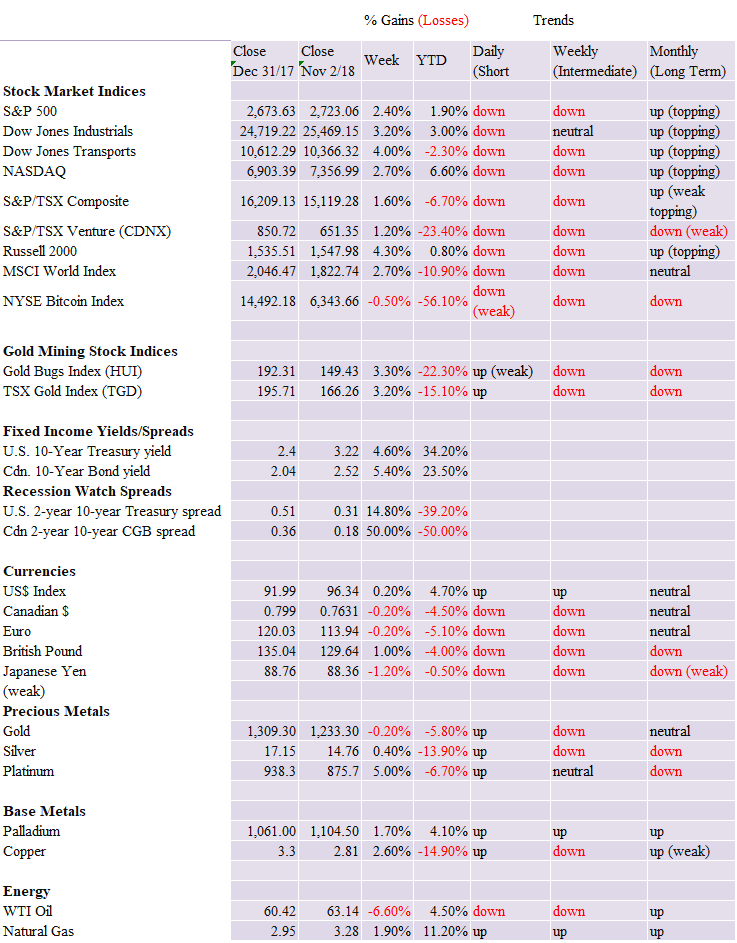
The S&P 500 jumped 2.4 percent this past week and now, going into the mid-terms on Tuesday, the market is positive for the year unless, of course, Monday wipes out the gains. We doubt that. Irrespective of the outcome on Tuesday, we believe it could be a catalyst to spark another rally back towards the recent highs. The Dow Jones Industrials (DJI) gained 3.2 percent this past week while the Dow Jones Transportations (DJT) was up 4 percent. The DJT, however, remains down on the year by 2.3 percent. The NASDAQ gained 2.7 percent while the small cap Russell 2000 was up 4.3 percent. Elsewhere markets were also positive. The London FTSE 100 gained 2.2 percent, the Paris CAC 40 was up 2.7 percent, and the German DAX jumped 2.8 percent. In Asia, China’s Shanghai Index (SSEC) gained 3.0 percent while the Tokyo Nikkei Dow (TKN) was up a stellar 5 percent. Interestingly, however, all five indices remain down on the year with the SSEC the worst off 19.1 percent on the year.
A new bear phase is, we believe, now underway. This bear market could last upwards of two years or more, with many twists and turns. Most likely it will take a Lehman Brothers moment or a huge sovereign default to trigger a bigger decline. A reminder that there are very shaky sovereigns out there, particularly Turkey, Argentina, and Italy. The S&P 500 has resistance up to 2,800, but above that level a challenge of the high at 2,940 could occur. Major support lies at 2,600. There is a gap on the chart, roughly between 2,680 and 2,700. If that level is filled, then odds favour a test of 2,600. But the action, so far, suggests to us that the first phase of the bear is likely over and the mid-terms, no matter what the outcome is, could spark a rally (a relief rally?). That should play into the traditional rally after Thanksgiving and the so-called “Santa Claus” rally.
© David Chapman
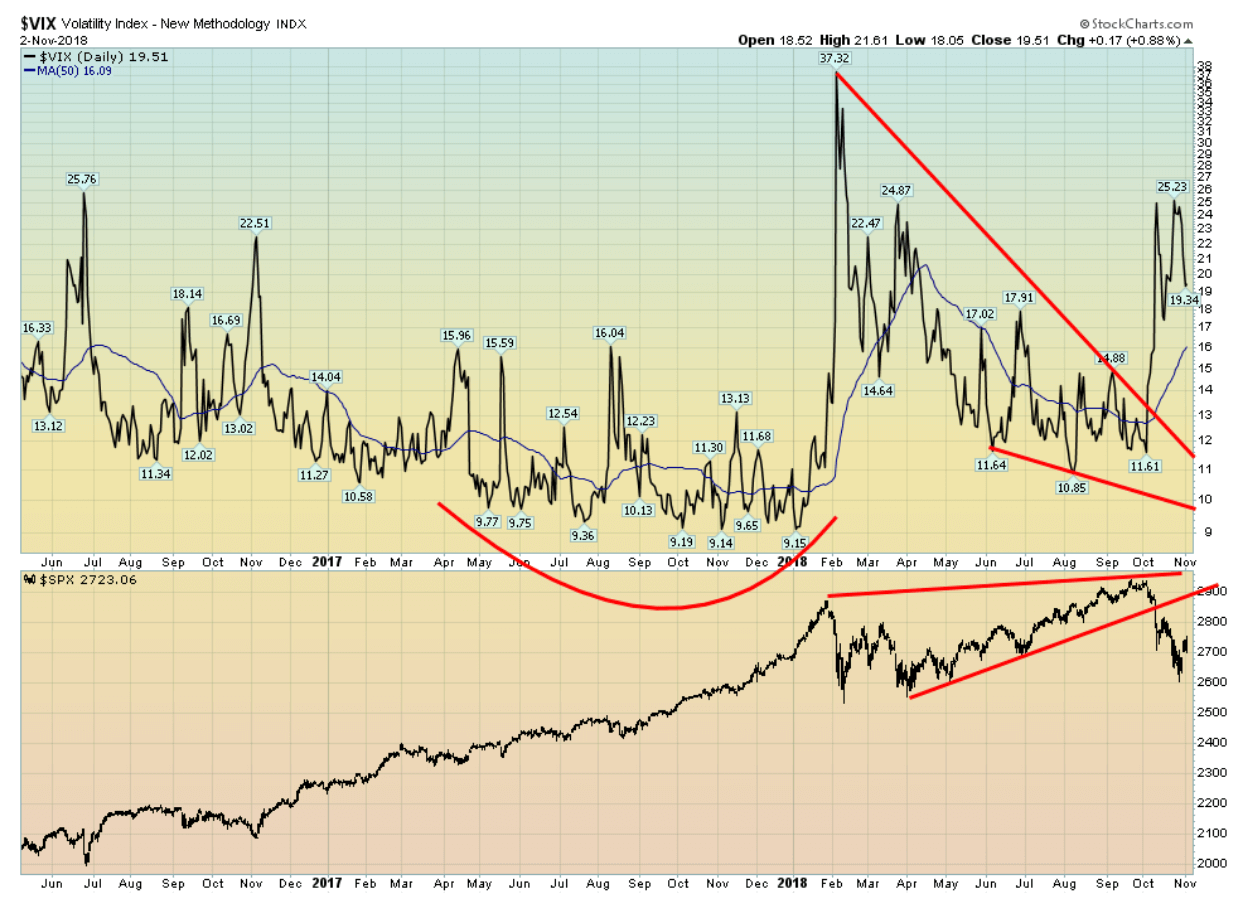
It was no surprise that volatility jumped in the recent decline. Despite the decline, volatility, as measured by the VIX, only hit 25, short of the 37 seen during the February 2018 decline. It is possible that is a divergence as the plunge in the S&P 500 was at least equal to the February decline. The October decline largely fulfilled the targets of the possible wedge triangle that formed at the top. The possible divergence on the VIX suggests that the S&P 500 could return to test the breakdown zone, currently near 2,900. B waves can also take the market to new highs and fool everyone. Even so, we would be surprised to see the VIX take out the recent lows near 11 on any rise for the S&P 500.
© David Chapman
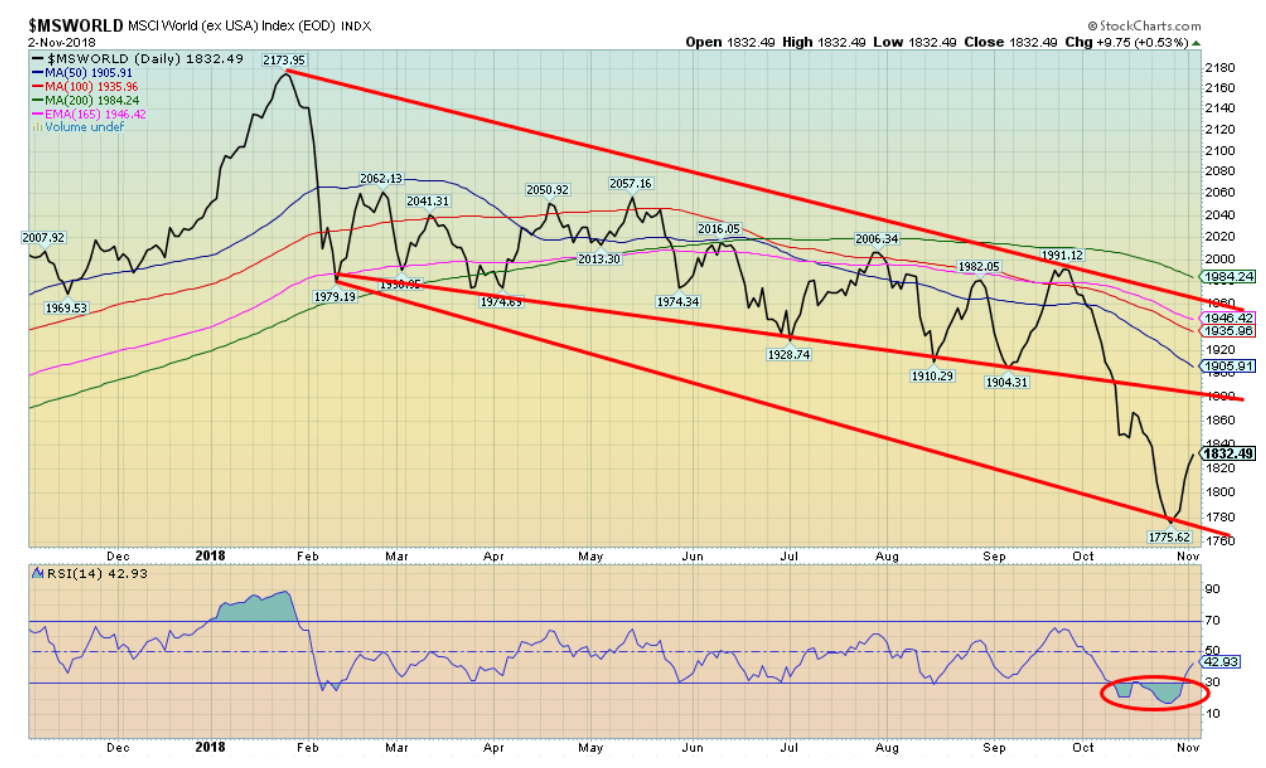
The MSCI World Index rebounded this past week along with the rest of the market. The index, however, remains well below its 200-day MA, suggesting that it is now in a bear market. A rebound back to 1,900 or even 2,000 is not impossible. We doubt any higher as signs abound that a new bear market is underway.
© David Chapman
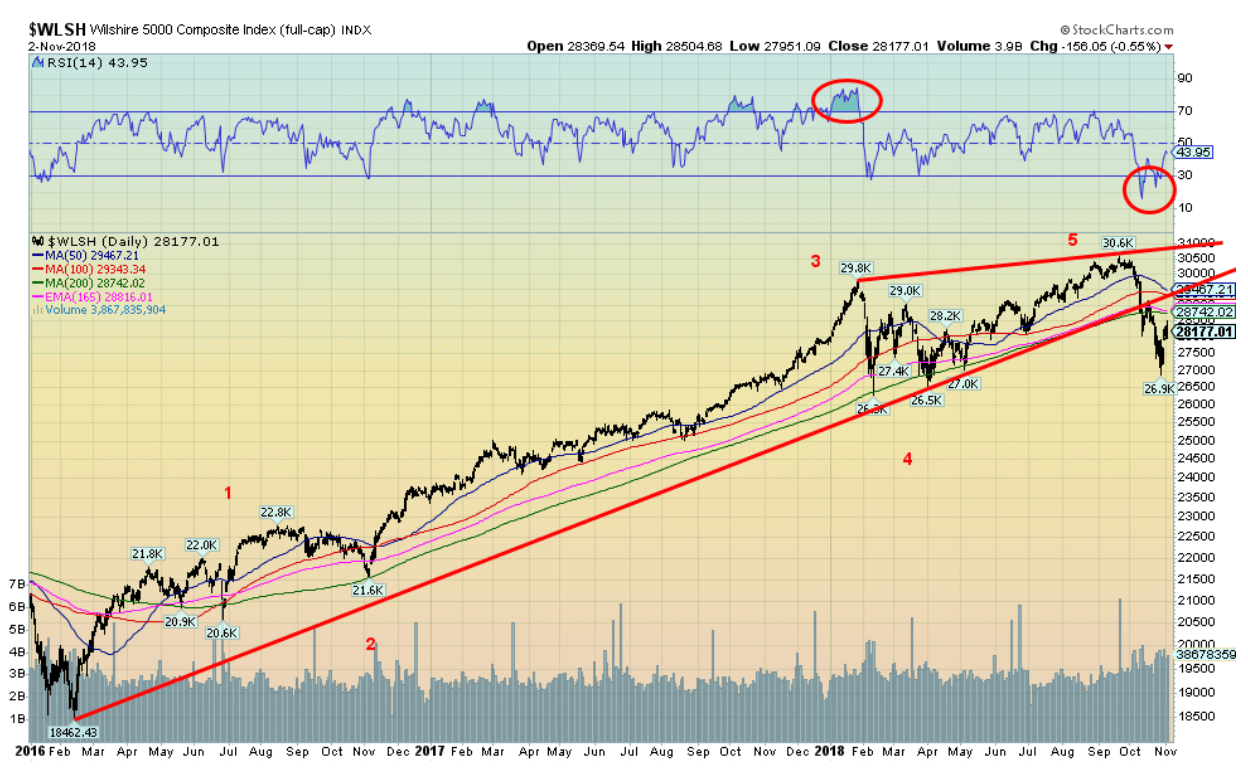
The Wilshire 5000 Composite is as broad a composite as one can look at. Like the other indices, it too has broken down under its 200-day MA. Note that the Wilshire briefly took out the February lows but remains quite a way from taking out the 2017 low. The Wilshire, as with the other indices, appears to have completed a five-wave advance from the February 2016. It would not be unusual to see the Wilshire claw its way back to around 30,000 before succumbing once again. Under 27,000 new lows are highly probable.
© David Chapman
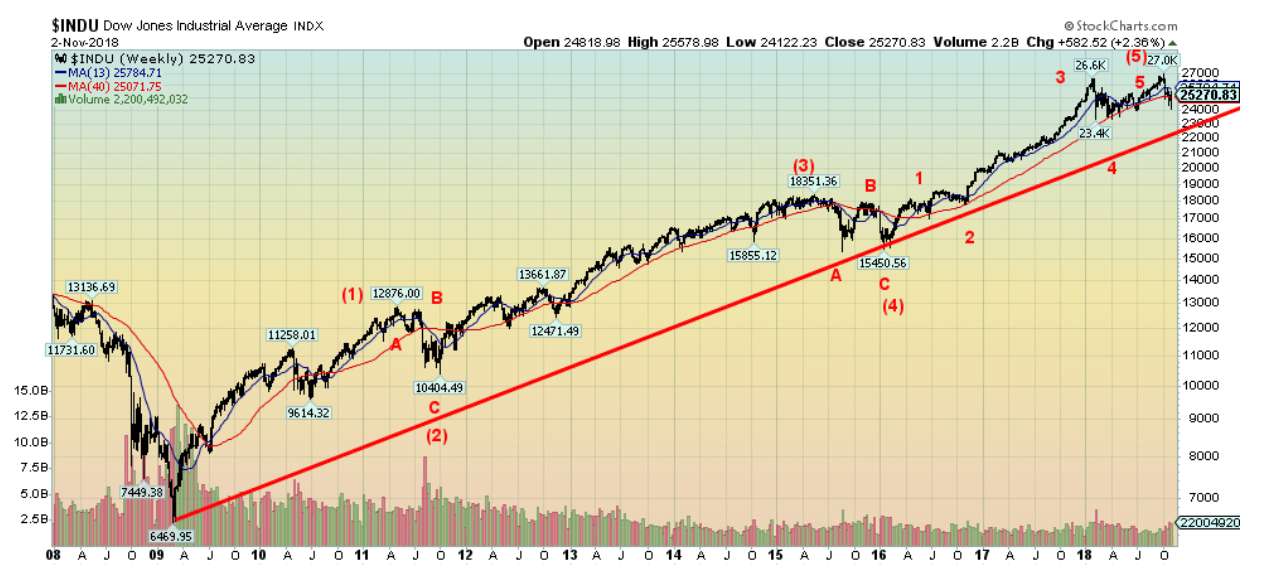
The longer-term weekly chart of the DJI shows a potential complete five-wave advance from the March 2009 lows. If that is correct, then a significant correction should be underway, a correction that could last a few years and take the markets down 40 percent-60 percent. The DJI has broken below its 40-week MA, but then it did that in 2011 and again in 2015/2016, only to rebound and move back above the key weekly MA. A breakdown under the trendline up from the March 2009 lows currently near 22,400 would confirm that a major bear market is underway.
© David Chapman
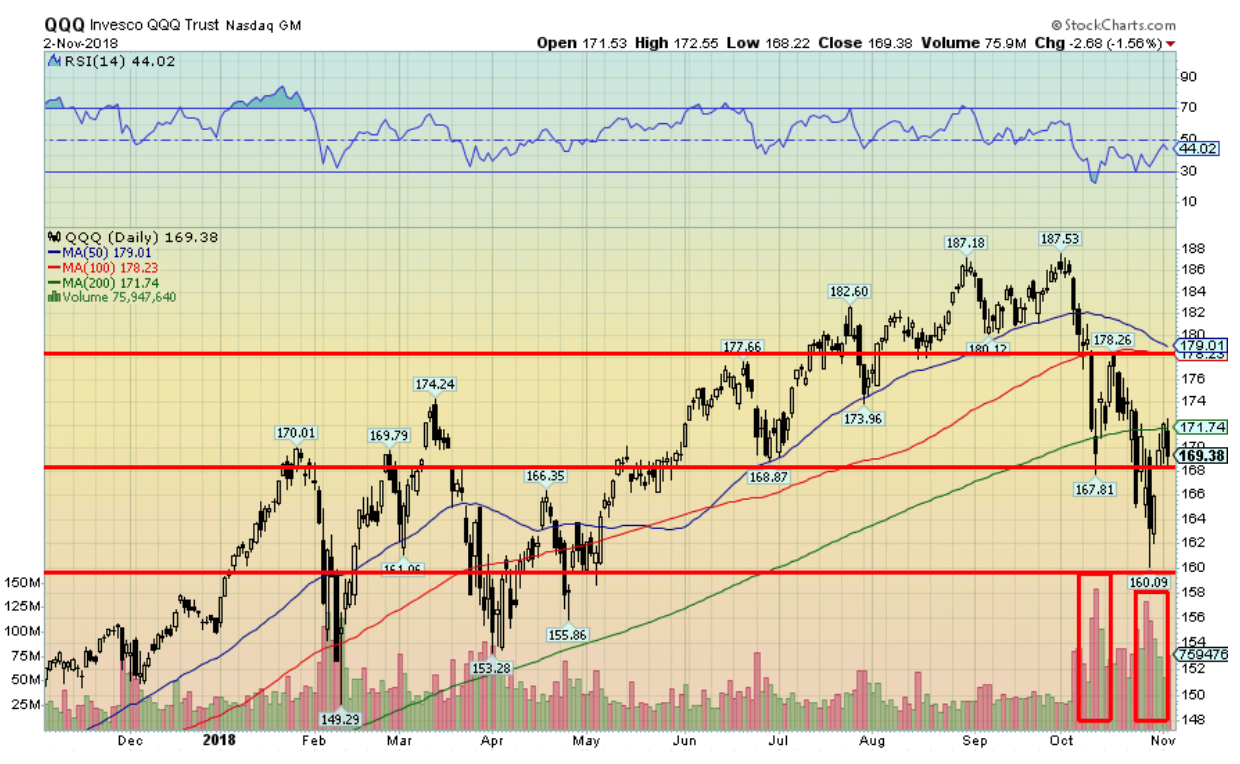
The Invesco QQQ Trust (QQQ-NASDAQ) acts as a proxy for the NASDAQ 100 Index. After putting in a high-volume low on October 29, the QQQs or Qs as they are known, rebounded, gapping higher on October 31. This may be a breakaway gap. Notably it stalled at the 200-day MA. A move above 171 once again could, however, send the Qs higher towards resistance at 179. The Qs could bounce around trying to form a bottom. But any real assault on the August/September highs would not take place until the Qs firmly took out 180. A more positive scenario remains in place as long as the Qs hold above 166.
© David Chapman
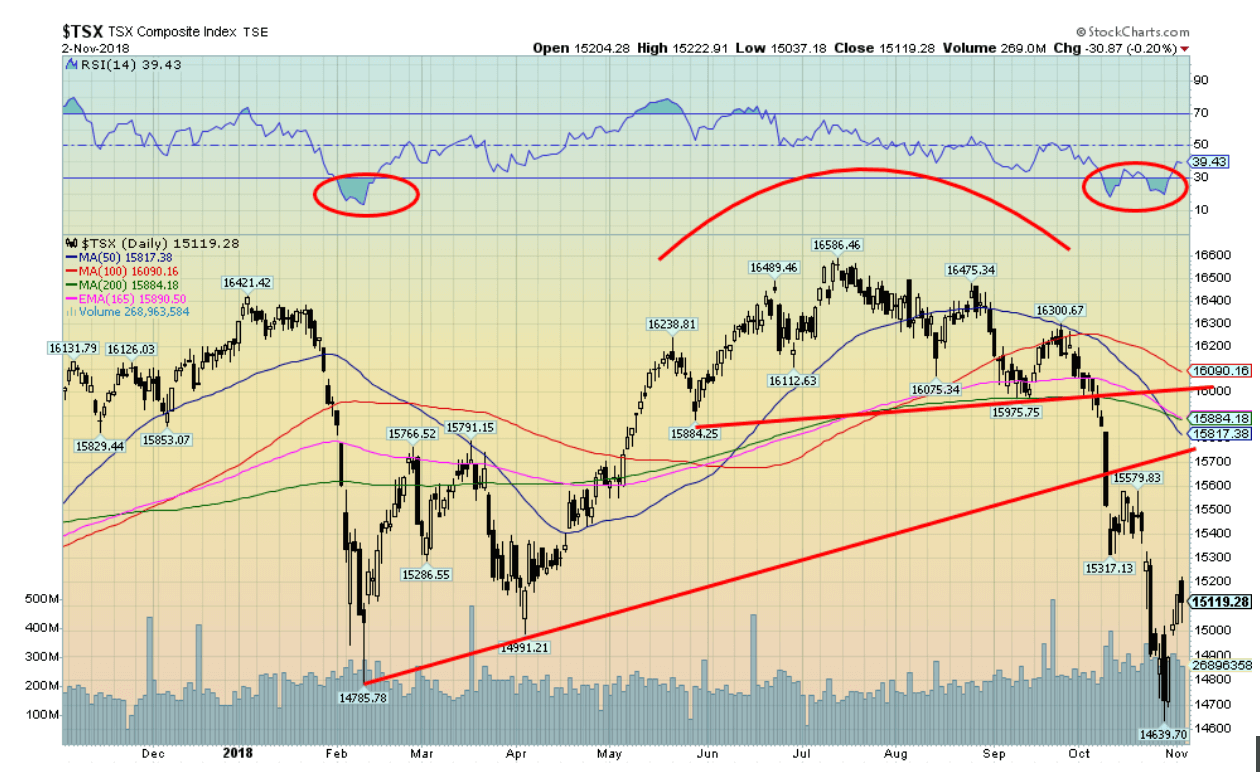
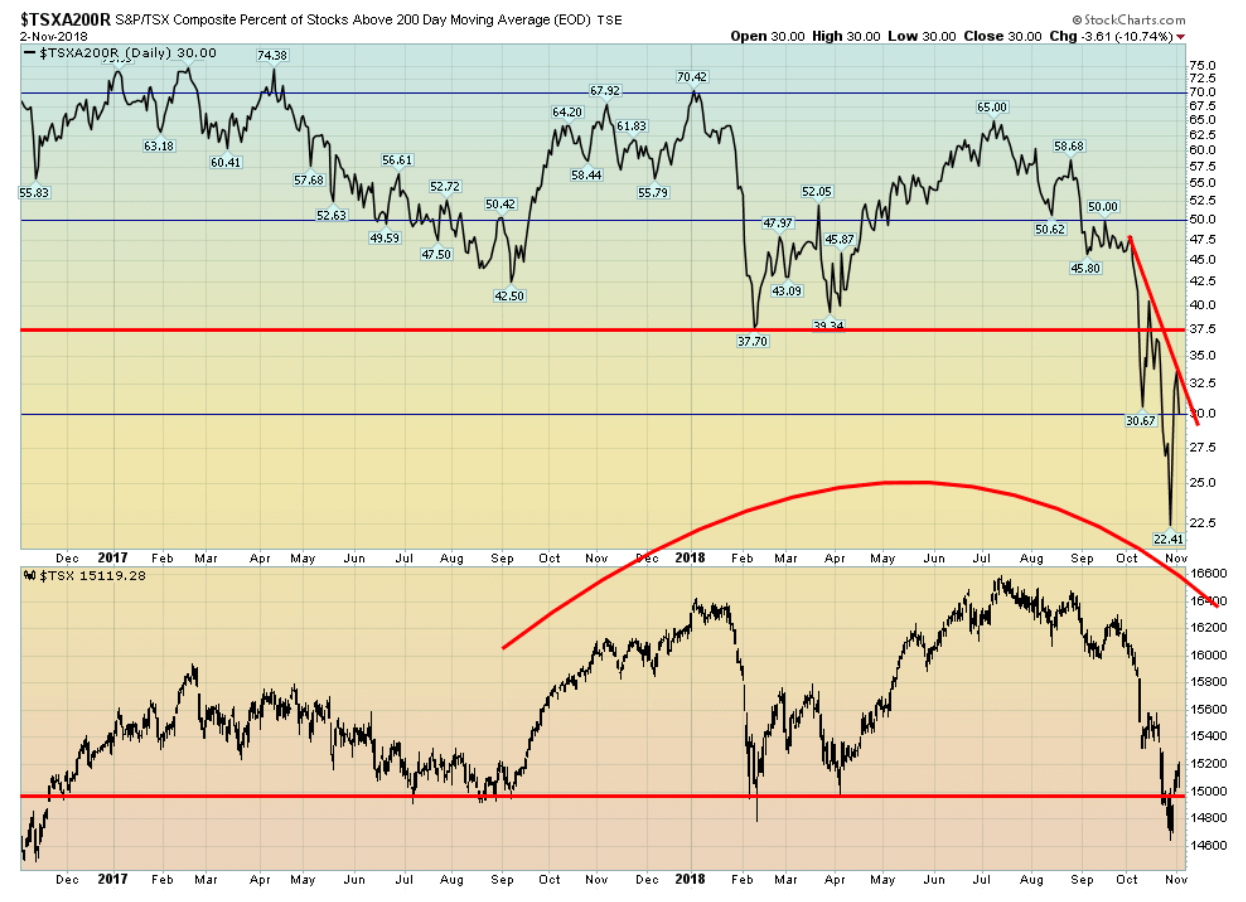
The TSX Composite bounced back this past week along with the rest of the market, gaining 1.6 percent. The TSX Composite appears to have fallen in five waves from the high seen in July 2018. A rebound that takes us back to test the 200-day MA near 15,885 is not out of the question. The TSX Composite has taken out its February lows and that is a negative sign. The TSX Composite has also taken out the lows of 2017 and that is another negative sign. It suggests to us that a longer-term bear market is in the early stages. All that remains is for the monthly indicators to turn negative. At the recent lows the TSX Composite was down almost 12 percent from its high.
© David Chapman
As a sign of the developing bear market for the TSX Composite, the number of stocks trading above their 200-day MA is only 30 percent. This is off the low that was recently seen at 22 percent. This confirms that the TSX Composite has moved into bear territory. The all-time low for the index was 3 percent back at the height of the 2008 financial crisis. It is interesting to note that the index fell below 50 percent in August 2007 and remained that way until June 2009.
© David Chapman
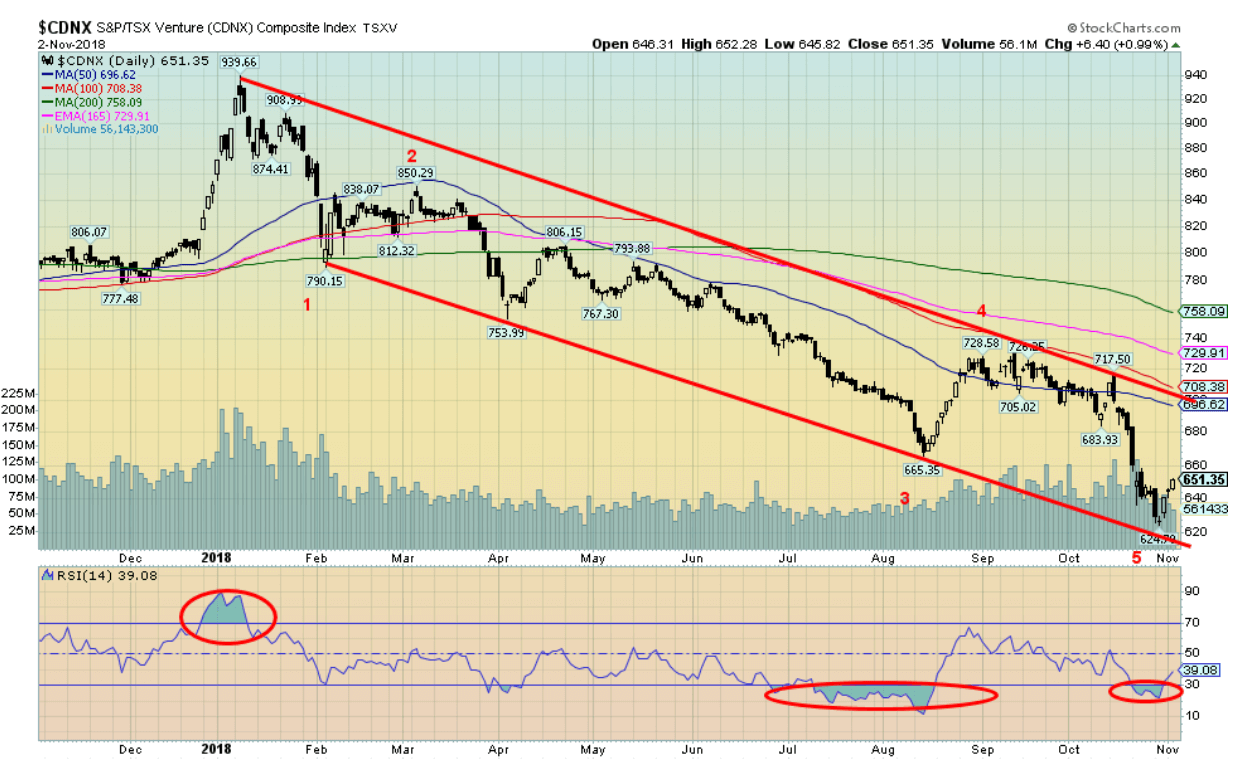
This is a close-up of the TSX Venture Exchange (CDNX). The CDNX appears to have fallen in five waves from the high seen in January 2018. If correct, then a significant rise should get underway. The CDNX is at least 50 percent junior mining stocks so they remain the most important component. The CDNX also holds significant junior energy, high-tech, and biotech stocks. As we noted in our main essay, the CDNX is prone to periods of boom and bust. We have been through a significant bust period and, if correct, it is setting us up for the next boom, one that could see the CDNX double or more from current levels.
© David Chapman
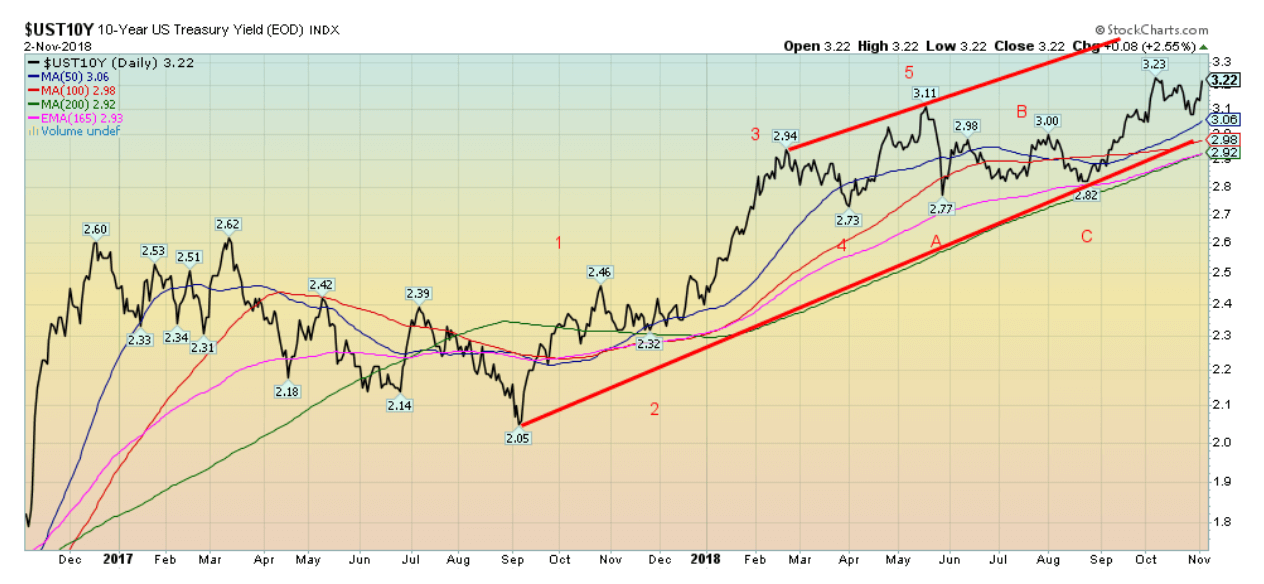
The strong job numbers on Friday sent yields on the U.S. 10-year Treasury note higher, closing at 3.22. This is a new high close, even though the 10-year failed to take out the previous high of 3.23 percent. Our minimum target for the 10-year remains 3.45 percent. Canadian bond yields also jumped as the Canadian Government 10-year bond (CGB) jumped to 2.52 percent, up from 2.39 percent. Canada also reported robust job numbers.
Recession watch spread
© David Chapman
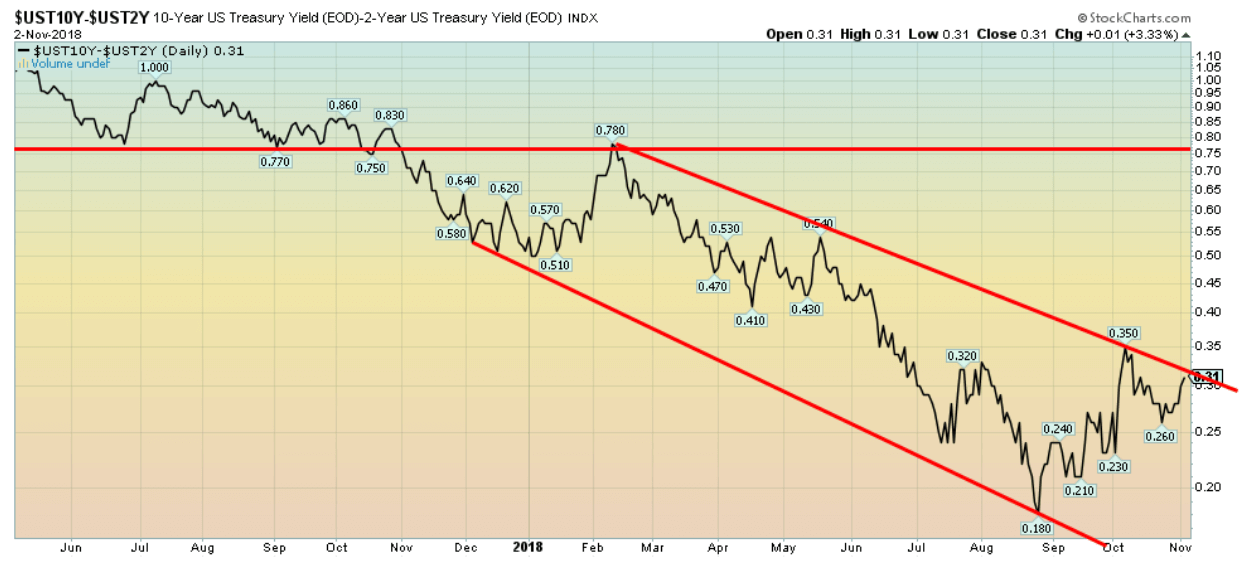
The recession watch spread (2–10 spread) moved higher this past week to 31 bp from 27 bp the previous week. The strong job numbers on Friday helped push the 10-year higher with no discernible rise in the 2-year. The 2–10 spread remains within the bear channel. Despite the rise this past week, our view that a recession could be upon us, possibly in 2019, but for sure in 2020 has not changed. The 2–10 spread still needs to fall to negative as it has in previous cycles and remain negative for upwards of six months. The Fed will, most likely, hike interest rates in December despite the musings of President Trump attacking the policies of the Fed and its Chairman Jerome Powell.
© David Chapman
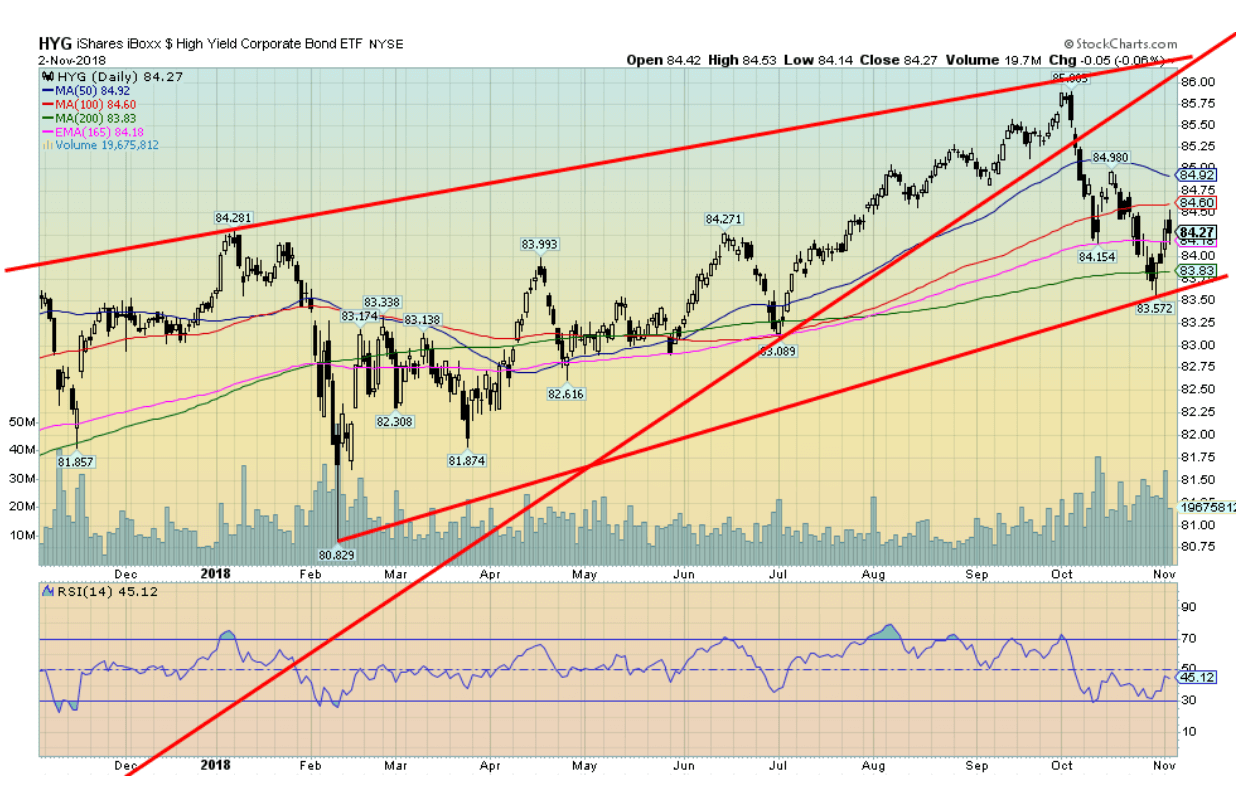
Like the stock market, the iShares iBoxx High Yield Corporate Bond ETF (HYG-NYSE) appears to have broken down. Unlike the stock market, however, the HYG continues to hold the 200-day MA. The HYG is acting as a proxy for high yield (junk) bonds. If a debt crisis is to get under way, the HYG should fall rapidly. So far, it seems to be “hanging” in. This is not much different, in some respects, then the 2–10 spread continuing to “hang in,” even as it moves inexorably lower.
© David Chapman
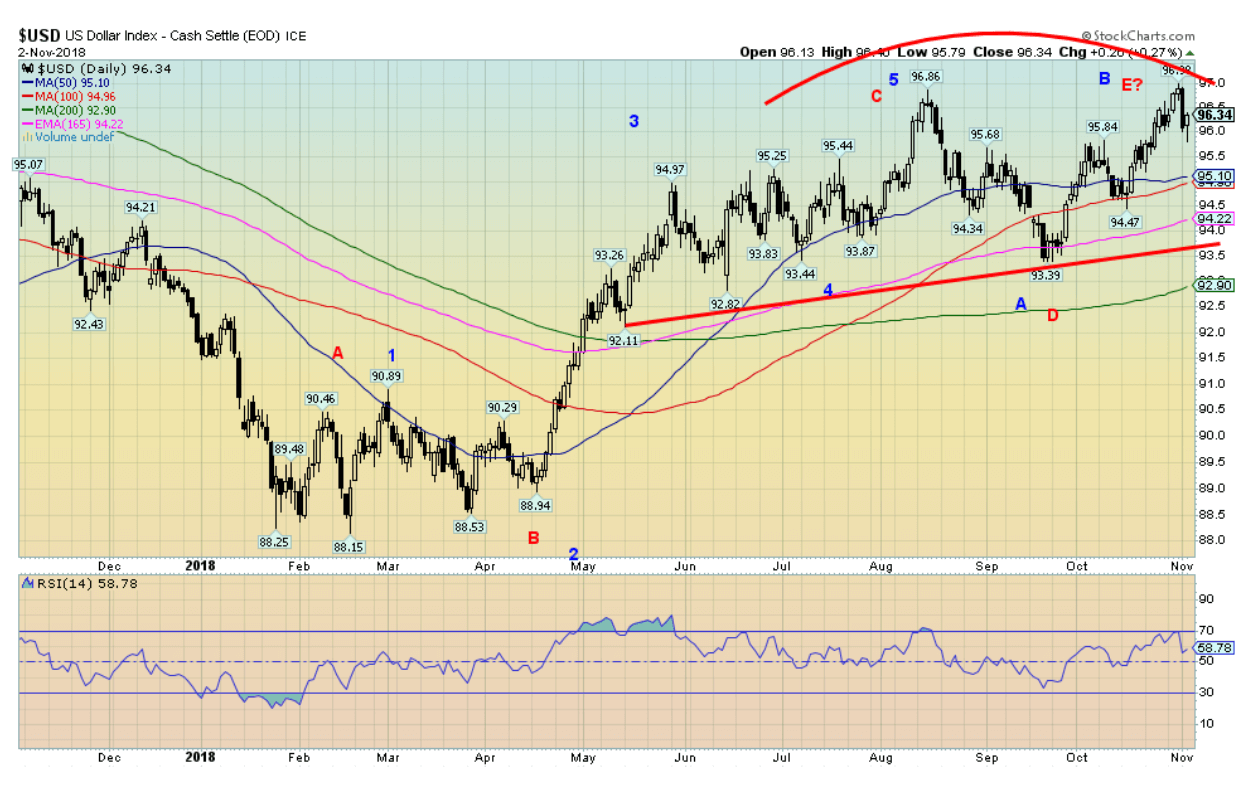
The US$ Index jumped to new highs this past week at 96.98, barely taking out the August high of 96.86. On November 1 the US$ Index plummeted on word that Trump was prepared to start a currency war with China. Indeed, the reports were all contradictory, as first they were negotiating a deal, and then they weren’t. U.S. dollar sentiment hit as high as 95 percent before the pullback on November 1. The last time sentiment was that high was back in August at the high. We have given the US$ Index two wave counts. In red is a count that suggests a five-wave corrective, labeled ABCDE. In blue is a more traditional wave count of 1-5 with the AB waves of the corrective wave to the downside. We like our ABCDE count as many of the waves were irregular or in threes, suggesting a correction. If correct, this should complete the corrective wave that got under with the 88.15 low in February 2018. What’s key now will be a breakdown under 93.50. There is considerable support at 95 and down to 94. Only a strong move above 97 and especially above 98 could suggest to us that the US$ Index will test the January 2017 high of 103.82. We doubt that scenario.
© David Chapman
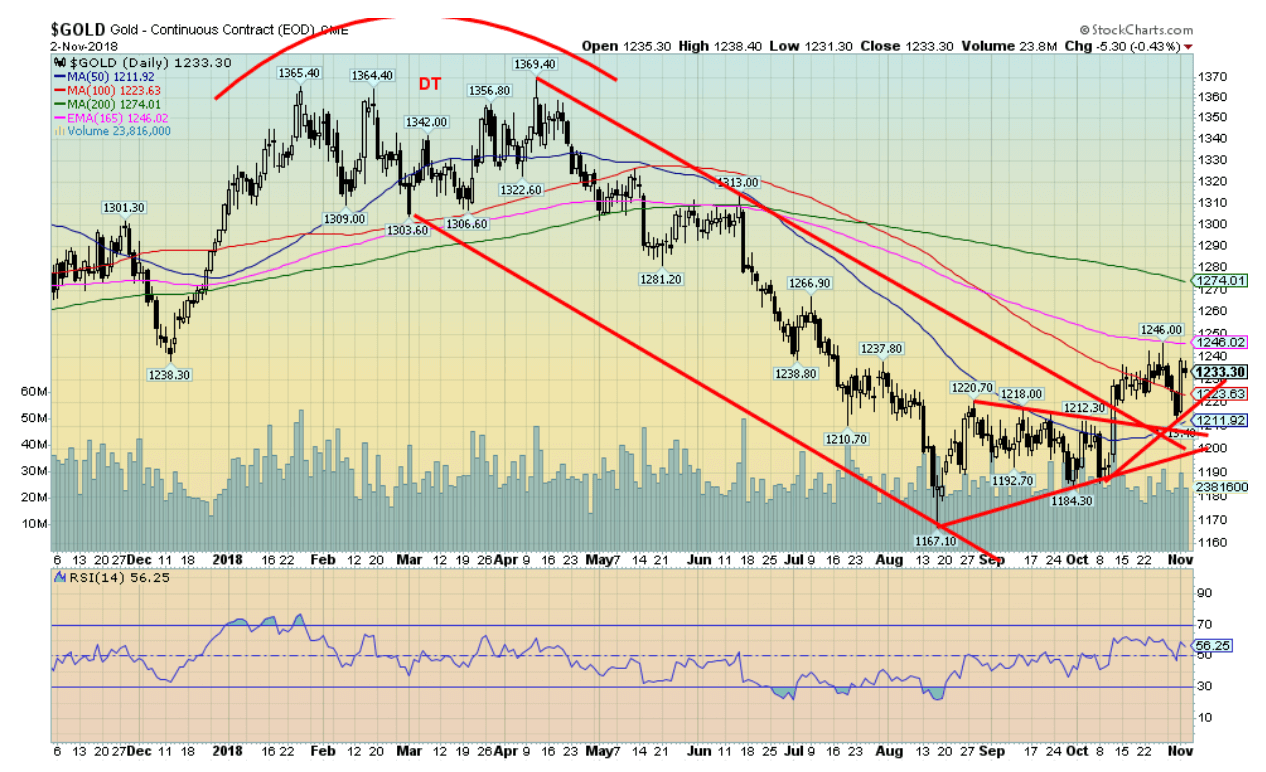
After falling swiftly in the early part of the week gold prices rebounded on Thursday following a down draft in the U.S. dollar as Donald Trump suggested currency wars with China. Despite the sharp up move on Thursday gold ended the week off a small 0.2 percent. Silver gained 0.4 percent. However, the big star of the week was platinum with a gain of almost 5 percent. Palladium prices also rebounded, up 1.7 percent. The strong job numbers on Friday helped propel copper prices higher to $2.81, a gain of 2.6 percent on the week. Gold successfully tested the recent breakout line near $1,210 before rebounding back over $1,230. The recent high remains at $1,246 and $1,250 is the next hurdle. Once over $1,250 gold should test the 200-day MA near $1,274 and up to $1,280. There is then a band of resistance ranging from $1,280 to $1,320 to overhaul before a serious attempt can be made on the highs near $1,370. The bullish scenario is in place as long as gold remains above $1,200. A breakdown under $1,200 could set up a move to new lows. Sentiment remains bearish while the commercial COT remains quite bullish.
© David Chapman
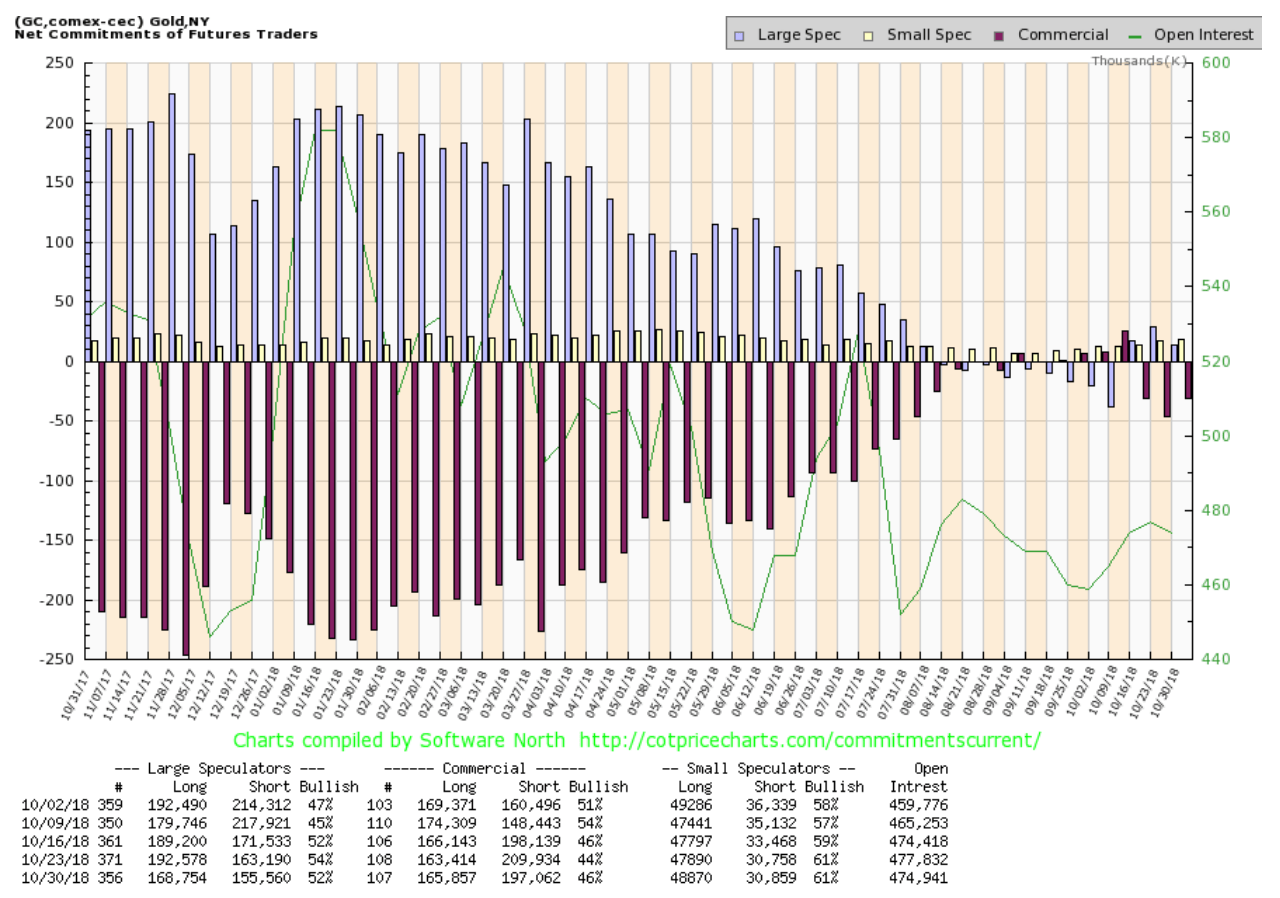
The commercial COT for gold improved this past week to 46 percent from 44 percent the previous week. The report overall remains quite bullish. Long open interest rose over 2,000 contracts while short open interest fell by almost 13,000 contracts. That suggests to us that the commercials used the previous week’s pullback to cover shorts while adding small to their longs. The large speculators COT (hedge funds, managed futures, etc.) slipped to 52 percent from 54 percent. The large speculators remain quite bearish by historical standards. This should continue to be supportive of gold prices going forward.
© David Chapman
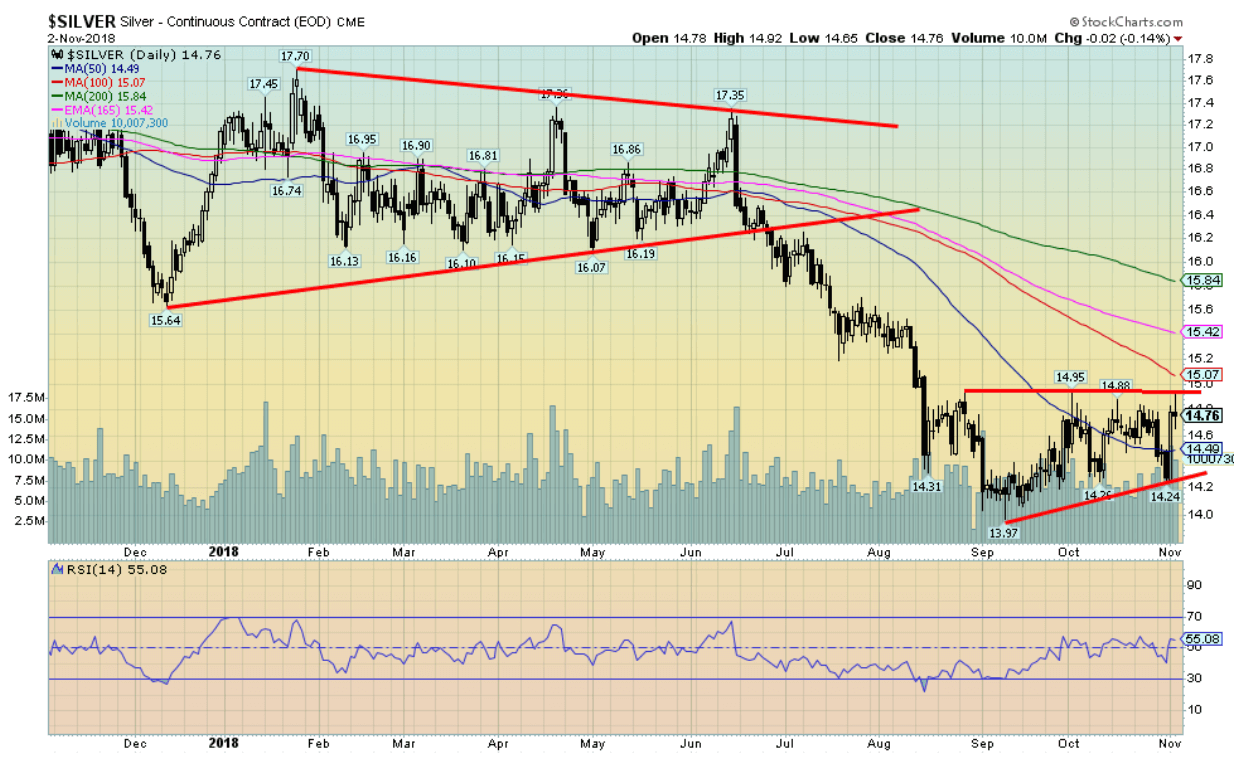
Silver prices jumped 0.4 percent this past week and are now at their highest close in weeks. The high Friday of $14.92 was just shy of the $14.95 seen back in late September. The pattern that has formed since the September low $13.97 continues to look bullish. A firm breakout above $15 could see silver run up to almost $16. There is resistance at $15.40/$15.50 and again at $15.85.This scenario holds as long as silver remains above $14.30 and preferably above $14.50. The bullish scenario breaks down under $14.25. A bullish commercial COT and weak sentiment should continue to be supportive of silver prices. Seasonals are also in its favour although, as with gold, the real move may not get underway until December.
© David Chapman
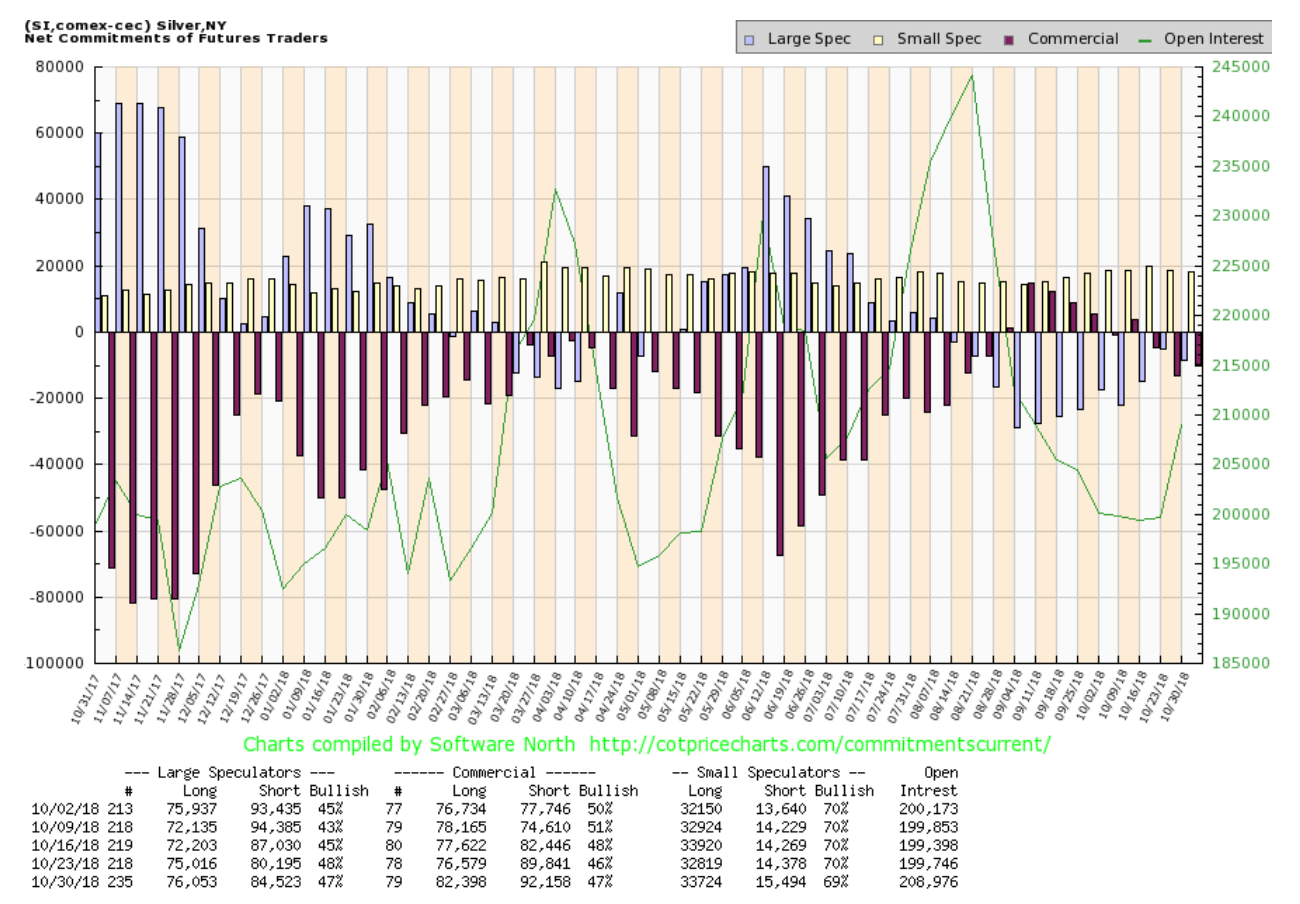
The silver commercial COT improved to 47 percent this past week from 46 percent. Long open interest rose roughly 6,000 contracts even as short open interest jumped just over 2,000 contracts. The large speculators COT slipped to 47 percent from 48 percent as they mostly added to their shorts up over 4,000 contracts. The silver commercial COT remains quite bullish.
© David Chapman
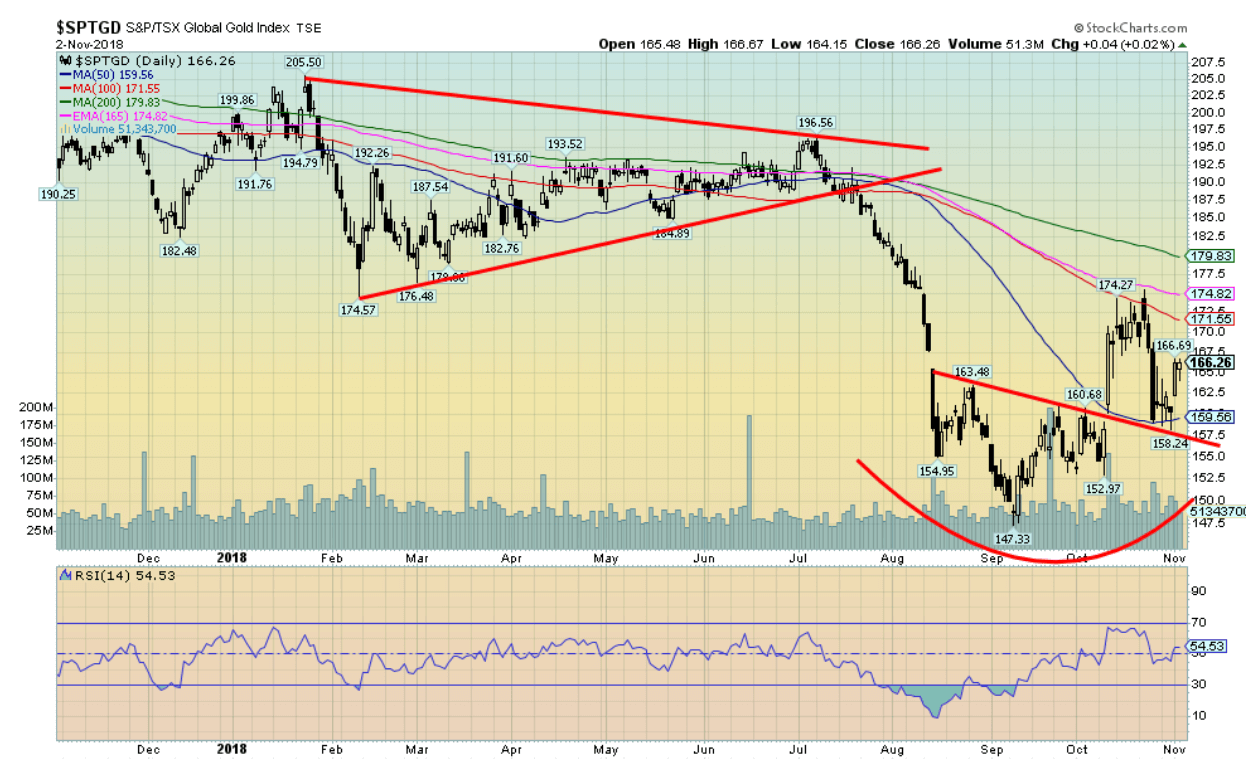
Despite gold and silver not gaining much this past week, it didn’t stop the gold stocks. The TSX Gold Index (TGD) was up 3.2 percent while the Gold Bugs Index (HUI) jumped 3.3 percent. Granted, given the down swoop they suffered the previous week, some sort of bounce may have been inevitable. The rebound this week recouped roughly half of what was lost the previous week. What was impressive is that the TGD bounced nicely off of the 50-day MA and tested the neckline of what may have been a small head and shoulders bottom pattern. The small H&S pattern had projections up to at least 174. That level was achieved with the first upward thrust. A move above the recent highs near 174.80 could send the TGD to its next target near 184. That still leaves us a fair distance from the 2018 near 205 and the most recent high in June near 195. So, there is still a lot of work to be done. The uptrend scenario continues as long as the TGD remains above 158. Below 153, new lows are probable. The rally thus far cannot be described as strong. However, we doubt strong buying will come in until we at least start taking out 195/205. The gold stocks have been gross underperformers so they are not yet attracting sufficient attention from the funds to justify buying them at this stage.
© David Chapman
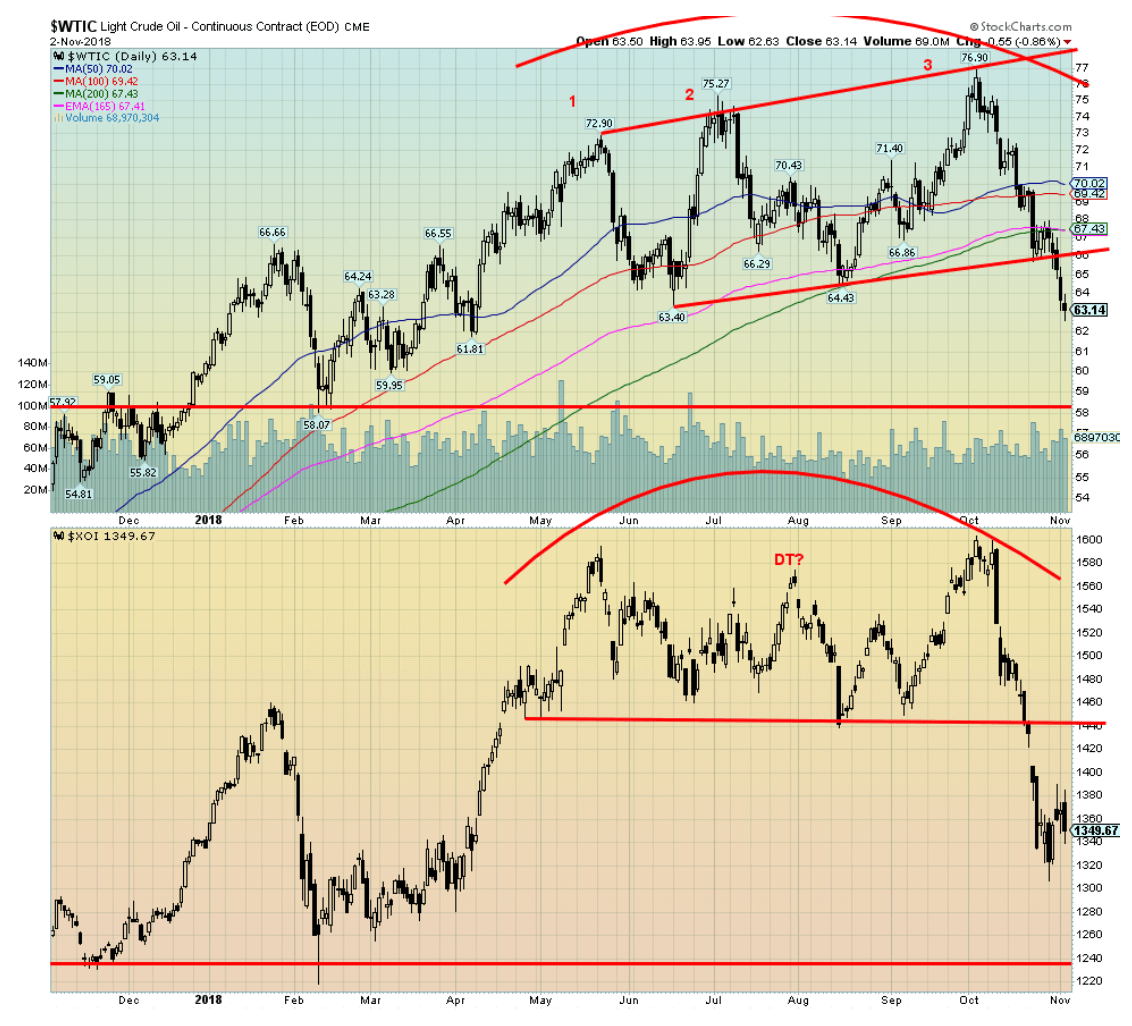
Philadelphia Oil & Gas Index (XOI) has also broken down. The target zone there appears to be around 1,300. With a low thus far of 1,307, the XOI may have already fulfilled its objectives. A firm breakdown under 1,300 could, however, send the XOI down to stronger support in the 1,240 zone. Certainly, the XOI is oversold, enough that a rebound rally could take place. One of the reasons holding WTI oil prices up was the potential for supply disruptions because of Iran sanctions from the U.S. However, the U.S. has agreed to exempt eight nations from sanctions. They will, as a result, continue to purchase Iranian oil. The group supposedly includes China, a major buyer of Iranian oil.
There is a band of support for WTI oil between $58 and $60, but under $58 the targets noted above are more likely. Regaining back above $70 would change the scenario and set up the potential for new highs.
Chart of the week
© David Chapman
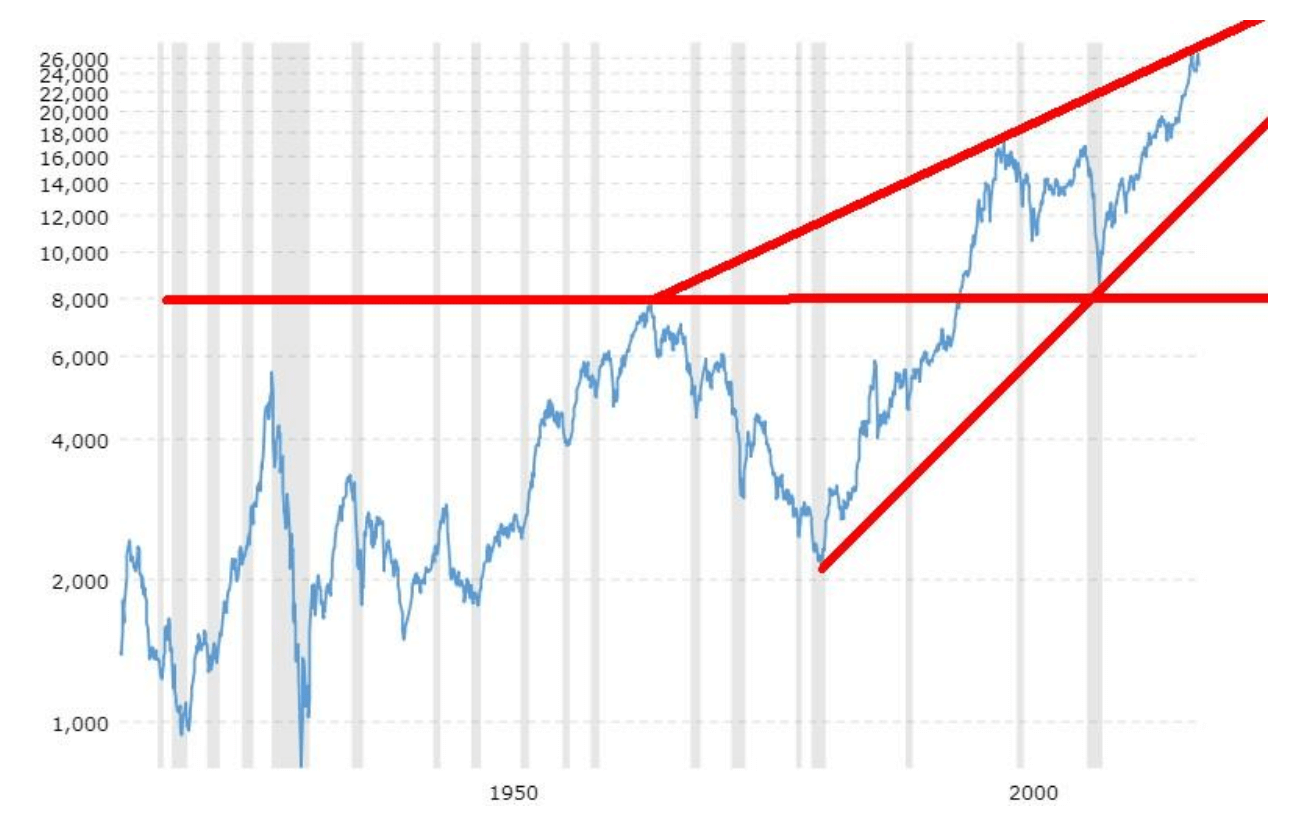
It is always interesting to look at an inflation-adjusted chart. In many respects it gives a truer picture of performance because it takes into consideration the ravages of inflation. On an inflation-adjusted basis, the Dow Jones Industrials (DJI) is up 180 percent from he March 2009 lows. On a nominal basis, the DJI has gained 234 percent. That remains a pretty solid performance. The DJI has hit all-time highs, both on a nominal and inflation-adjusted basis. Gold hasn’t been so lucky and remains down some 42 percent from its inflation adjusted high seen in January 1980.
What is interesting about the chart is that the DJI appears to be forming a huge ascending wedge up from the August 1982 low. On a nominal chart that is not obvious. The top line is drawn from the 1966 top. Given the long length of time it may be meaningless. But when it comes to patterns in technical analysis we have learned that time is not a necessary component for patterns. The DJI appears to have hit the top of the channel. The bottom of the channel is down around 14,000. Still, that would be healthy drop if the DJI fell to that level during the next major correction.
Over 100 years two major declines stand out: the Great Depression drop in 1929–1932 when the DJI fell 80 percent (89 percent in nominal terms) and in 1965–1982 when the DJI was down 73 percent. (In nominal terms the bottom was seen in 1974, not 1982, and the DJI was down 41 percent in nominal terms (close only)). In inflation-adjusted terms the decline into 1982 was more devastating as the DJI fell back to levels seen in the late 1930s and the 1940s. Something similar now would be to see the DJI fall back to inflation-adjusted levels seen in the 1970s.
The nominal chart of the DJI is shown below.
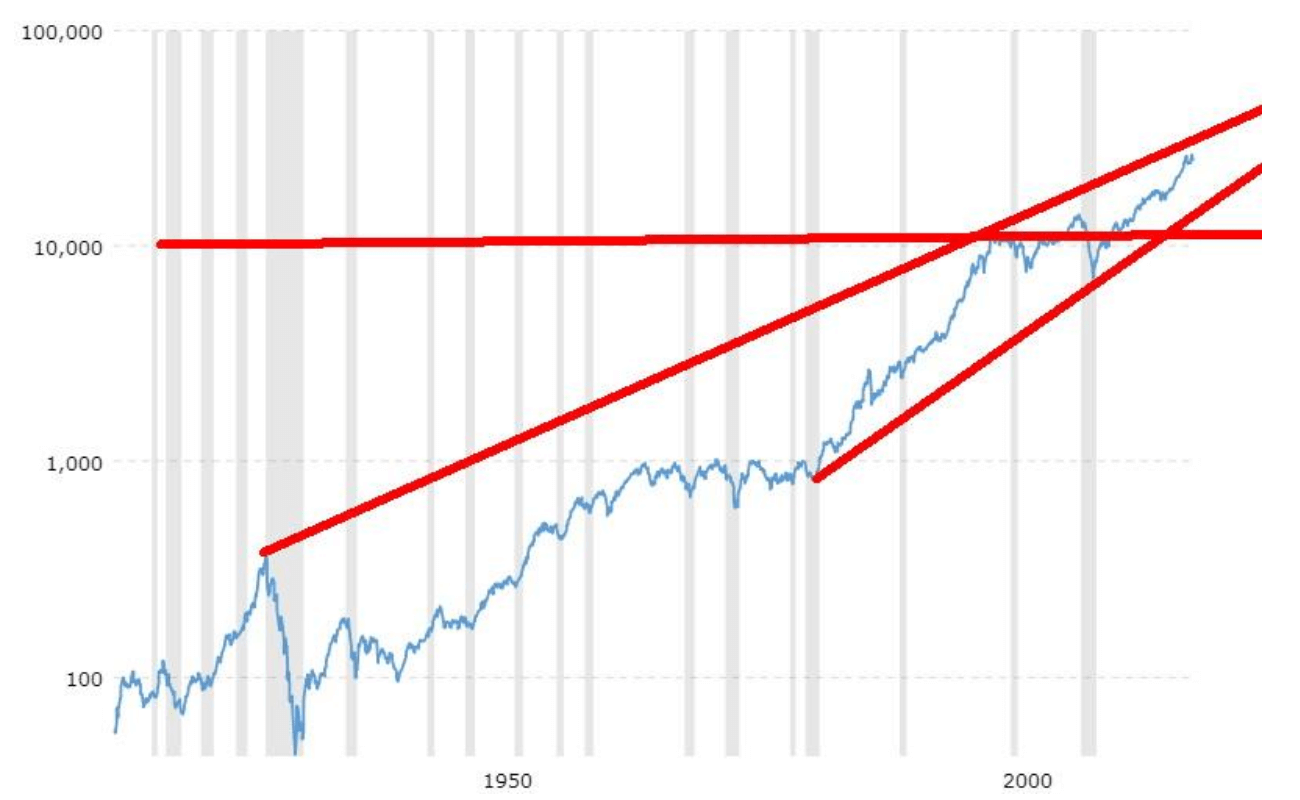
© David Chapman
—
DISCLAIMER: David Chapman is not a registered advisory service and is not an exempt market dealer (EMD) nor a licensed financial advisor. We do not and cannot give individualised market advice. David Chapman has worked in the financial industry for over 40 years including large financial corporations, banks, and investment dealers. The information in this newsletter is intended only for informational and educational purposes. It should not be considered a solicitation of an offer or sale of any security. The reader assumes all risk when trading in securities and David Chapman advises consulting a licensed professional financial advisor before proceeding with any trade or idea presented in this newsletter. We share our ideas and opinions for informational and educational purposes only and expect the reader to perform due diligence before considering a position in any security. That includes consulting with your own licensed professional financial advisor.


Graph Therapeutics Secures $5M to Advance AI-Driven Precision Therapies
Biotechnology company Graph Therapeutics raised 5 million dollars in a funding round led by Daphni, with support from existing investors....


DEA Hearing Signals Historic Turning Point for U.S. Cannabis Policy
The DEA has begun a key hearing on reclassifying cannabis from Schedule I to Schedule III, following a recommendation from...


Italy Leads Europe in Digital Sustainability Reporting for SMEs, EFRAG Finds
Italy leads Europe in digital sustainability reporting tools for SMEs, according to EFRAG’s second mapping of VSME platforms. The ecosystem...


RLUSD Launch in Japan Amid XRP Price Decline and Uncertain Outlook
Ripple and SBI launched the RLUSD stablecoin in Japan after JFSA approval, signaling strong progress in tokenization. However, XRP fell...


Youth Cannabis Use in Colorado Is Falling — But the Full Story Is More Complex
The 2026 Colorado survey shows teen cannabis use fell to 10 percent in 2025, down from 21 percent in 2015....
 |
|
 |  |
 |
|
-

 Impact Investing1 week ago
Coastal Cities Lead as Heat Strains Italy’s Urban Livability
-

 Fintech2 weeks ago
Trade Republic Brings Back Human Support and Launches Customer Council
-

 Biotech4 days ago
Eli Lilly Hits $1 Trillion Valuation Amid Strong Bullish Momentum
-

 Africa1 week ago
Moroccan Bond Market Shows Mixed Signals as Primary Eases and Secondary Pressures Persist
You must be logged in to post a comment Login