Featured
Our ‘Chart of the Week’ looks at Bitcoin and the new star of the crypto market – Dogecoin
Inflation is on the lips of many market participants who seem to be expecting a repeat of the 1970’s or that we will become Venezuela. Their fear is totally misplaced. We look at inflation and compare it to other rounds of inflation. We also note how inflation negatively impacts currencies and the importance of holding some gold, an inflation hedge.

“The biggest ‘inflation scare’ in 40 years is coming—what stock market investors need to know.” So screamed an April 10, 2021 headline of MarketWatch (https://www.marketwatch.com/story/the-biggest-inflation-scare-in-40-years-is-coming-what-stock-market-investors-need-to-know-11617846712). No, we are not trying to center out a MarketWatch opinion piece but we have seen more than a few of these types of headlines recently. So, is it hype meant to scare the living “bejesus” out of us? Or merely hyperbole, an exaggeration not meant to be taken literally?
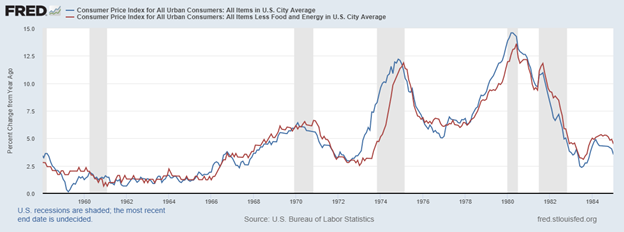
We can only guess that the biggest inflation scare in 40 years is referring back to the 1970s. Except that was more like 50 years ago. The 1980s were deflationary except for a spike towards the end of the decade that came nowhere near the levels seen in the 1970s. The 1970s inflation was sparked by a number of events: the easy monetary policy of the Federal Reserve to generate economic growth and combat growing unemployment as the 1970s recessions took hold; the abandonment of the gold window in 1971, sparking a long decline in the value of the U.S. dollar; the 1970s oil crisis, sparked by the Arab oil embargo 1973–1974 and the Iranian hostage crisis and revolution 1979-1981; the huge expenditures to finance the Vietnam War 1955–1975; plus, huge public expenditures to create the “Great Society” launched by then-president Lyndon Johnson 1964–1965 designed to combat poverty and racial injustice, reduce crime, and improve the environment. Does it all sound familiar?
The great inflation of the 1970s ended when Fed Chairman Paul Volker hiked the key lending rate to nearly 20% by 1981. That helped spark the steep recession of 1980–1982, but it also helped spark the stock market rally that got underway in August 1982, ending 16 years of a stock market bear from 1966–1982. Gold and commodities that had benefited from the huge inflationary run-up in the 1970s crashed and burned in the 1980s with gold collapsing from $875 to $250 and oil prices falling from $40 to $10.
Consumer Price Index for Urban Consumers
Headline and Core Year-Over-Year 1958-1985
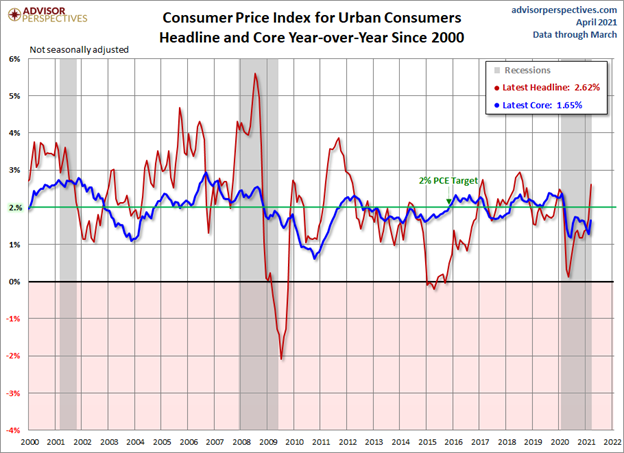
Inflation expectations are rising. And that might be considered normal as we (hopefully) come out of the COVID recession. But even the most optimistic forecasts suggest it could be years before we return to pre-COVID economy. Inflation jumped coming out of the 2007–2009 recession as well but it also quickly petered out. The Great Recession of 2007–2009 unleashed quantitative easing on a massive scale in the U.S., the EU, and Japan. The EU and Japan soon moved to negative interest rates and in the process have effectively wiped out their bond markets. German 10-year bunds are currently negative 0.30% while Japanese 10-year bonds (JGBs) are 0.10% and have gone through periods of negative yields. No wonder funds flow to the higher yields available in the U.S., putting upward pressure on the U.S. dollar.
Despite years of quantitative easing and massive debt growth, inflation has remained largely dormant in the U.S./Canada (current 2.6% U.S., Canada 1.1%), the EU (current 1.3%), Japan (current negative 0.4%), United Kingdom (current 0.4%), and Australia (current 0.9%). Those rates are the CPI whereas most central banks focus primarily on the core inflation rate ex the volatile food and energy components. We are seeing a rise in commodity prices which is not due to demand but instead to shortages. Many, including ourselves, believe we are in the early stages of a new commodity cycle.
Many companies will resist raising prices for as long as they can primarily because demand is weak and, despite forecasts, strong demand may be slow to return given the damage done by the COVID recession to expectations. China s an exception to demand. Already shortages of lumber and copper are pushing prices higher particularly for the housing market. Wages are stagnant as the only real growth in wages is being seen at the top, mostly accruing to the 1%.
The question, of course, is: will caution continue to dominate or will consumers really go on a spending spree, sparking further improvements in the unemployment rate and economic growth and by extension an uptick in inflation? Already the unemployment rate has come down faster than many predicted (peak 14.8%, current 6.0%) but then so has the participation rate (63.4% January 2020 to 61.5% March 2020). The decline in the labour force participation rate means in the U.S. that upwards of 4 million have dropped out of the labour force. Many have dropped out not because they don’t want work but because they can’t find work and they don’t believe there is work there. The current recession and resultant high unemployment have also sparked another round of technological upgrades that in many cases leads to needing fewer workers.
Consumer spending saw a big jump in March as retail sales leaped 9.8% annualized. That was well above the expected 5.9%. Year-over-year retail sales were up 27.7% as a result of the plunge in retail sales in March 2020. This was also well above expectations of 7.9%. This may be a one-off spike and will smooth out in future releases. There were a few large spikes out of the 2007–2009 recession as well that settled down to lower levels later.
The Fed’s focus is on the core inflation rate ex food and energy (current target 2%). The core inflation did rise to 1.6% in March from 1.28% in February. But recall that back in February 2020 the core rate had risen to 2.36%. The Fed is on record saying they are willing to allow the core rate to rise to 2.5% before considering any action. We could get there quickly as many have underestimated recent improvements in unemployment or even GDP. If the labour market keeps improving it could heat up inflation sooner rather than later. The Biden administration is prepared to unleash a further package of $1.9 trillion for infrastructure to improve the employment situation. But that package is not a sure thing, given the opposition in the Senate. The question is one of jobs over more debt. The Biden administration has said it will be paid for with corporate and wealth tax hikes, most likely eliminating some of the huge tax cuts seen under the Trump administration.
We are more concerned about the huge amount of corporate and household debt in both Canada and the U.S. than the government debt. Government debt can be monetized as the Fed and the BofC purchase the bond issues of the government. The collapse of Archegos Capital, as we have noted, could be a warning of situations where the effects are not really seen for months as other problems in hedge funds and other large pools of funds arise. Debt collapse is ultimately deflationary, not inflationary. Thoughts about raising interest rates are just that, thoughts. In checking the 30-days Fed Funds futures there appears to be no pricing in of future rate increases even into 2022.
The Fed is well aware how fragile the economy is and a hike in interest rates could quickly put the economy back into recession, pandemic or no pandemic. There is a lot of economic uncertainty going forward. That doesn’t mean there shouldn’t be a concern about inflation, but there are ways to protect oneself. In the 1970s gold proved itself to be the ultimate inflation hedge.
We have often noted how gold can be a hedge against inflation. As well, gold is a hedge against devaluation of currencies. We have two charts below, one of which we have shown in the past.
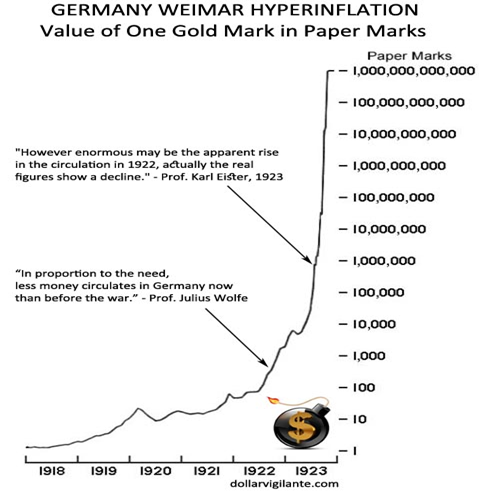
The Weimar Republic German hyperinflation is no doubt one of the most famous examples of hyperinflation run amok. Hyperinflation has been a part of history leading to the demise of numerous fiat currencies. A few of the more recent examples of hyperinflation have been in Zimbabwe, Argentina, and Venezuela. But the Weimar Republic hyperinflation may be the granddaddy. A loaf of bread in 1922 cost 163 marks. By November 1923 the same loaf of bread cost 200 billion marks. That’s billions, not millions, not thousands, but billions. Normal life is impossible. Something that was a mark in the morning may have cost thousands of marks in the afternoon. Money was worthless. But if one held gold marks their purchasing power was protected. Except the gold standard in Germany ended in August 1914 at the start of the war. Gold and silver coins ceased to circulate.
Why? Well, to help finance the war the German government had to print money. Lots of it. That came back to haunt them after the war given the massive reparations Germany was forced to pay as a result of the Treaty of Versailles 1919. The treaty demanded payment in gold marks as the Allies figured that German marks were worthless (they were right). Germany took out loans from New York banks to pay and then printed even more money. The money became increasingly worthless. The collapse of the Weimar Republic led directly to the rise of the Nazis.
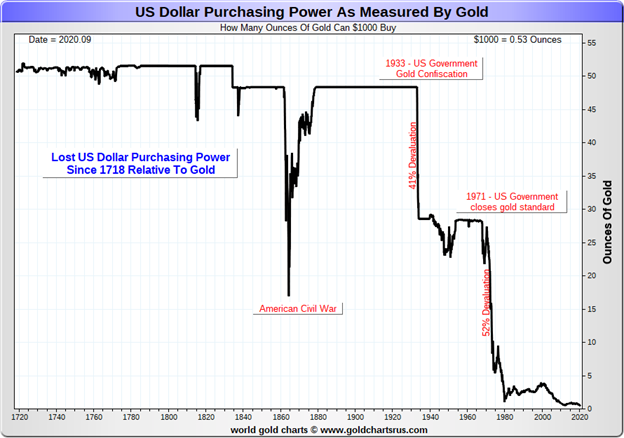
Even before the Western world embarked on a massive program of quantitative easing after the 2008 financial collapse, the value of the U.S. dollar priced in gold was declining sharply, especially following the end of the gold standard in August 1971. The chart above is the opposite of the Weimar Republic chart but then the Weimar Republic chart is showing the value of one gold mark in German marks whereas the gold/U.S. dollar chart is showing how many ounces of gold one can buy with $1,000. To put it in the same perspective, in August 1971 one gold ounce would purchase $42.73 of goods. Today one gold ounce would purchase you $1,760 or goods, an increase of over 4,000%. The devaluation of the U.S. dollar has been a lot slower than that of the German mark, having taken 50 years to get there whereas the German mark hit the 4,000% point by 1923, a mere five years later.
With savings being crushed given ultra-low interest rates, the money flows into stocks, collectibles, housing, land, and these days Bitcoin—and maybe even gold will have its run as well. That has largely benefited the few at the expense of vast majority of society. No wonder we have seen the rise of populous political movements as inequality grows. The rise of extreme right-wing parties in particular has been prevalent in the EU and the U.S., and to a lesser extent Canada, U.K., Australia, and Japan.
None of this is to say that the current round of inflation is going to lead to hyperinflation. As we have noted previously, if massive money printing, a huge rise in government debt, and extremely high government debt to GDP were a major inflationary problem, then Japan today should be resembling Zimbabwe or Venezuela. Instead, inflation, if it even exists, is negligible, primarily because the BOJ is purchasing the bulk of debt as is now the Fed and the BofC.
Inflation is rising, but will it turn into hyperinflation as some expect? Whether it does or not, holding some gold—physical gold, that is, not paper gold—is probably a wise idea. Greenspan had it right.
The Pandemic Rages On!
As the third wave rages the numbers are becoming astounding. In the dip following the second wave the 7-day average fell to just over 366 thousand cases daily. Deaths were an average of about 8,500 daily. Now it is over 738 thousand daily for cases and 11,500 dead daily. For cases that average is now higher than it was at the peak of the second wave. Deaths still lag but are catching up. Recently we have had days of over 800,000 case. But the leadership has changed. Before it was the U.S. Now it is India who is averaging well over 200,000 cases daily and that’s probably undercounted. India has leaped into second place in cases but Brazil still has a strong hold in second place for deaths. The third wave has seen numbers in most countries soar. Except the U.S. which led previous waves they have fallen to number 3 behind India and Brazil. Still high but down sharply from the peak. Canada has seen a huge surge as well but overall Canada’s cases per million (83rd) and deaths per million (62nd) put them well down the line. Canada sits 23rd in terms of total cases and 25th in deaths. This past week the world passed 140 million cases and 3 million deaths. About 2% of the world has contracted the virus while roughly 2% of the cases end in death. However, the number of cases is most likely being underreported especially in third world countries. That would translate into deaths also being underreported. Still, there are variances from country to country. In the U.S. almost 10% of the population has contracted the disease and 1.8% of the cases has translated into deaths. In Canada only about 3% of the population has contracted the disease and of that just over 2% of the cases have resulted in deaths.
Sunday April 18, 2021 – 13:40 GMT
World
Number of cases: 141,431,385
Number of deaths: 3,026,506
U.S.A.
Number of cases: 32,361,280
Number of deaths: 580,756
Canada
Number of cases: 1,113,907
Number of deaths: 23,591
Source: www.worldometers.info/coronavirus
Chart of the Week
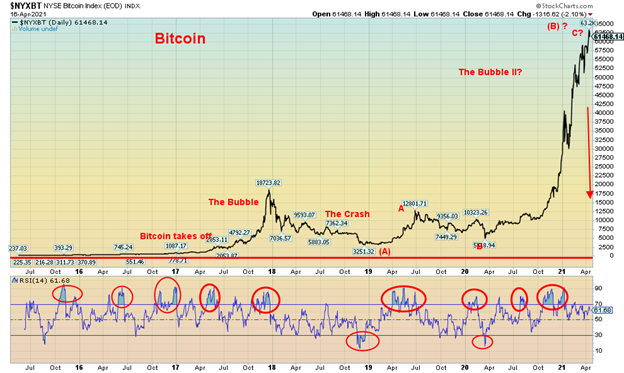
Up, up and away! My beautiful, my beautiful Bitcoin (BTC). For we can, fly we can fly (with apologies to Jimmy Webb and The Fifth Dimension). Is this a bubble? Or is this for real? And then there is Dogecoin.
Bitcoin has now soared through $60,000 up 118% on the year and over 1,800% from the low in December 2018. That’s a lot, but it still leaves it well short of former historic bubbles like Bre-X Minerals that rose 13,305% or even the famous tulip bubble in the 1600s that went up 5,900% before it crashed and burned. By comparison, the Dow Jones Industrials (DJI) bubble of the “Roaring Twenties” went up only 497%. Oh yes, and the S&P 500 is now surpassing that up from the financial crisis low of March 2009.
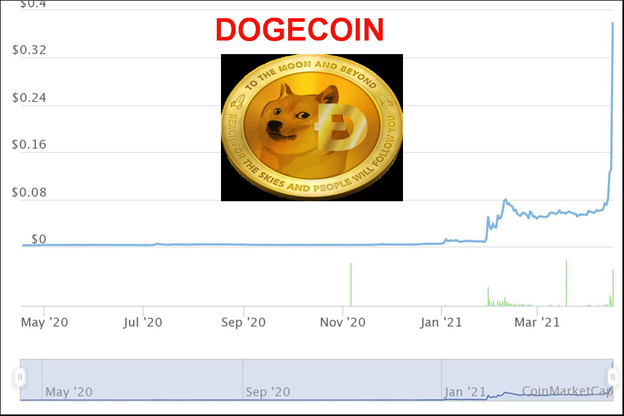
Bitcoin soared over 18,000% from 2013 to the peak in December 2017 before crashing about 83% over the next year. It was from that low that the current bubble got underway. But is it a bubble? According to some, no. The argument is that those calling it a bubble don’t understand what Bitcoin is or means. How does one value Bitcoin or any of the cryptos for that matter? Bitcoin is in limited supply with only 18,683,231 BTCs available and the rollout of more supply of Bitcoin is very, very slow. Compare that with the 129,196,123,052 Dogecoin (DOGE) supply. Yes, that’s 129.2 billion Dogecoins. Yet Dogecoin appears to be in its own bubble, having soared 515% since April 1.
What you say, Dogecoin? Something that was created, it seems, as a bit of a lark, as a satire about the proliferation of dubious crypto coins. But it is also billed as a payment system that is instant, fun, and free from traditional banking fees. Its logo is the face of the Shibu Inu dog, a hunting dog breed from Japan. Its price is now around 37 cents, up from 6 cents on April 1 giving it a mind-boggling market cap of nearly $48.0 billion. That’s bigger than many companies. That would rank Dogecoin around 458 of the largest 500 companies in the U.S., about equivalent to Huntington Bancshares (HBAN). Dogecoin now ranks number 11 out of over 9,000 cryptos listed at Coin Market Cap (www.coinmarketcap.com).
Bitcoin’s market cap is currently around $1.2 trillion, representing about 53% of the entire crypto market. That would rank Bitcoin number 5 amongst the U.S.’s largest companies by market cap, ahead of luminaries such as Facebook (FB), Tesla (TSLA), and Berkshire Hathaway (BRK.A). Almost 100 cryptos have a market cap of $1 billion or more. But some say this is not a bubble.
Whether it is a bubble or not, there is the old adage of what goes up really fast comes down even faster. Some of the latest wild action in the cryptos seems to have coincided with the introduction of Coinbase (COIN). Coinbase is the largest Bitcoin exchange in the U.S. and it has introduced a new way to invest in cryptocurrencies. Its introduction of the IPO created a trading frenzy. Coinbase was introduced at $381 on April 14 and quickly soared to a peak of $429 before settling down to around $338 by April 16. The Coinbase exchange has a market cap of currently of around $66 billion, making Coinbase larger than or about the same size as the NASDAQ exchange (market cap about $26 billion) and the Intercontinental Exchange (ICE), the parent of the NYSE (market cap about $67 billion).
Still when oodles of cash are being thrown at something as suspect as Dogecoin, something is amiss. COIN dropped after the initial flurry and we also learned that Turkey has banned cryptos, citing them as having the potential for irreparable damage and transaction risks. It doesn’t kill the crypto market in Turkey, but it puts a huge hole in its market. Could it spread elsewhere? Bubbles just keep going up until suddenly they don’t anymore. And no one rings a bell at the top.
Note: As we went to press Bitcoin had plunged over 10% to around $55,000 and Dogecoin also plunged seeing its market cap fall almost $9 billion from $48 billion to $39 billion.
MARKETS AND TRENDS
| % Gains (Losses) Trends | ||||||||
| Close Dec 31/20 | Close Apr 16/21 | Week | YTD | Daily (Short Term) | Weekly (Intermediate) | Monthly (Long Term) | ||
| Stock Market Indices | ||||||||
| S&P 500 | 3,756.07 | 4,185.47 (new highs) | 1.4% | 11.4% | up | up | up | |
| Dow Jones Industrials | 30,606.48 | 34,200.67 (new highs) | 1.2% | 11.7% | up | up | up | |
| Dow Jones Transports | 12,506.93 | 14,919.55 (new highs) | flat | 19.3% | up | up | up | |
| NASDAQ | 12,888.28 | 14,052.54 | 1.1% | 9.0% | up | up | up | |
| S&P/TSX Composite | 17,433.36 | 19,351.32 (new highs) | 0.6% | 11.0% | up | up | up | |
| S&P/TSX Venture (CDNX) | 875.36 | 944.46 | (1.6)% | 7.9% | down | up | up | |
| S&P 600 | 1,118.93 | 1,347.95 | 1.0% | 20.5% | up | up | up | |
| MSCI World Index | 2,140.71 | 2,304.30 (new highs) | 1.6% | 7.6% | up | up | up | |
| NYSE Bitcoin Index | 28,775.36 | 61,468.14 (new highs) | 5.4% | 113.6% | up | up | up | |
| Gold Mining Stock Indices | ||||||||
| Gold Bugs Index (HUI) | 299.64 | 292.05 | 3.2% | (2.5)% | up | down | up | |
| TSX Gold Index (TGD) | 315.29 | 312.70 | 3.6% | (0.8)% | up | down | up | |
| Fixed Income Yields/Spreads | ||||||||
| U.S. 10-Year Treasury Bond yield | 0.91 | 1.66% | (0.6)% | 82.4% | ||||
| Cdn. 10-Year Bond CGB yield | 0.68 | 1.50% | (0.7)% | 120.6% | ||||
| Recession Watch Spreads | ||||||||
| U.S. 2-year 10-year Treasury spread | 0.79 | 1.50% | (0.7)% | 89.9% | ||||
| Cdn 2-year 10-year CGB spread | 0.48 | 1.25% | (2.3)% | 160.4% | ||||
| Currencies | ||||||||
| US$ Index | 89.89 | 91.54 | (0.7)% | 1.8% | neutral | neutral | down | |
| Canadian $ | 0.7830 | 0.8000 | 0.2% | 2.1% | up | up | up | |
| Euro | 122.39 | 119.82 | 0.7% | (2.1)% | up (weak) | neutral | up | |
| Swiss Franc | 113.14 | 108.71 | 0.5% | (3.9)% | up (weak) | down | up | |
| British Pound | 136.72 | 138.39 | 1.0% | 1.2% | down (weak) | up | up | |
| Japanese Yen | 96.87 | 91.92 | 0.8% | (5.1)% | Neutral | down | down | |
| Precious Metals | ||||||||
| Gold | 1,895.10 | 1,780.20 | 2.0% | (6.1)% | up | down | up | |
| Silver | 26.41 | 26.10 | 3.0% | (1.2)% | neutral | neutral | up | |
| Platinum | 1,079.20 | 1,208.70 | flat | 12.0% | neutral | up | up | |
| Base Metals | ||||||||
| Palladium | 2,453.80 | 2,776.80 (new highs) | 5.2% | 13.2% | up | up | up | |
| Copper | 3.52 | 4.17 | 3.2% | 18.5% | up | up | up | |
| Energy | ||||||||
| WTI Oil | 48.52 | 63.19 | 6.5% | 30.2% | up | up | up | |
| Natural Gas | 2.54 | 2.68 | 5.9% | 5.5% | neutral | neutral | neutral |
New highs/lows refer to new 52-week highs/lows and in some cases all-time highs.
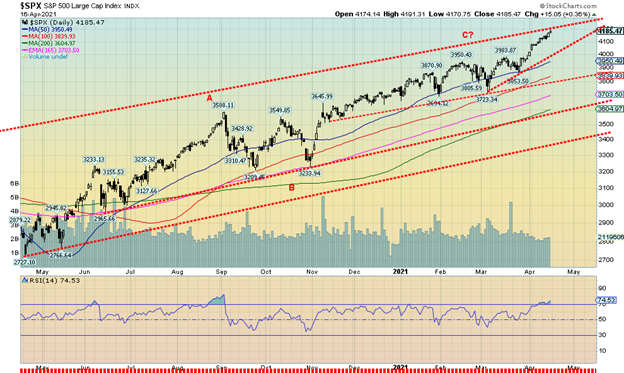
Onward and upward. What else can we say. Another week, another record high. But as we can see, the S&P 500 may be reaching its limit, given it is at the top of its bull channel. As well, the daily RSI is regularly over 70 (current 74.50) and so are the weekly (71.83) and the monthly (73.64). All three time periods are screaming caution, overbought. But being that way is merely a state as it doesn’t tell us when we will fall nor does it tell us how steep a fall might be. All it means is it is overbought and prudent investors may wish to take some profits.
This past week the S&P 500 gained 1.4%, the Dow Jones Industrials (DJI) was up 1.2%, and the Dow Jones Transportations (DJT) was flat while the NASDAQ rose 1.1%. The NASDAQ did not make new all-time highs but the DJI and the DJT did. A divergence. The S&P 600 small cap gained 1.0% but did not make new all-time highs. The S&P 500 equal weight index also made new all-time highs, up 1.4%.
In Canada the TSX Composite made new all-time highs, up 0.6% but the TSX Venture Exchange (CDNX) lost 1.6%. The MSCI World Index gained 1.6% to new all-time highs and Bitcoin was up 5.4% to, again, new all-time highs. In the EU the London FTSE gained 0.4%, the Paris CAC 40 jumped 1.9%, and the German DAX was up 1.5%. Both the CAC and the DAX made new all-time highs. In Asia China’s Shanghai Index (SSEC) was down 0.7% while the Tokyo Nikkei Dow (TKN) lost 0.3%.
Banks reported big profits. Morgan Stanley lost something like $900 million as a result of Archegos Capital but still reported record profits and a gain of 150% in quarterly profits. Others such as Goldman, JP Morgan Chase, and Bank of America also reported stellar profits. It is the fourth straight week of gains for the major indices. Upbeat economic data also helped. Vaccines are getting into arms and restrictions are being eased. Even baseball games have real fans in the stands. Not cardboard ones. Will the malls be packed again? March saw a big jump in retail sales.
As well, dovish statements from the Fed helped and pledges to keep interest rates low into 2022 and even 2023 helped as well. Nothing it seems, can stop the train—not even high PEs and other fundamental indicators nor warning signs of the VIX, put/call ratios, and overbought technicals. Still, we’d be cautious from here as the market is getting a little frothy. We could still make a top here in April and pullback into May/June before a summer rally and possibly even more all-time highs. A pullback now would ease some of the overbought signals. Selective profit-taking or caution on buying could be the word.
Unless, of course, we see a technical breakdown. We could fall back to 3,950 and still remain in an uptrend. Major support is down to 3,600 and even if we pull back, we don’t believe we’ll fall that low. Unless there is a shock, say, like an even bigger Archegos. As we saw in 2008 or even March 2020 it is the shocks that change the dial and spark a potential panic. All we can do is to suggest caution. That is what the market is telling us.
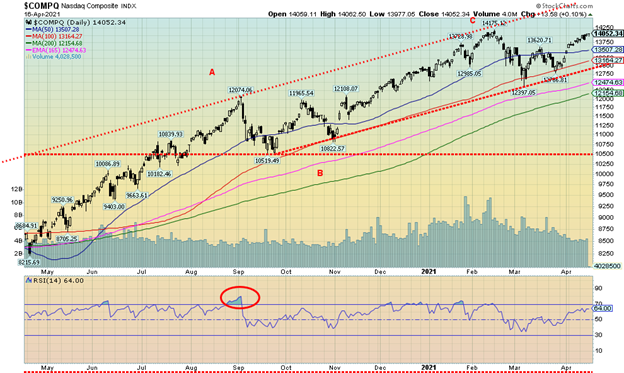
Is the NASDAQ our canary in the coal mine? The NASDAQ continues its recent run of no new all-time highs even as the S&P 500, the DJI, and DJT continue to set new all-time highs. A significant divergence. This past week the NASDAQ gained 1.1% but no new all-time high. The FAANGs and a few others were a mixed bag this week. Facebook fell 2% but Apple was up 0.9% and Amazon gained 0.8%. Then Netflix fell 1.6% but Google gained 0.5%. Amazon and Google made new all-time highs. As to others, Microsoft was up 1.9% to new all-time highs, Tesla gained 9.3% but no new all-time highs, while Twitter was down 1.5%. The value giant Berkshire Hathaway did make new all-time highs, gaining 2.3%. Value reigns, it seems. The NASDAQ continues to rise in its bull channel but it remains short of the top of the channel, up near 15,000. The all-time high was 14,175 and the NASDAQ is now only about 1% below that level. If the rally continues, we could be there next week and the NASDAQ’s divergence with the other indices would end. Support is down to 13,000 with interim support at 13,500.
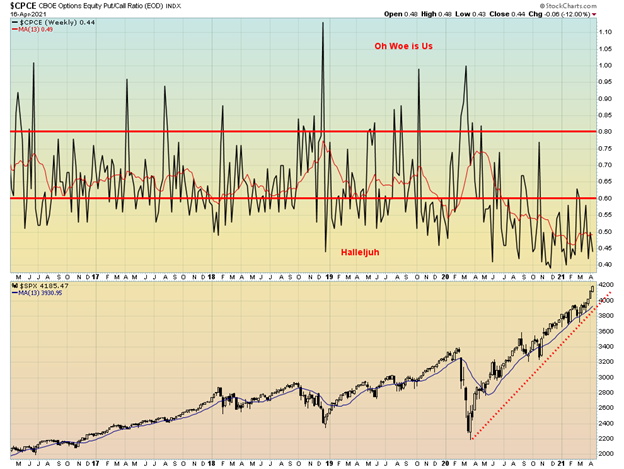
Onward and upward means optimism reigns for option traders. This past week the CBOE options put/call ratio fell to 0.44. That is still above the low we saw in December at 0.39, but we confess we never seen such a prolonged period of the put/call ratio remaining under 50. Oh, it has had an occasional foray above 0.50 but mostly it is below since June/July 2020. It is another sign of complacency in the market. But it doesn’t tell us when the market will top. It is an indicator to follow; it suggests caution but it doesn’t say we have topped.
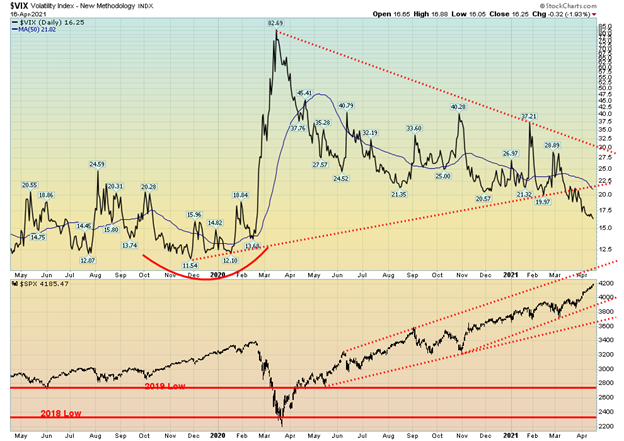
The VIX Volatility indicator continues its downward trend, falling this past week to 16.25. That is still above the lows seen in late 2019 when it hit just under 12.0. Still, it is signaling considerable optimism in the market and suggests that there is little fear in the current stock market. The VIX is a measurement of fear and greed, and right now it is suggesting greed. No, it is not a suggestion that the market is about to crack. It is a warning sign only. The VIX can stay low for some time before a correction or a crash occurs. The trend of the VIX is down so we don’t have a bottom. And it can have sudden turnups only to turn down once again. Note the action in 2019 where we fell to 12.07 in July then spiked to 24.59 in August followed by another decline to 11.54 in November. The VIX moves inversely to the stock market.
China GDP Annual Growth Rate
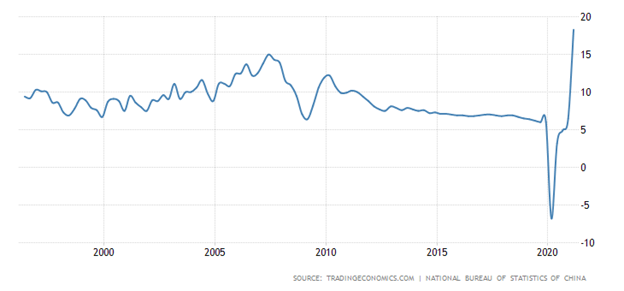
China’s growth surged in the latest quarter from March 2020 to March 2021 from 6.5% in Q4 2020 to 18.3% through Q1. The consensus was 19% so this was close. It was the strongest period of growth since 1992. Grant you, it was coming out of the hole that was Q1 2020 that saw China’s economy contract by 6.8%. So, it is coloured by that. The sharp growth was attributed to China’s strict shutdown for the COVID. To date China has seen just over 90 thousand cases and recorded 4,600 deaths. Most of that occurred in Q1 2020. After the strict lockdowns, the numbers plummeted. China continues strict quarantine measures to this day.
China’s success was premised on strong domestic and global demand along with continued fiscal and monetary support for the economy. Overall, China expects the economy to grow 6% in 2021 which would be in line with previous periods of growth. The 2020 growth rate was 2.3% as China was one of the few countries in the world that actually recorded GDP growth in 2020. For China though, it was the slowest in more than four decades.
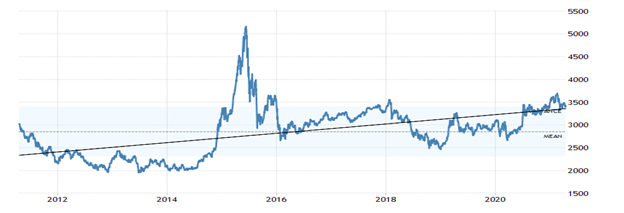
It hasn’t done much for China’s main stock index, the Shanghai Composite Stock Market (SSEC). Its all-time high was seen back in October 2007 at 6124. Today it is at 3426 some 44% below its highs.
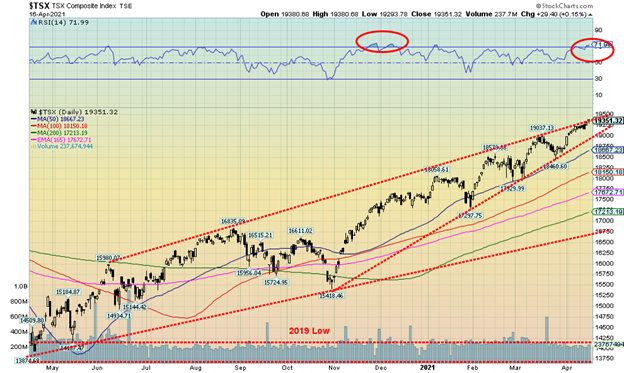
Another week, another all-time high for the TSX Composite. This past week the TSX jumped 0.6%. The TSX continues to climb higher in what appears to be an ascending wedge triangle. It even appears that it might break out, thus negating the bearish pattern. But that remains to be seen. The small cap TSX Venture Exchange (CDNX) didn’t fare as well as it fell 1.6% this past week. Last week we noted what might be a head and shoulders top for the junior exchange. That observation hasn’t changed.
Eight of the 14 sub-indices were up on the week. The leaders were Metals & Mining (TGM) +5.0%, Golds (TGD) +3.6%, and Materials (TMT) +3.4%. Of the six losers, the biggest was Health Care (THC) -6.0%. For most of the other losers—Income Trusts (TCM), Consumer Staples (TCS), Industrials (TIN), Information Technology (TKK), and Utilities (TUT)—the losses were small, under 0.5%. Four indices made new all-time highs: Income Trusts (TCM), Consumer Discretionary (TCD), Financials (TFS), and Real Estate (TRE).
As we note, the TSX appears to be rising in an ascending wedge pattern which is bearish. The bands are getting narrower so a resolution is coming soon, possibly as early as this coming week. A breakdown under 19,000 could, in theory, find the TSX falling eventually to targets down at 17,300 and even down to 17,000. There are areas of support along the way at 18,700, 18,100/18,200, and 17,700. Investors shouldn’t be too complacent in here. But like the U.S. markets, we don’t see a huge collapse coming even if May promises to be flat to down. The bullish surprise would be to see the TSX push up through 19,500; however, given the bearish-looking pattern, we are not optimistic that will happen at this time.
U.S. 10-year Treasury Bond/Canadian 10-year Government Bond (CGB)
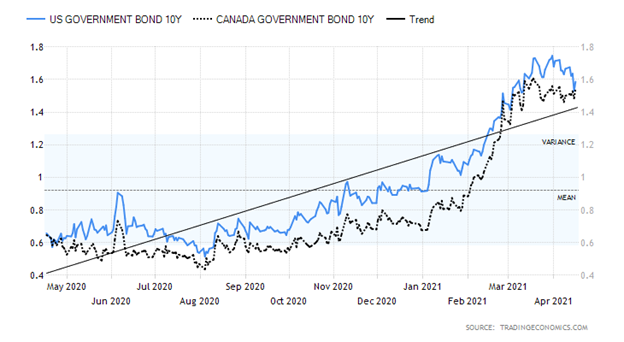
Have bond yields topped? We don’t believe that is the case, but the U.S. 10-year treasury note fell 7 bp on the week or 4.2% down to 1.59%. The Canadian 10-year Government of Canada bond (CGB) rose 4 bp to 1.54 or 2.7%. Spreads narrowed. Both the U.S. 10-year and the CGB rolled over this past week. All this came against the backdrop of some decent economic numbers suggesting the U.S. economy is improving. Consumer inflation expectations rose 3.2% in March, the highest level since 2014. The March CPI rose 0.6% and the year-over-year rate rose 2.6%. Ex the volatile food and energy, the core CPI rose 0.3% in March and year-over-year the core inflation rate was up 1.6%. While up, the core inflation rate remains well below the Fed target of 2.0%. They have indicated a willingness to see it rise to 2.5% before they might consider any action. Overall, the Fed remains dovish and, with bond yields falling, gold rose this past week despite the good economic numbers. Retail sales for March jumped 9.8% as things opened up, restrictions were eased, and vaccines went into arms. The market had expected a rise of 5.9%. Year-over-year retails sales were up 27.7%, but remember March 2020 numbers showed a contraction of about 20%. So, they were coming from a deep hole. That number will smooth out and fall as we go forward.
Weekly initial claims unexpectedly fell, coming in at 576,000 when the market expected 700,000. Last week initial claims were 769,000. The Philly Fed (manufacturing) Index 50.2% well above market expectations of 42%. Anything above 50% suggests expansion. Industrial production for March was up 1% but the market expected a contraction of 1.4%. Housing starts for March came in 1.739 million, well above the expected 1.613 million. The Michigan Consumer Sentiment Index preliminary for April was 86.5, but that was below expectations of 89.6. In February 2020 the index was above 100 but it is well above the 72-low recorded in April 2020.
If the interest rates are a harbinger, then falling yields suggest the bond market is not as optimistic about the economy going forward. But this is just one week. We’ll see if this decline has legs. As we note below, our breakdown point is at 1.40%.
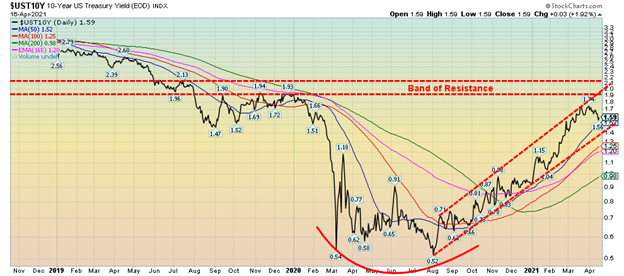
We thought we’d take a more technical look at the U.S. 10-year treasury note. The 10-year appears to have formed a bull channel, up from the all-time lows at 0.52% seen last August 2020. It has been a steady rise ever since. Since peaking at 1.74% back on March 31, the 10-year has turned down and is now slightly below 1.60%. The chart shows good support down to about 1.40. A breakdown would occur under 1.40% and tell us that the current rise in interest rates is most likely over. Confirmation would come under 1.20% and especially under 1.00%. Right now, we’d say the odds of even breaking 1.40% are low, given the 10-year remains in a solid uptrend. Major resistance doesn’t come until that band, up between 1.90% and 2.10%. That, we believe, is our ultimate destination. A major breakout over 2.10% would, however, suggest we are on our way to 3%. At this stage we don’t see that happening. For now, however, focus is below given we have turned down from the 1.70% area. Note the 1.70% to 1.90% area is a zone of congestion, given the trading seen back in August 2019 through December 2019 and even into January 2020.
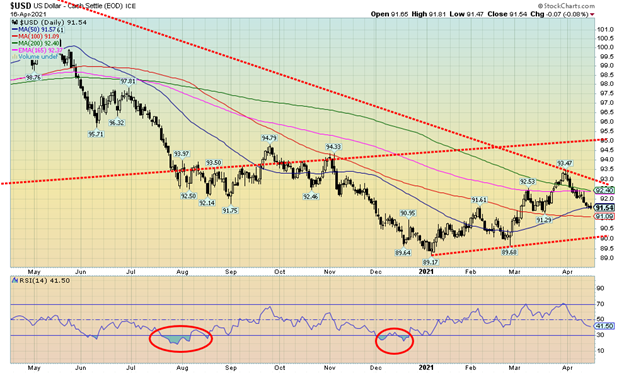
Has the US$ index topped? This week the US$ Index fell 0.7%. All the major currencies improved against the U.S. dollar as the euro was up 0.7%, the Swiss franc gained 0.5%, the pound sterling was up almost 1.0%, and the Japanese yen gained 0.8%. The Canadian dollar gained 0.2%, closing at 80 cents. The US$ Index’s next support is the March low of 91.29. The pattern forming could be a part of a potential head and shoulders top pattern so we’ll monitor that. If that’s correct, then the right shoulder needs to form and that could start this coming week. Resistance is up to 92.40 and, ideally, if a right shoulder is to form, we wouldn’t want to see the US$ Index rise above the left shoulder high of 92.53. Still, we can’t get too bearish on the U.S. dollar just yet. The March low of 91.29 needs to fall, we need to get below 91, and especially we would need to break down under 90 which is now major support.
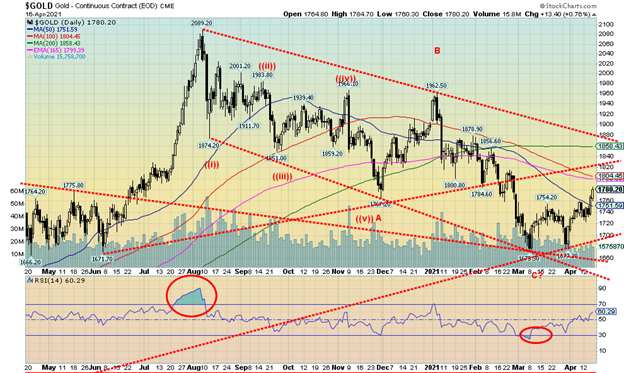
A lower US$ Index and lower bond yields helped propel gold prices higher by about 2.0% this past week, despite some good economic numbers. Gold put in its best week since December 2020. There was also a report that China was importing more gold. We know they have been surreptitiously increasing their central bank reserves. However, China usually remains “mum” about how much and analysts are left to speculate based on import/export numbers. Gold appears to have made a double bottom at $1,673 and $1,677 in March. This week we broke what may be the neckline of the double bottom at $1,755 on a rise in volume. The potential double bottom projects up to at least $1,835/$1,850. Gold broke above our $1,750/$1760 resistance zone as a result and that sets us on course for the next band of resistance between $1,800 and $1,825, with some interim resistance at $1,780. Support is down to $1,730 but we’d prefer we remain above $1,750 now. The daily RSI is at 60 so we have room to move higher before we become overbought. Still, following the breakout we’d wouldn’t be surprised at a bit of consolidation this coming week. Major resistance is up to $1,880 but above that level we firmly break the downtrend from the August 2020 high of $2,089. Above $1,900 and especially above $2,000 new highs are probable. We note that the pullback that took us to that low at $1,677 failed to pull the MACD down again and that was a positive sign. The weekly MACD is turning up but has not yet crossed to the upside. Ditto the monthly MACD remains down and is now just flattening out. We are encouraged by the action this week but remain cautious that this could be a countertrend rally. What’s key will be gold’s ability to regain above the 200-day MA ($1,856) and the downtrend line from August 2020 (currently near $1,880). A failure in our next resistance band between $1,800/$1,825 would not be the end of the world as we suspect it would set up a test of the lows in May or even June before a stronger rally gets underway in the second half of the year. Seasonals are still dampening into May/June which is another reason we don’t want to get too bullish just yet.
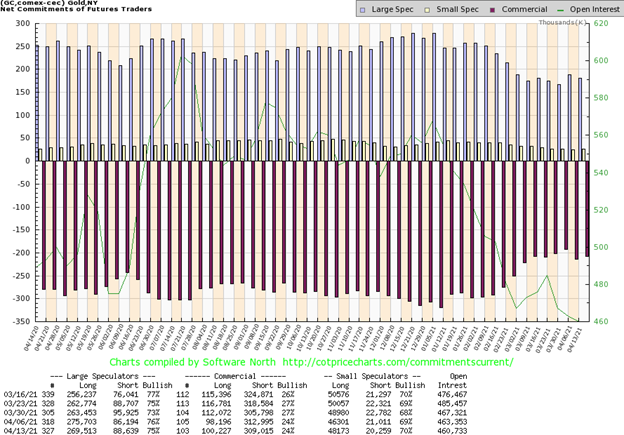
The gold commercial COT (bullion companies, bullion banks) was flat this past week at 24%. However, once again there was some optimism in the numbers. Long open interest rose about 2,000 contracts while short open interest fell almost 4,000 contracts. Despite that, it failed to move the dial on the overall %. Overall open interest was off about 2,600 contracts. That’s disappointing since gold was up 2.0% on the week and we prefer to see gold and open interest rising together. The large speculators COT (hedge funds, managed futures, etc.) slipped slightly to 75% as they shed over 6,000 longs while their short open interest rose about 2,400 contracts. Overall, however, we are pleased with this week’s COT if we wish to maintain our bullish stance. But it is still low under 25% and still down from just three weeks ago when it rose to 27%.
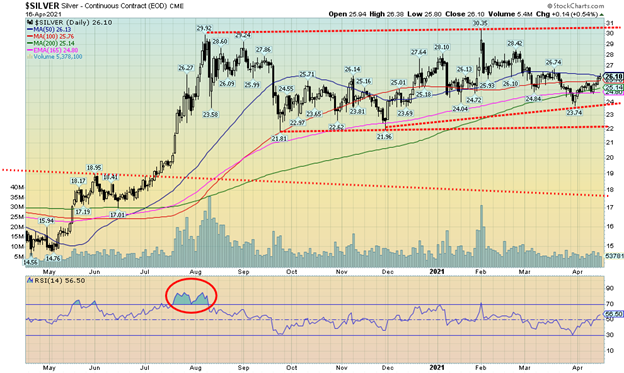
Silver prices surged this past week 3.0%, outpacing gold and doing almost as well as the gold stocks. Silver has now hit the 50-day MA ($26.13) which could prove to be the last major hurdle before a more significant breakout occurs. Support just under $25 held. The low on April 13 was $24.68 but no further significant selling developed and the market rallied. The daily MACD indicator has turned positive although the weekly remains negative. The monthly MACD has been generally pointed up since early 2016 and, while it wavered a few times in 2018/2019, it has turned solidly to the upside once again. Still, until we firmly break above the spike high seen February at $30.35, we are cautious. Silver breaks out further above $26.50/$26.75. Above that level sets us on a course towards $28/$28.50. Support, as noted, is now $24.75/$25.00. We would not want to see a breakdown under that level. An uptrend has been established. Trendline support can be found down to $25.15. We appear to have the making of a bottom, but we would like to see silver close above that $26.50/$26.75 to give us our confirmation that a low is in place.
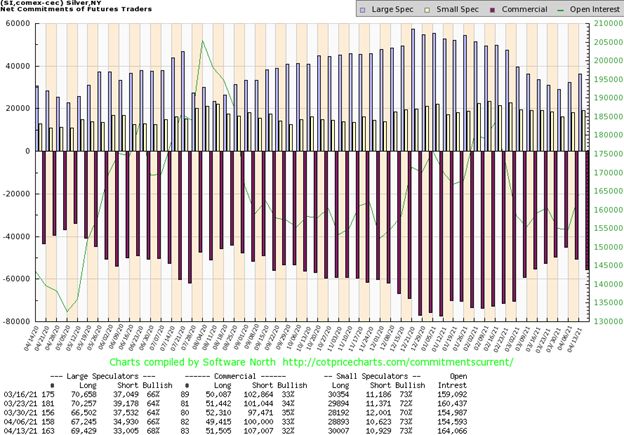
The silver commercial COT is giving off mixed signals here. The commercial COT slipped to 32% this past week, down from 33%. Short open interest rose roughly 7,000 contracts but long open interest was also up about 2,000 contracts. Still, shorts outstripped longs. The large speculators COT rose to 68% from 66%. Overall, open interest rose just under 10,000 contracts on a week that silver prices rose 3.0%. Rising open interest and rising prices means they are aligned despite the drop in the silver commercial COT. We remain encouraged but would prefer to see the commercial COT continue to improve to the 40% range to make us fell more bullish. Although it is not surprising that as prices, the commercials seem to get shorter.
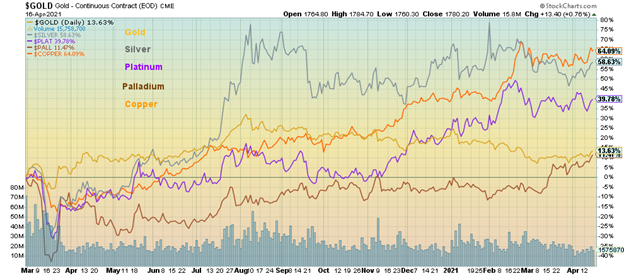
We are showing this chart to highlight how well copper has done since the pandemic crash of March 2020. Since March 2020 copper has led the way for the metals, up 64.1%. Silver follows at 58.6%, platinum is up about 40.0%, while gold +13.6% and palladium +11.5% lag the pack. This is having a significant impact on copper stocks. An example is Freeport McMoran (FCX), the world’s premier copper company who is up 424% from the March 2020 lows. Of late we have noted that juniors with copper projects are beginning to break out. Copper prices are now up to $4.17. The all-time high was $4.58 seen back in 2011. The prime reason for the rise is supply deficit not increased demand although demand is expected to rise by 5% in 2021 but supply is expected to rise only 2.3%. That differential could see copper move into supply deficits of some 200,000 metric tonnes in 2021. Surging demand in China is helping to push up prices. And warehouse supplies are low. If demand picks up outside China, copper prices could easily surpass the highs of 2011.
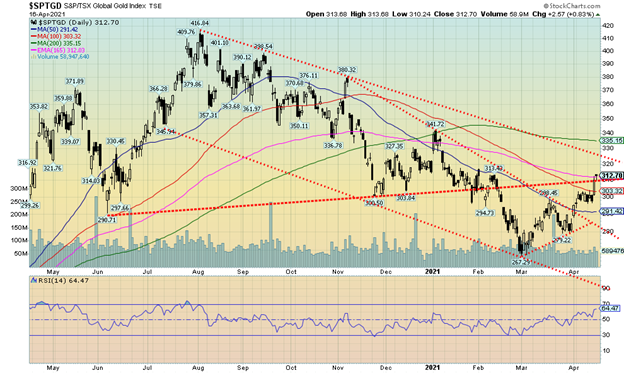
With gold stocks rising, seemingly outpacing gold itself, the market appears poised to move higher. This past week the TSX Gold Index (TGD) gained 3.6% while the Gold Bugs Index (HUI) was up 3.2%. This compares to gold’s rise of 2.0% and silver’s rise of 3.0%. If we are to have a bull market it is important that the gold stocks lead. The TGD is now up about 17% from the low seen in early March. The HUI is up 17.8%. Meanwhile, gold is up just over 6% from its low and silver is up about 10%. The TGD appears to be establishing an uptrend defined by higher highs and higher lows. Support is now down to 295 and 290. A break under 290 would be negative and a break under 280 would spell the end of the uptrend. However, the TGD hit an area of resistance around 310/312 this week so we might see a bit of consolidation going into this week. As long as we hold above 295, the uptrend should continue. Above 313 and especially above 318 we should start a move towards the 200-day MA currently at 335. Above 340 a more significant uptrend should be underway. The most recent high was in August 2020 at 416.84. That remains distant.
We are encouraged by the action of the gold stocks and we are reminded that, overall, the gold stocks remain cheap compared to gold. The Gold/HUI ratio is at 6.10, below recent highs at 7.09 but well above all-time lows seen at 1.6–2.0. The all-time high was seen at the lows of December 2015 when the ratio hit 10.90. Even during the March 2020 meltdown, the ratio leaped to 9.76 but came off quickly and has been generally falling ever since. The next key level to break is 5.30 as under that level an acceleration to the downside could get underway.
Gold mining companies have been reporting record revenues, earnings, and cash flow. Yet the stocks remain low compared to earlier periods. That suggests to us that we could see the gold stocks surge higher at some point if gold prices were to go over $2,000 once again.
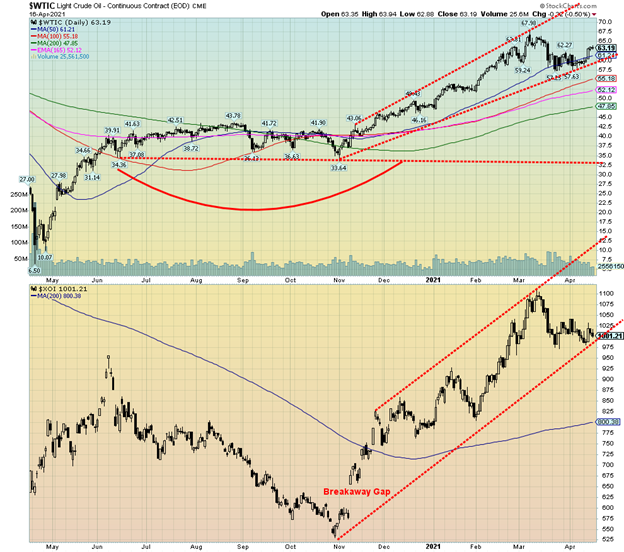
Surprisingly oil demand has picked up despite the recent rise in global COVID cases and despite travel restrictions remaining mostly in place. This past week WTI oil rose 6.5% while natural gas (NG) was up 5.9%. The energy indices were up but nothing to get excited about as the ARCA Oil & Gas Index (XOI) was up 0.4% and the TSX Energy Index (TEN) did a little better, up 1.3%.
The IEA raised its oil demand forecast for 2021 by 230,000 bpd. The IEA cited the rising vaccinations in the U.S. plus the big drop in cases in the U.S. along with the potential for huge stimulus packages in the U.S. as reasons for the upward revision.
Both WTI oil and the XOI appear poised to turn back up within their respective bull channels. Oil’s next challenge would be to take out $65/$66. Above that level regaining up to $70 probable. The XOI put in a small double bottom but stayed within the channel. It needs to regain above 1050 to convince us we are going higher. WTI oil now has support but a breakdown under $60 and especially under $59 would send prices tumbling towards better support near $52. The uptrend remains in place following this pullback, but we need to continue to hold support levels to be able to move higher.
_
(Featured image by FXTM Thailand CC BY 2.0 via Flickr)
DISCLAIMER: This article was written by a third party contributor and does not reflect the opinion of Born2Invest, its management, staff or its associates. Please review our disclaimer for more information.
This article may include forward-looking statements. These forward-looking statements generally are identified by the words “believe,” “project,” “estimate,” “become,” “plan,” “will,” and similar expressions. These forward-looking statements involve known and unknown risks as well as uncertainties, including those discussed in the following cautionary statements and elsewhere in this article and on this site. Although the Company may believe that its expectations are based on reasonable assumptions, the actual results that the Company may achieve may differ materially from any forward-looking statements, which reflect the opinions of the management of the Company only as of the date hereof. Additionally, please make sure to read these important disclosures.
David Chapman is not a registered advisory service and is not an exempt market dealer (EMD) nor a licensed financial advisor. We do not and cannot give individualised market advice. David Chapman has worked in the financial industry for over 40 years including large financial corporations, banks, and investment dealers. The information in this newsletter is intended only for informational and educational purposes. It should not be considered a solicitation of an offer or sale of any security. Every effort is made to provide accurate and complete information. However, we cannot guarantee that there will be no errors. We make no claims, promises or guarantees about the accuracy, completeness, or adequacy of the contents of this commentary and expressly disclaim liability for errors and omissions in the contents of this commentary. David Chapman will always use his best efforts to ensure the accuracy and timeliness of all information. The reader assumes all risk when trading in securities and David Chapman advises consulting a licensed professional financial advisor before proceeding with any trade or idea presented in this newsletter. David Chapman may own shares in companies mentioned in this newsletter. We share our ideas and opinions for informational and educational purposes only and expect the reader to perform due diligence before considering a position in any security. That includes consulting with your own licensed professional financial advisor.


Tilray Acquires HelloMD to Expand Medical Cannabis Digital Platform
Tilray Brands acquired HelloMD, a digital healthcare and medical cannabis platform, pending court approval on June 29, 2026. The deal...


Spanish Crowdfunding Market Reaches Record €761.6M in 2025, Driven by Real Estate and Crowdlending Growth
Spanish crowdfunding market reaches record €761.6M in 2025, driven by strong real estate dominance and rapid crowdlending growth, while donations...


Swedish fintech Lysa is preparing to enter the European ETF market
Swedish fintech Lysa is entering the European ETF market, registering its first ETF and expanding beyond its robo-advisor model. Managing...


Bitcoin Stalls Near $60K as Strategy Moves, ETFs Outflow, and EU MiCA Rules Take Effect
Bitcoin hovers near $60,000 with ETF outflows, while Strategy boosts reserves, sells BTC, and raises dividends to reassure investors. Ethereum...


Morocco’s Growth Holds at 4.6% as Agriculture Offsets Economic Pressures
Morocco’s economy grew 4.6% in Q1 2026, driven by a strong agricultural rebound offsetting declines in industry. Services expanded moderately...
 |
|
 |  |
 |
|
-

 Impact Investing1 week ago
EU Weighs More Free Emission Permits in ETS Review to Boost Industry Competitiveness
-

 Biotech1 week ago
Gilead HSV Plan Could Transform Market Outlook
-

 Impact Investing2 weeks ago
Edison Accelerates Renewable Growth and ESG Impact in 2025
-

 Markets4 days ago
Cotton Market Weakness Persists Despite Brief Rebound