Featured
China challenges US hegemony and dollar; Bitcoin’s price drops further
China competes with US dollar through Petro-yuan and talks trading gold with Iran in exchange for oil supply. Bitcoin slides further to less than $8,000.
For some 200 years the world has been dominated by two currencies—Britain’s (now the United Kingdom) Pound Sterling (£) and the US$. After Britain’s victory in the Napoleonic Wars, they were left without any serious international rival except possibly Russia. When Russia expanded its territories, threatening the Balkans, the British and the French defeated the Russians during the Crimean War (1854–1856). Britain ruled the world in a period known as “Pax Britannica.” Its naval power was unsurpassed, it dominated world trade, and its banking empire stretched around the world through its vast colonial holdings. Britain’s hegemony imposed its will throughout the world and enforced it as the global policeman.
If all that sounds familiar, it is because, at least since the middle of the 20th century, the world has been dominated politically, economically, and culturally by the United States of America (U.S.A.). It is known as the American century and, like Britain, the period is known as “Pax Americana.” As with Britain, the U.S.’s only major international rival had been Russia as represented by the Soviet Union. With the collapse of the Soviet Union in 1991, the U.S. became the world’s only superpower. Now it was the U.S. global hegemony ruling the world and enforcing their will as the global policeman.
The word “Pax” refers to peace, a period of time when peace generally dominated the world. The first reference to it was used, we believe, to describe the period of “Pax Romana” when Rome ruled the Western world for some 200 years until late in the 2nd century AD. The Roman denarii was the currency of choice during that period. And, like Britain and the U.S., Rome imposed its will on the Western world and enforced it as the policeman.
When Germany helped establish the gold standard in the 1870s, the world moved into a long period of growing international trade where free trade and globalization came to the fore. With nations now having to back their currency with gold the Pound Sterling ruled and helped to sustain a long period of growth despite two periods of depressions, especially in the U.S. during the 1870s and the 1890s. It was also during this period that challenges emerged to Britain’s global power. One was coming from across the ocean with the rise of the U.S. as a growing power, even if it remained somewhat isolated after the end of the U.S. Civil War. The other was coming from Germany after the unification of Germany in the 1870s and Germany’s defeat of France during the Franco-Prussian War in 1870–1871.
But it was the rise of Germany and its currency, the Deutsche Mark, that began to challenge British global hegemony. Rapid industrialization, the buildup of armies with new and more powerful weapons, and the quest for resources eventually brought the power (Britain) and growing power (Germany) into conflict. Alliances were formed—Germany with Austria-Hungary, the Ottoman Empire and Italy, while Britain formed alliances with France and Russia. During the early part of the 20th century, Germany embarked on the building of the Berlin-Baghdad railway along with a port in the Persian Gulf. These allowed Germany to challenge Britain’s dominance in India, avoid the British-French controlled Suez Canal, gain access to the suspected oil fields of Mesopotamia, and allow Germany easier access to its colonies in Africa.
The railway was a threat to British dominance and control of its colonial empire and it was also a threat to Russia as it would expand German influence north into the Caucasus. The Ottoman Empire at the time was also coming apart at the seams and Germany was taking advantage of that, even as they formed an alliance with them. The railway was actually going to help the Ottomans maintain their vast empire. Britain also became concerned that they would be cut off from the Persian oil fields. As well, there were concerns that attacks could be launched against India.
The emboldening of the Arabs also led to attacks against British installations in retaliation against the defeat of the Mahdi in Sudan in the latter part of the 19th century. Like the U.S. 100 years later, the British had created numerous enemies in their vast colonial empire where the natives were often treated as an afterthought. Germany was more than willing to take advantage of that. All of this helped to create tensions between the Great Powers of the time and some claim the Berlin-Baghdad railway was a contributor to WW1.
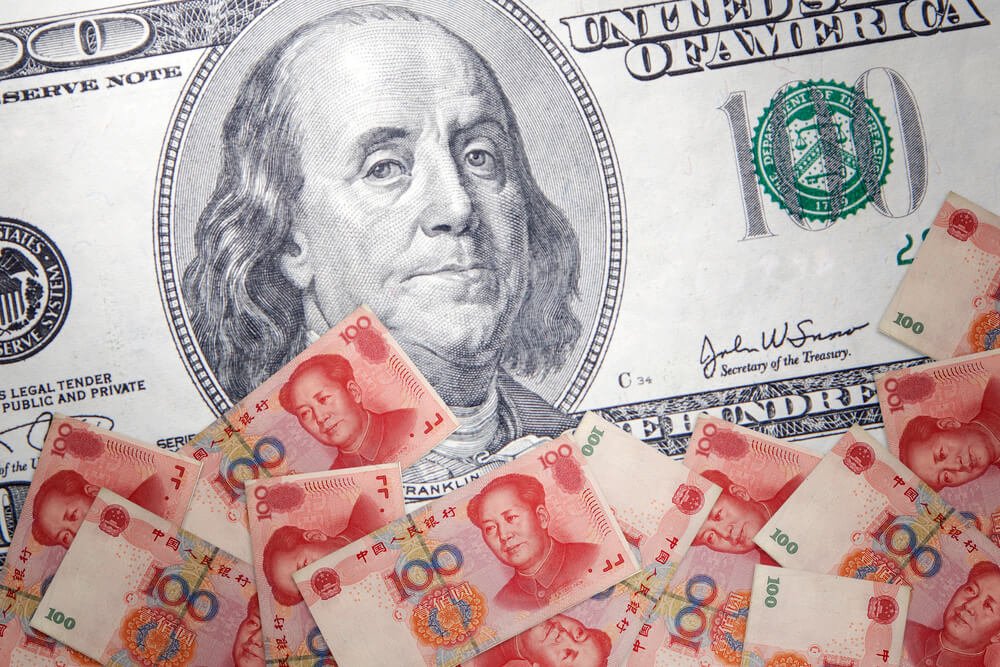
While today’s circumstances are different, there are similarities. China replaces Germany as the number one challenge to U.S. global hegemony with the Yuan challenging the supremacy of the U.S. Dollar. China is embarking on the creation of its own version of the World Bank, the IMF, and the SWIFT payments system. The Yuan would be the currency supplanting the U.S. Dollar. China is also embarking on building the new Silk Road that would connect 68 countries, 65% of the world’s population and one-third of global GDP. It would connect China to Europe. The project estimated at a cost of upwards of $8 trillion would be the largest infrastructure project ever undertaken. By building a huge land route trade would avoid the maritime trade routes patrolled by the U.S.
Sound familiar? It is China’s version of the Berlin-Baghdad railway. This is challenging U.S. hegemony and the U.S. Dollar. The Yuan would be the currency. Other challenges come from Iran who, along with Russia, wants to build pipelines east to India from Iran and west through Syria and Turkey to connect Iranian oil with Europe. Iran has already announced its intention to accept payment for its oil in Euros and the EU appears willing to go along with it. Iran has also made it a condition of sticking with the Iranian nuclear deal. With Trump backing out of the Iranian nuclear deal, numerous EU companies are caught in the crossfire of the sanctions being imposed on Iran, causing a rift between the U.S. and key members of the EU, especially Germany.
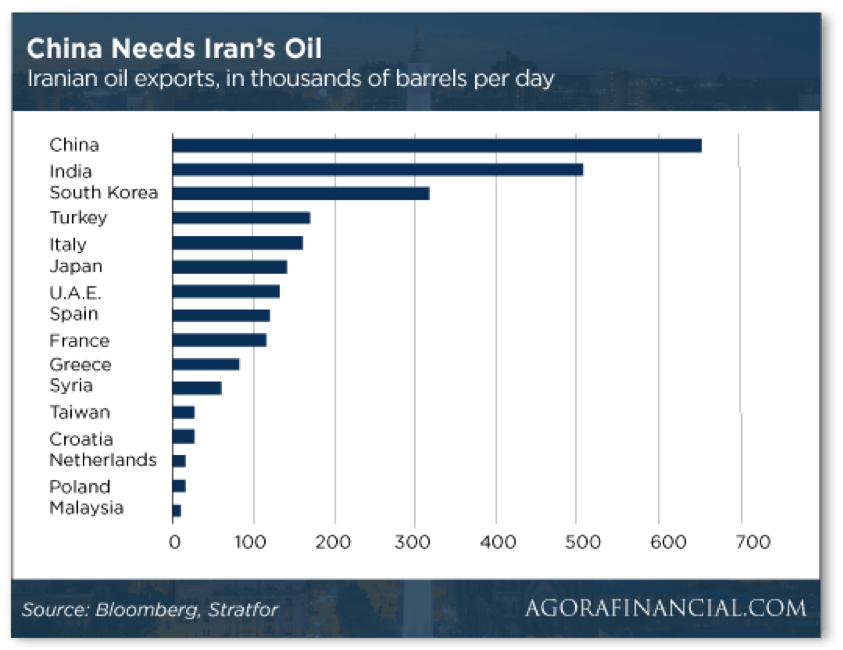
There is more. The number one buyer of Iranian oil is China, followed by India and South Korea. None of them would be pleased if Iranian oil supplies were curtailed because of sanctions. The largest buyers of Iranian oil in the EU are Italy, Spain, and France. The French finance minister has been quoted as saying “the international reach of U.S. sanctions makes the U.S. the economic policeman of the planet, and that is not acceptable.” He also described the EU’s relationship with the U.S. as that of “vassals.”
Iran needs hard currency and China needs oil. While they conduct transactions in Yuan, apparently it has been proposed that transactions could be conducted in gold, something China has a lot of. As the world’s largest producer of gold, China has at least 1,800 tonnes in official reserves and an unknown quantity “off the books.” According to analyst Jim Rickards, countries like Turkey are already paying with gold to buy natural gas from Iran. Rickards has described the setting up of a gold payments system as a way to get around US$ based payment systems under sanctions. Countries involved are Russia, China, Iran, Turkey along with others. Gold doesn’t need the SWIFT system. It is fungible and non-traceable. Iran has built up a sizable gold hoard thanks to payments received as a result of signing on to the nuclear deal. Iran has also received considerable payments from the EU via Turkey in gold.
And it doesn’t stop there. China has launched the Petro-Yuan to compete with the U.S. Dollar for oil payments. Already the contract is making notable inroads against the U.S. Dollar. Even the Saudis are considering trading in Yuan for oil. The London Metals Exchange (LME) is prepared to launch Yuan-based products as well.
© David Chapman
It comes as no surprise that there has been a considerable military build-up in the South China Sea by both China and the U.S. The U.S.’s dispute with North Korea disguises the real aim, which is the military surrounding of China. There is also an ongoing military build-up of NATO forces along the Russian border. Constant demonizing of Iran and Russia is setting the tone for possible military clashes. Like Iraq and Libya before, the U.S. needs to take out Iran to stop the use of currencies other than U.S. Dollars. None of this is to suggest that a war is inevitable or will even happen, but tensions are being ratcheted up, and there is always the risk of an accident.
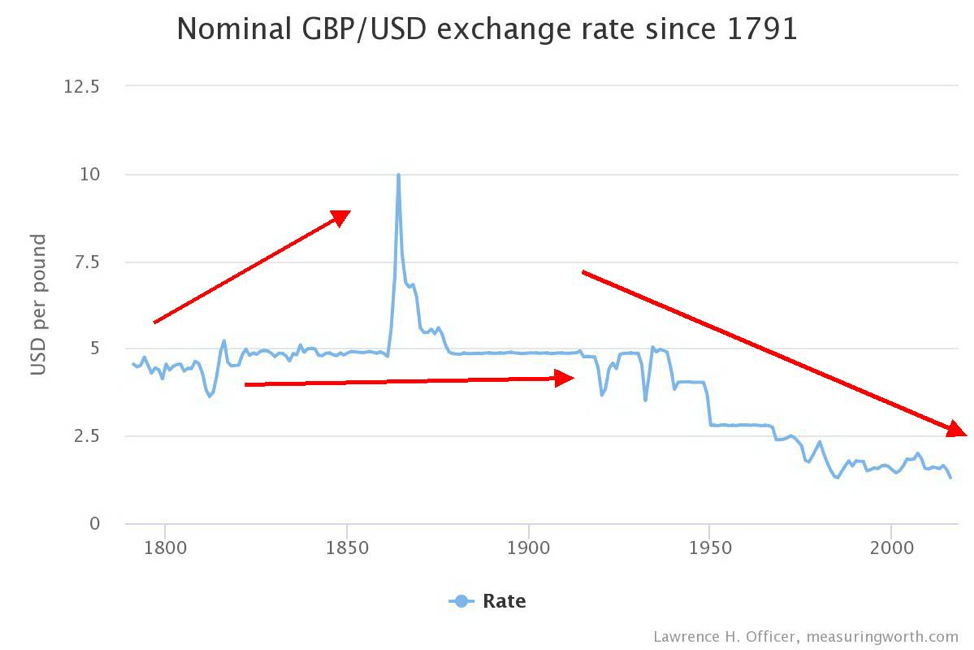
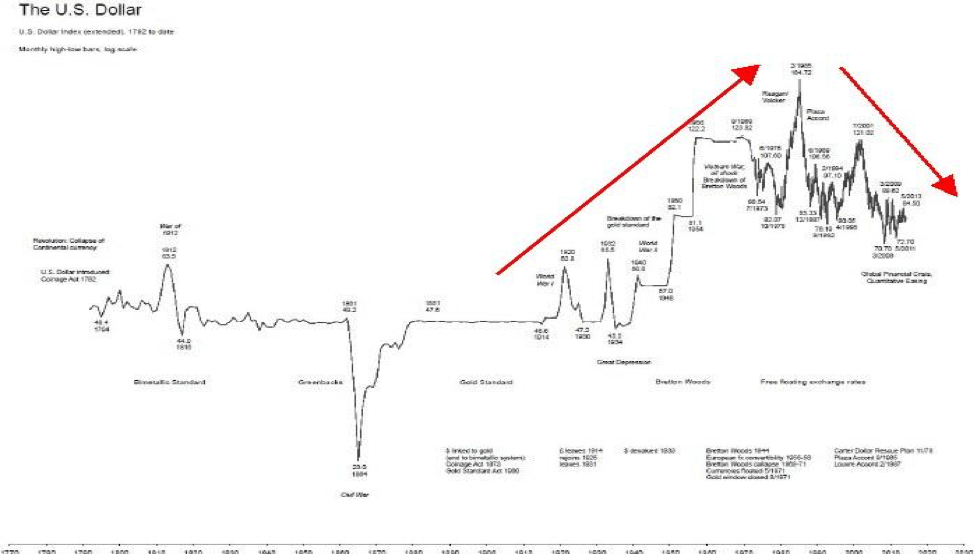
We have two very interesting long-term charts below. The first shows the Pound Sterling. It hit its zenith during the U.S. Civil War at almost $10. Note, however, the long-term decline of Sterling, starting with WW1 and accelerating after WW2. The British Pound today is but a shadow of its former self. The second chart is a long-term chart of the U.S. Dollar. The U.S. Dollar soared after WW2. It then peaked in 1985 and began a long descent following the Plaza Accord, aimed at bringing down the value of the U.S. Dollar. The U.S. Dollar had a secondary peak around 2001 and started another long-term descent after the events of 9/11 and the invasion of Iraq in 2003. Too much debt, too many military adventures, weak currency, weakened economy, and eventually a weakened nation—all leading to collapse. Ask Rome.
© David Chapman
© David Chapman
Bitcoin watch!
© David Chapman
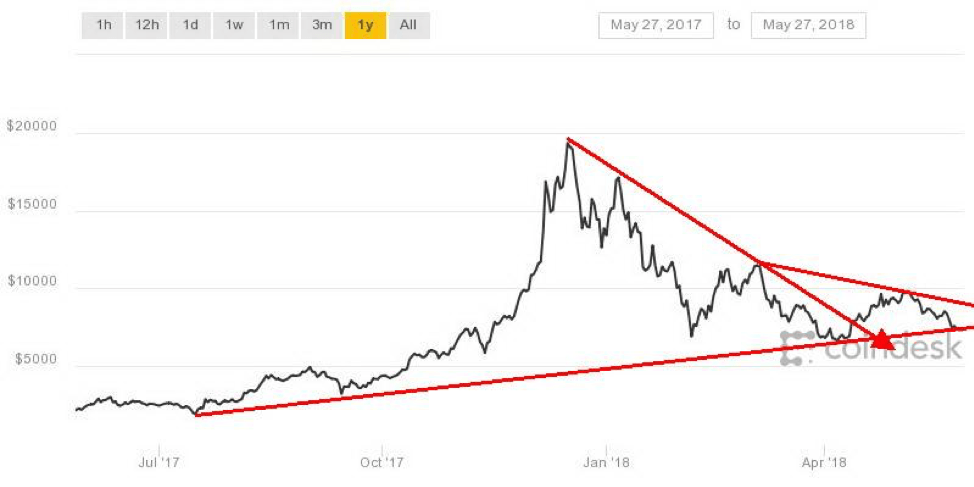
The bloom continues to come off Bitcoin and the cryptocurrencies. Bitcoin has now fallen below $8,000 and is threatening to fall further toward $7,000. A break of $7,000 would most likely see Bitcoin eventually sink to new lows below $6,600 and fall towards $6,000. Bitcoin has fallen back under the 200-day MA for the first time since mid-April. That is usually not a good sign. But until we see new lows there remains hope that the 200-day MA proves to be supportive. The NYSE Bitcoin Index (XBT) has fallen below its 40-week MA.
It was hard finding any crypto that was up this past week amongst the big players. One, TRON (TRX) gained about 5% this past week. All others were in the red, including the Winklevoss twins’ darling ZCash (ZEC) which was down about 18%. The market cap of all cryptos, according to Coin Market Cap has fallen $30 billion (yes, billion) in the past week, down to $336 billion. Somebody has to be losing a lot of money. But what was mind-boggling to learn was the number of cryptos that leaped to 1,623 this past week, up from 1,593 the previous week. Given how difficult the market is, it is astounding to learn there are even more who are willing to bet on what is not a sure thing anymore. The days of a sure thing appear to have come and gone.
One factor driving the market down is the Department of Justice (DOJ) has reportedly opened a criminal investigation into Bitcoin price manipulation. The news was reported by Bloomberg. Apparently, the cryptocurrency market gets flooded with fake orders. The practice is called “spoofing.” No guff. Given the proliferation of cryptocurrencies and the ability to money launder using cryptos, scams, fake ICOs and more, it’s no surprise regulators are scrambling everywhere to get a handle on this market. What possessed the people who started this into believing they could effectively create an alternative universe for money and not come under scrutiny is beyond our thinking.
Our expectation is we are headed lower. Once Bitcoin makes new lows below $6,600 the next major targets could be down to $3,400. Only new highs above $9,900 might change this scenario.
Markets and trends
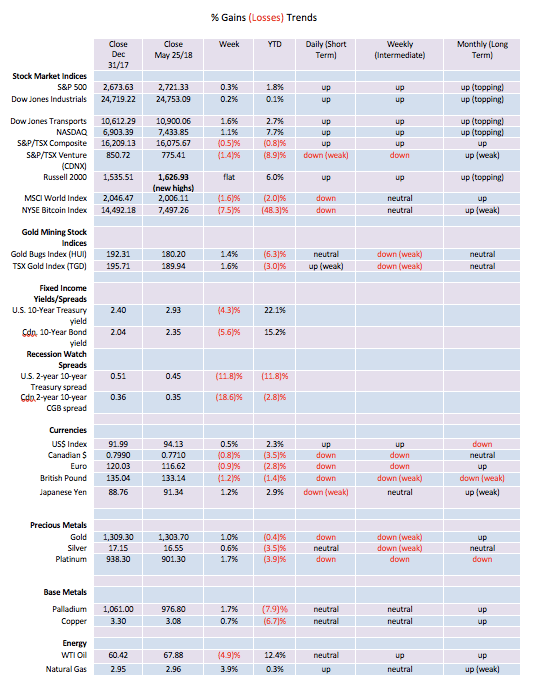
Note: For an explanation of the trends, see the glossary at the end of this article.
New highs/lows refer to new 52-week highs/lows.
© David Chapman
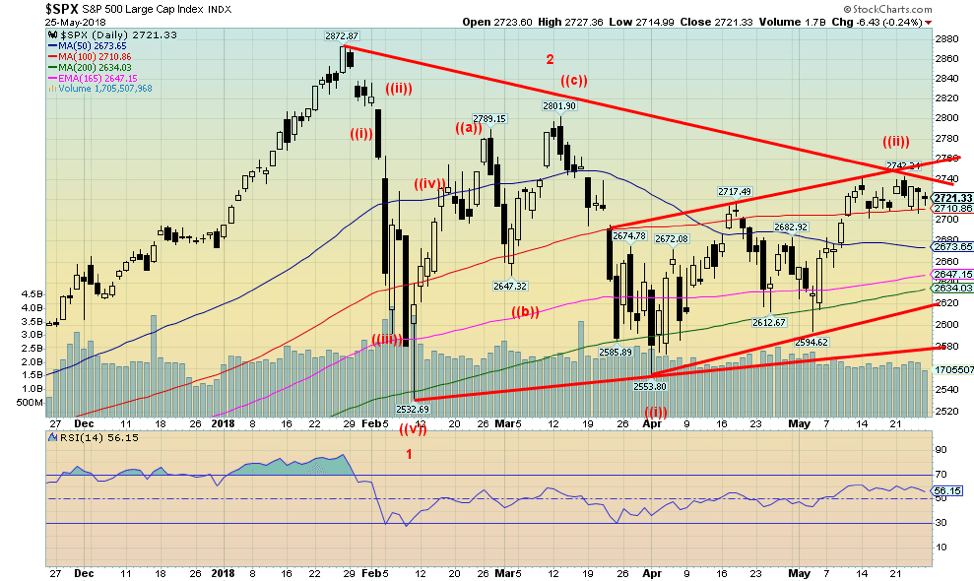
The S&P 500 put in a pretty flat week with a small gain of 0.3%. The markets were battered back and forth with elation that the U.S. and China were going to talk about trade and then disappointment with the cancellation of the summit between Trump and Kim Jong-Un. The S&P 500 continues to struggle, just over the 100-day MA. It continues to act as support but that support could be termed feeble. The S&P 500 appears to be in a low rising up trend. A firm breakout over 2,750 could shift the trend to the upside. But a break now of 2,700 could see the index fall back once again. There are a lot of mixed signals going on with the small cap stocks making new highs, the commercial COT remaining quite positive, trade talks between China and the U.S. underway (although they could fail at any minute, given the moods of President Trump), and still some hope of a summit with North Korea even as right now it looks to be off. A breakout above 2,750 would most likely suggest we could take out the most recent high at 2,801. Above 2,801 new all-time highs are probable. The wave count is confusing which is typical of corrective waves. We note Elliott Wave International have presented alternative counts that could suggest either a top is in or there is more upside potential.
© David Chapman
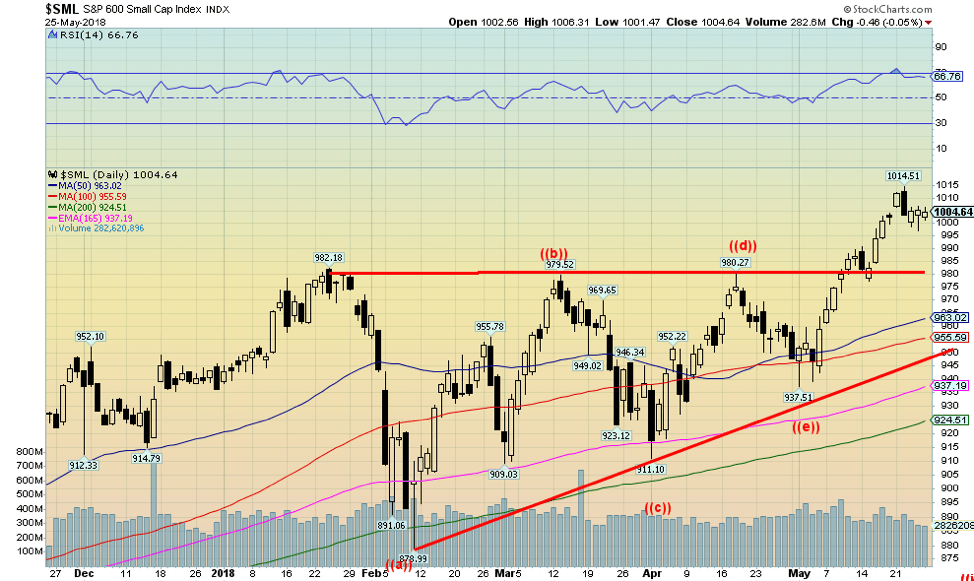
With the small cap stocks making new all-time highs even as the large-cap stocks are not making new all-time highs, the suggestion is that the large-cap stocks will eventually make new highs to confirm with the small-cap stocks. Here is the S&P 600 the small-cap version of the S&P 500. We were intrigued with the rising or ascending triangle that formed over the past few months. The breakout above 980 suggests a potential move to 1,085. So far, the market high has been 1,014 so there is further potential for the market to rise. The S&P 600 was pretty flat on the week with a gain of under 0.1%.
© David Chapman
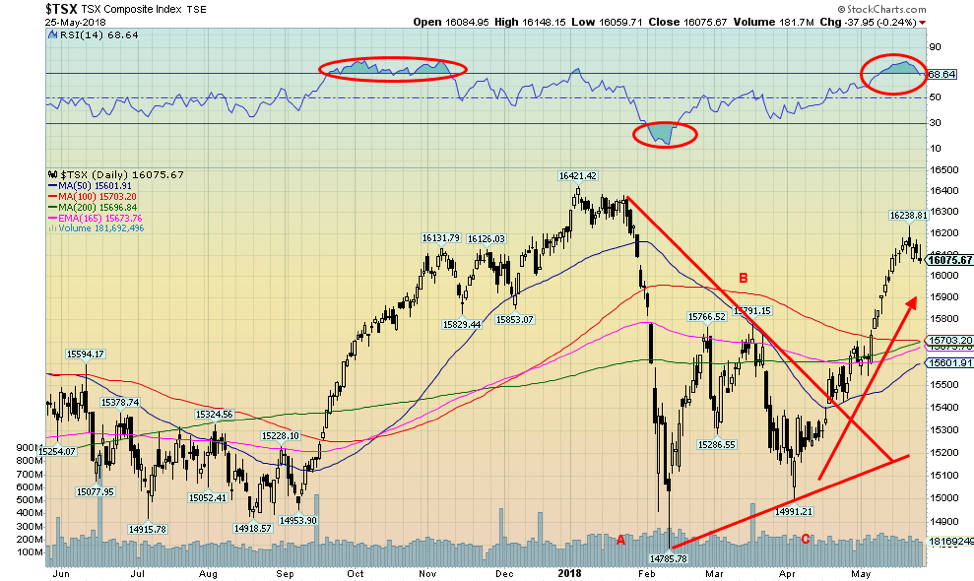
The TSX Composite faltered this past week past because of weakness in energy stocks. The TSX Composite made a high, reversed, and closed lower on the week. It can be termed a reversal week, but it is not a key reversal week. After a rather strong climb over the past two months a pause was overdue. There were persistent readings above 70 for the RSI, indicative of an overbought market. The uptrend remains in place but a correction would take off some of the overbought condition. We noted considerable support down to 15,700. In hitting a high of 16,239, the TSX Composite appears to suggest new highs are possible above the December 2017 high of 16,421. As noted, support is at 15,700 and also at 15,800.
© David Chapman
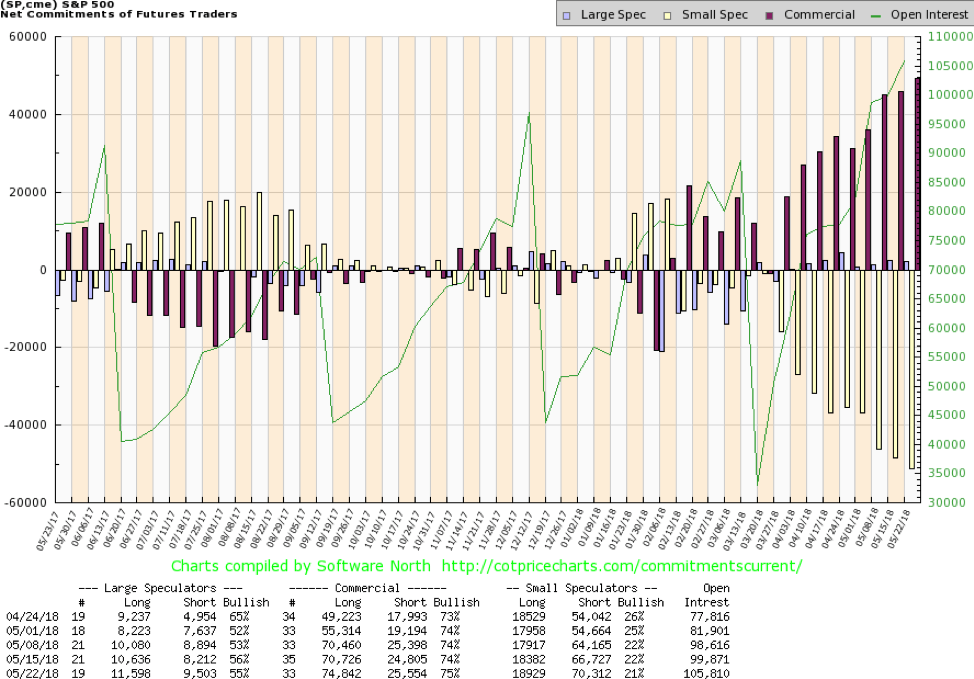
The commercial COT for the S&P 500 continues to be positive for stocks. We are surprised, but it shouldn’t be dismissed. The commercial COT rose to 75% from 74% this past week as longs added roughly 4,000 contracts even as shorts added under 1,000 contracts. Note how the commercial COT for the S&P 500 fell sharply in December/January just before the collapse in February. The commercial COT continues to suggest that we should see higher prices ahead.
© David Chapman
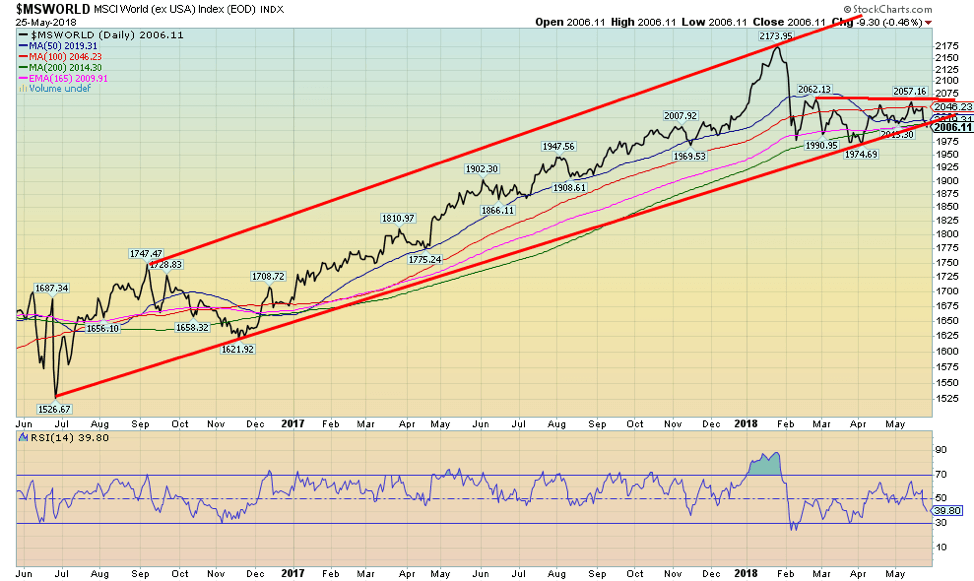
As a global index goes the MSCI World Index is probably the best. Like the U.S. indices, the MSCI has been struggling for the past few months. After falling initially in February, it has failed to gain real traction over the next few months, consistently running into resistance around the 100-day MA. Now the MSCI is testing its uptrend line once again and as well the 200-day MA currently at 2,014. The index closed at 2,006 on Friday. A break of 2,000 could suggest that the MSCI is poised to move lower towards initial support near 1,975, but under that level a decline to 1,900 becomes likely. Resistance appears to be strong, up around 2,050. A break above that level could turn the market up. The persistent weakness in the MSCI could be a sign that the U.S. indices will fail as well.
© David Chapman
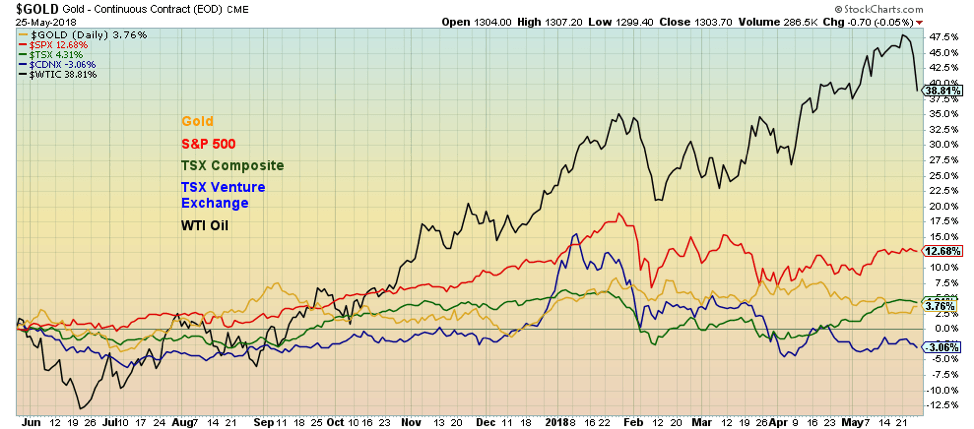
It is always interesting to compare performance and this chart does that by comparing the performance of gold, the S&P 500, the TSX Composite, the TSX Venture Exchange (CDNX), and WTI Oil. The big performer so far over the past year is WTI Oil, up 38.8%. The big loser is the junior CDNX, down 3.1% as it struggles to gain attention and traction. Everybody else is in between with the S&P 500 the best up 12.9% while the TSX Composite is up 4.3% and gold is up 3.8%.
© David Chapman
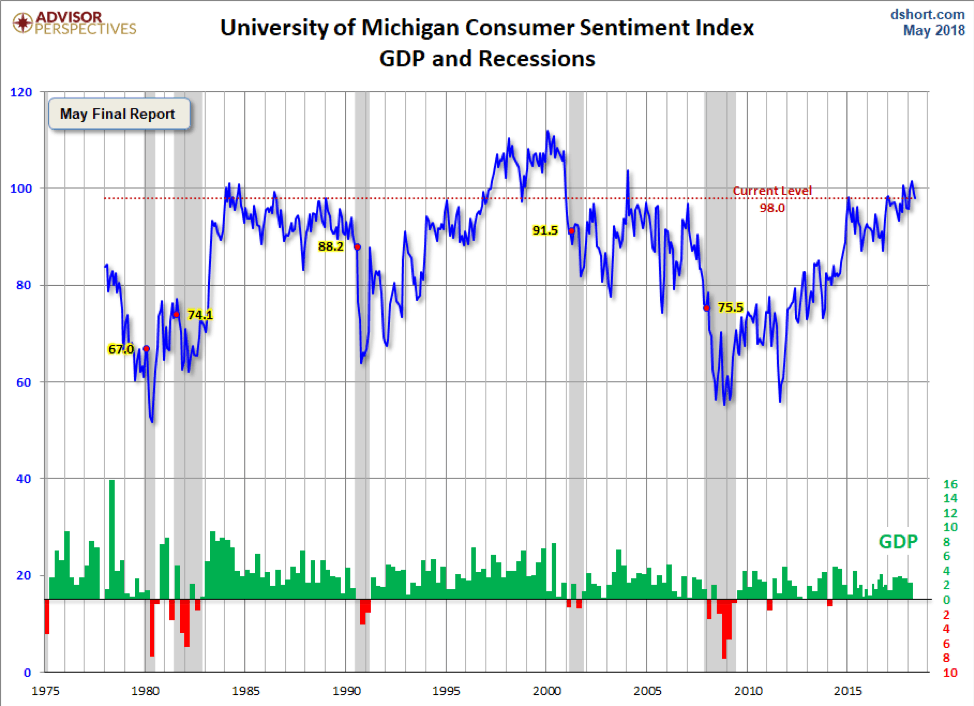
The Michigan Sentiment Indicator could be moving into a period of resistance to any further up moves. The May Michigan Sentiment Indicator slipped to 98 down 0.8 from April. The market had expected a reading of 98.8 once again. This entire area has proven to be stiff resistance in the past judging by levels seen in the early 2000s and the late 1980s. Only the 1990s saw consistent readings over 100. Consumers have been focused on jobs and rising incomes but also are concerned about rising interest rates and inflation. There is concern about political instability but nothing noteworthy as consumers tend to focus on money and employment issues. Given the ongoing high levels at resistance this is an indicator that is key to follow going forward.
© David Chapman
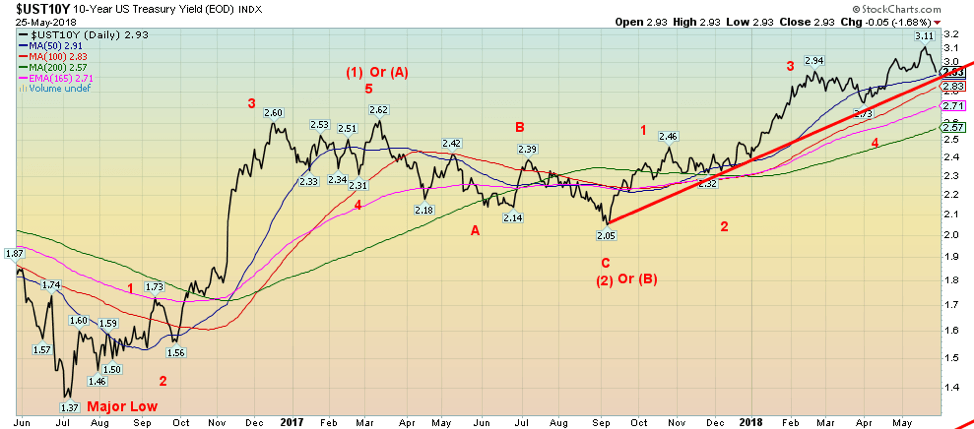
The 10-year U.S. Treasury note fell to 2.93% this past week, mostly because of nervousness over political jitters in Italy and Spain. Italy has elected right-wing populists who have stated objections to Italy remaining in the EU. This caused nervousness and some $4.4 billion in funds were withdrawn from western European markets. The prime beneficiaries were U.S. Treasuries and German Bunds, both of who rallied this past week. Ten-year German Bunds fell to 0.41% from 0.58% the previous week. Spain remains a bundle of jitters as well because of continued political instability. So, does this mean that the rise in yields (fall in prices as prices move inversely to yields) is over? The answer, unfortunately, is a maybe, maybe not. Targets of 3.20% have still not been hit. There is potential solid support for the 10-year here at 2.93% and down to 2.90%. A break below 2.90% could suggest a further decline to support near 2.80% and 2.70%. If 2.90% holds and yields start rising again, then odds shift that the recent high at 3.11% could be taken out.
Recession watch spread
© David Chapman
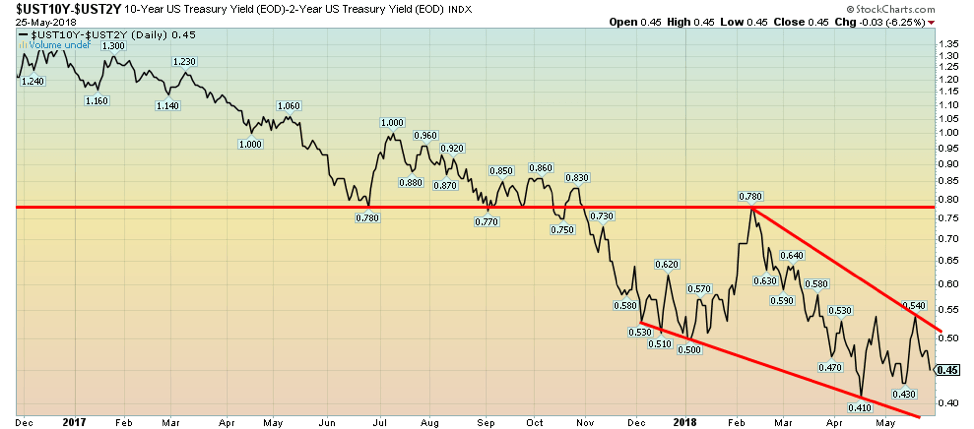
With the 10-year U.S. Treasury note falling back to 2.93% while the 2-year U.S. Treasury note remained relatively unchanged the 2–10 spread fell this past week to 0.45% from 0.51% the previous week. The Fed remains committed, it seems, to a minimum of two more rate hikes in 2018 and they have hinted there could be three rate hikes. The next rate hike could come on June 12–13. Expect a rate hike of 0.25% at that time. It is noteworthy that the June meeting also will see a presentation of economic projections and a press conference with the Fed Chairman Jerome Powell. It is important that the Fed Chairman not come across as if he is really speaking for President Donald Trump. The Fed is supposed to be independent from the President. With the spread narrowing this past to 0.45% it is continuing a trend that has been ongoing for months of a narrowing yield curve. However, a narrowing yield curve is not in itself a sign that there will be an impending recession. History suggests the yield curve has to go negative for a period of time to signal an impending recession. We are nowhere near a negative yield curve, even as the trend remains down. A break below the recent low at 0.43% could see the 2–10 spread fall next to around 0.32%.
© David Chapman
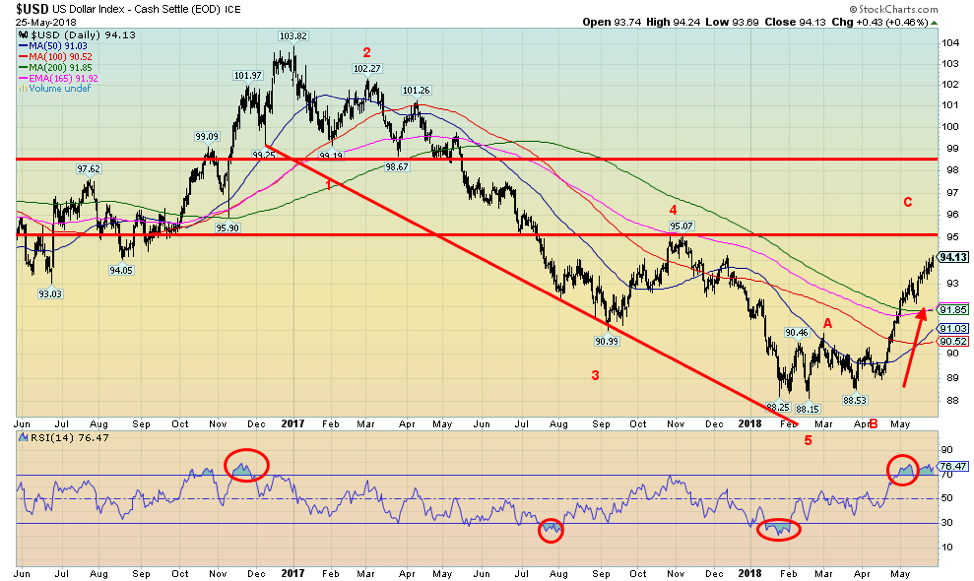
The US$ Index is marching quickly towards potential targets and resistance near 95. The RSI has persisted above 70 now for the past few weeks. Once over 70 it is a sign the market is quite overbought but it is a condition that can linger for some time in a strong bull move. The recent up move has been strong and probably overdue given the long decline from 103 to 88. A normal Fibonacci 38.2% would take the US$ Index to at least 94.13. A stronger corrective move could take the US$ Index up to the 61.8% Fibonacci retracement at 97.85. In between the Fibonacci 50% retracement is seen at 96. So a move to 95 fits nicely with a retracement between 38.2% and 50%. Only a move above 100 could suggest new highs ahead. We doubt that will happen. Given the overbought conditions currently present, a corrective period is needed before any further highs could be seen. As well, there is resistance at 95 with that high seen last October at 95.07. We might exceed that high slightly before this move is done. This past week saw the US$ Index close over 94. The momentum is up and it has been almost straight up. Straight up moves like that are usually not sustainable, but they are typical of corrective patterns as they are designed to give the market a head fake as to its real intentions. At the opposite end the Euro has been almost in freefall and that is usually not sustainable, either. Interestingly, the Japanese Yen was up this past week, bucking the trend for most of the currencies. The Yen gained 1.2% while the Euro lost 0.9%, the British Pound was off 1.2%, and the Cdn$ dropped 0.8% to close near 77.
© David Chapman
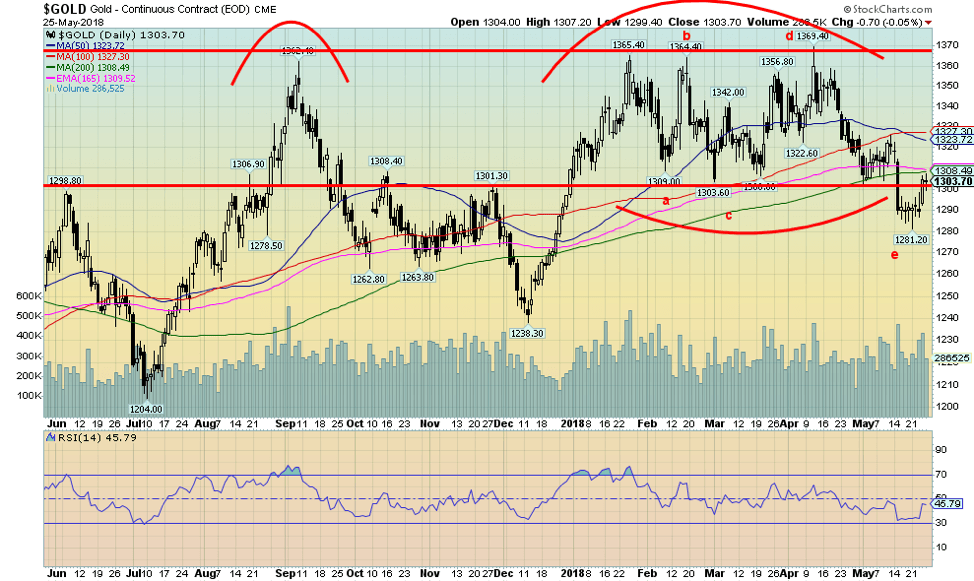
Gold’s recent drop down to $1,281 is hopefully a positive divergence with both silver and the gold stocks. Gold made new lows for the recent down move, whereas silver and the gold stocks did not. Gold also may have completed a 5-point corrective pattern labelled abcde. If correct, then this next move to the upside could be potentially positive and even explosive. Gold managed to gain about 1% this past week and closed back over $1,300 giving us at least a small buy signal. There is, however, resistance near $1,310 and up to $1,325. Above $1,325 gold begins to look more positive and another attempt at $1,370 should get underway. But the key level remains $1,370, a level probably everybody is aware of. If sellers are lying in wait again at that level we probably shouldn`t be surprised. But it may be their turn to be surprised as, if the 5-point reversal pattern is correct, we should break through $1,370 this time. Gold has been rising steadily in a series of higher lows since the major low way back in December 2015 at $1,045. The fact that resistance has formed around $1,370 is interesting as that has created a flattish top. Highs were seen at $1,377 in July 2016, then a series of highs between $1,360 and $1,370 in September 2017, and January, February, and April 2018. Every time, the area up to $1,370 stalled gold and it fell back. The 5-point reversal pattern is typical of what is known as rising or ascending triangle in Elliott wave terms. What is key now is that gold does not breach that recent $1,281 low. Even a break below $1,288 could begin to negate the positive mood seen this past week. Gold sentiment fell to around 10% recently, a level also associated with lows in gold prices. Gold tends to have strong seasonals, usually starting in July, but the seasonals could be coming in early. They would be most welcome.

© David Chapman
Silver, unlike gold, did not see new lows this past week. Silver held above its recent lows of $16.07 and also held an uptrend line coming up from the July 2017 low at $14.34. To date, that has been the low point and it also might be the head of a huge head and shoulders bottom pattern that has been forming on silver. The past several weeks have been frustrating as silver has generally traded between $16.80 and $16.10 since January, except for that short-lived foray up to $17.36 in April. Silver sentiment hit down to around 10% levels that were seen at lows in December 2017, July 2017, and December 2016. As noted, there is resistance at $16.80 and further resistance at $17.25 with final resistance near $17.75. It is at this latter level that the neckline of a possible head and shoulders bottom pattern lies. A firm breakout above $17.75 could see silver rise to around $22.40. Support is seen down to $16.25 and as long as silver holds above that level the trend shift should be to the upside. The only note of disappointment this past week was silver did not perform as well as gold, gaining 0.6% while gold was up nearly 1%. Our preference is to see silver lead, not follow.
© David Chapman
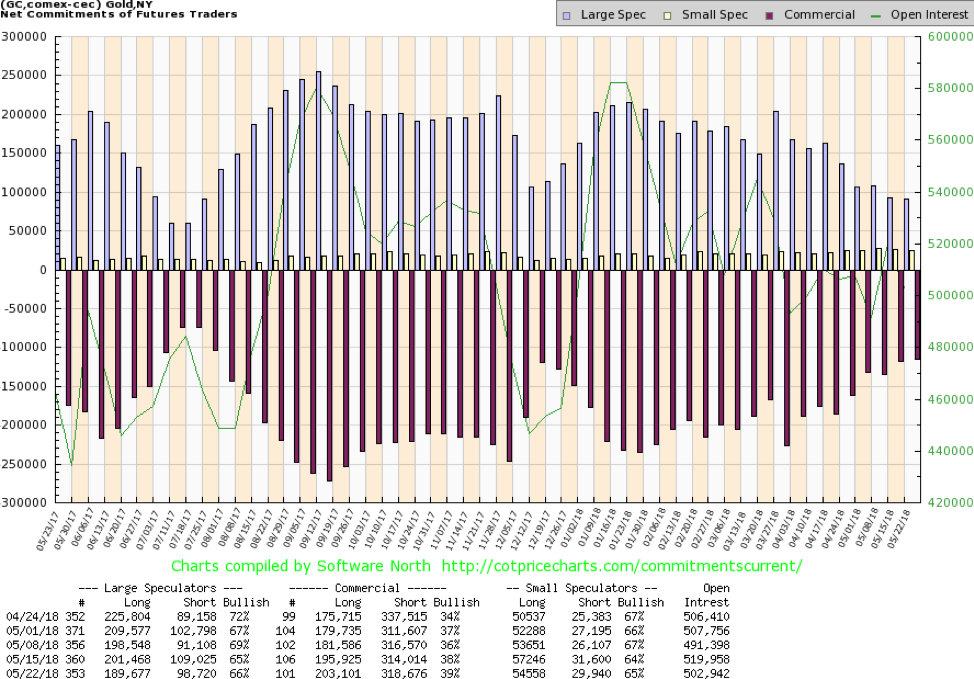
The gold commercial COT jumped this past week to 39% from 38% the previous week. Long open interest rose roughly 7,000 contracts while short open interest also rose about 4,500 contracts. Notably, the large speculators COT (hedge funds, managed futures, etc.) also rose to 66% from 65% as both long and short open interest fell on the week. Total open interest dropped some 17,000 contracts as gold rose 1% on the week. We still view the commercial COT as positive going forward, given it is now up to levels last seen in December 2017 just before a strong up move.
© David Chapman
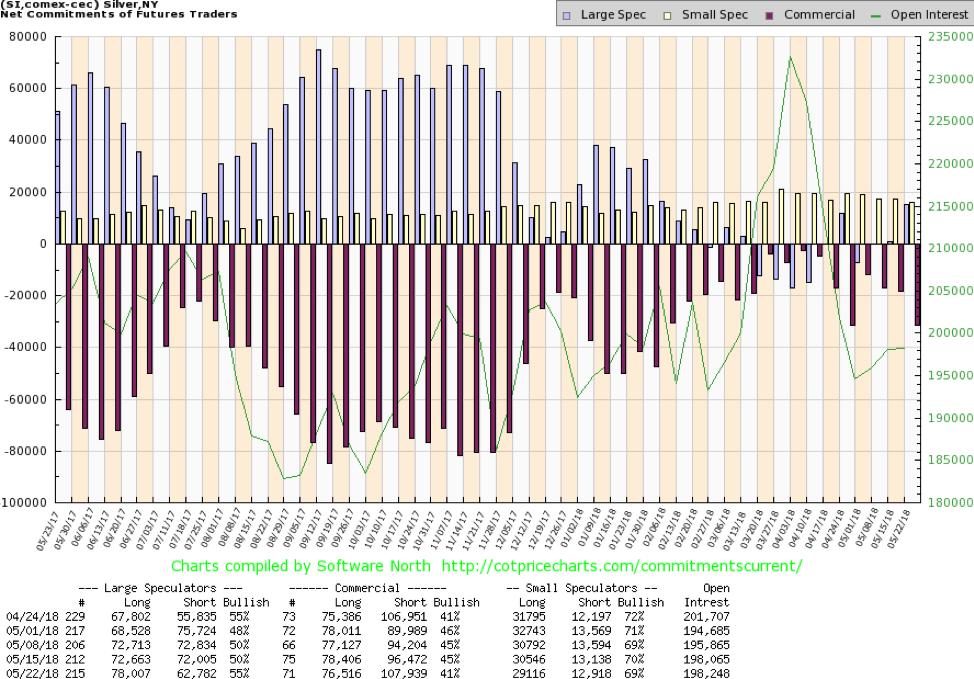
The silver commercial COT slipped this past week to 41% from 45%. The large speculators COT jumped to 55% from 50%. So, is the silver rally over according to the COT report? We doubt it. Long open interest was down roughly 2,000 contracts while short open interest did jump over 9,000 contracts. Silver sentiment did fall to 10% recently while the silver commercial COT has been strong, indicating a coming rally. We note that the silver commercial COT slipped a few weeks back to 41% as well, only to rise once again the next week to 46%. Overall the commercial COT has been strong at levels seen in July 2017 just before a strong rally and again in December 2017 as well before a strong rally. The slip this past week is noted, but it is not as yet a concern.
© David Chapman
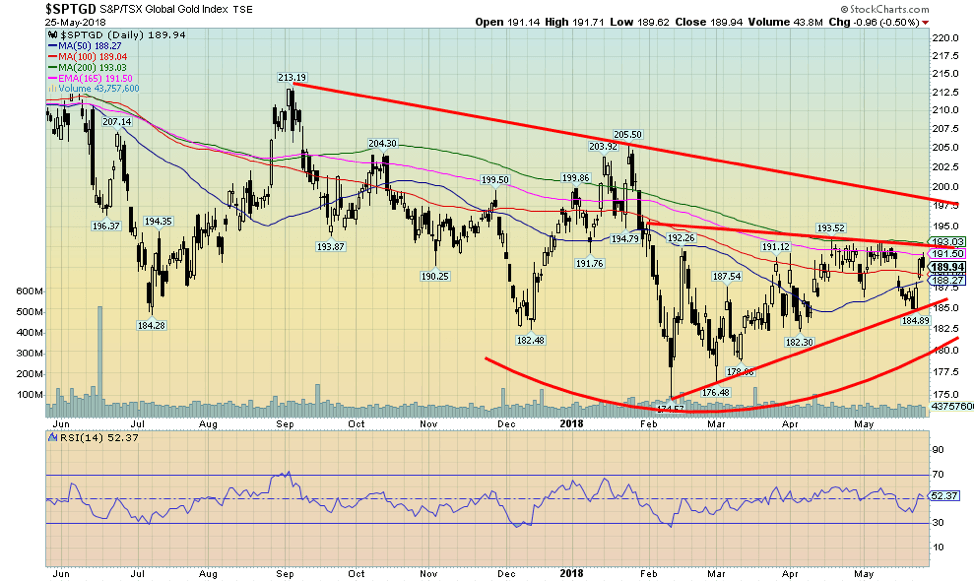
Gold stocks as represented here by the TSX Gold Index (TGD) jumped 1.6% this past week. The U.S. based Gold Bugs Index (HUI) was up 1.4%. Once again, the TGD is knocking on the door of the 200-day MA and 165-day EMA as well as resistance near 193. The TGD appears to have been making a rising or ascending triangle over the past several weeks and appears poised this time to break out. A firm breakout above 193 could project the TGD up to potential targets near 212. Above 193 there is further resistance near 197 but once this hurdle is overcome the TGD could rise even higher to potential targets near 235. Unlike gold that made new lows this past week down to $1,281 the TGD did not. This, we believe, is a positive divergence and suggests that gold and the gold stocks could have a strong move going forward once the key resistance zones are broken to the upside. Support is seen down to 189 and again down to 185. Only a break below 185 could bust the bullish scenario.
© David Chapman
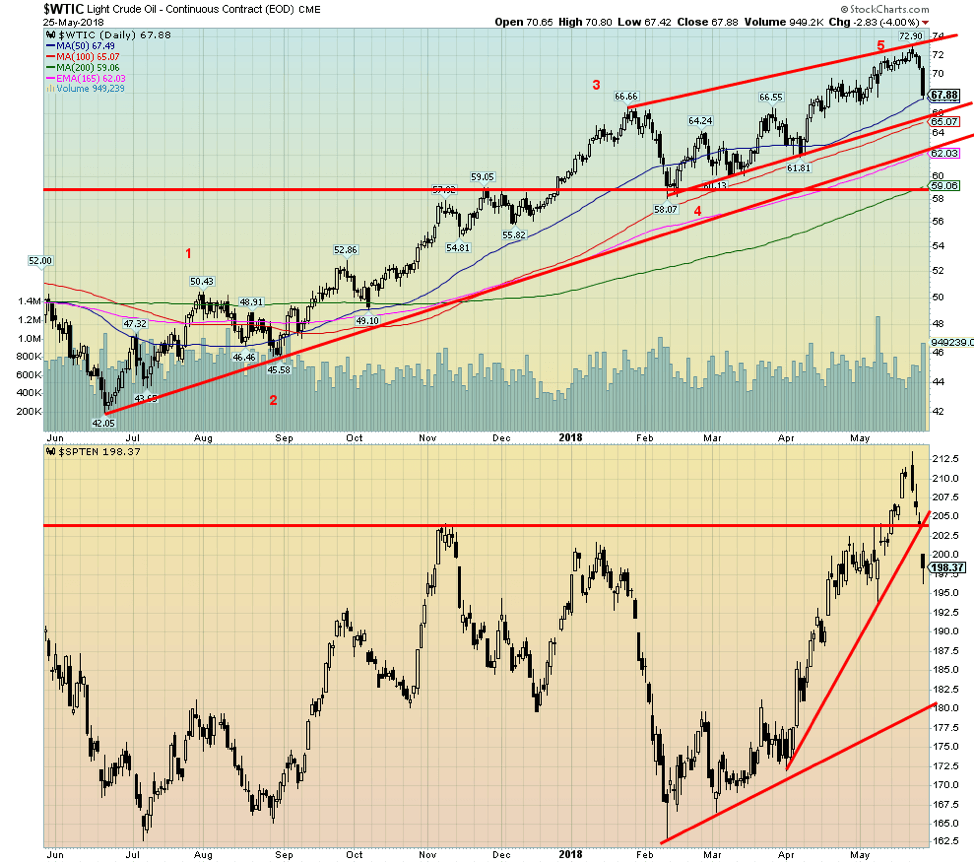
This past week is a prime example as to how oil prices can be both positively and negatively impacted by political events or statements. Apparently, Russia and Saudi Arabia announced plans to ease production cuts to offset shortfalls from Venezuela and to soothe concerns about rising oil prices. WTI oil promptly fell $2.83 on Friday or 4%. That naturally sparked a sell-off in the energy stocks as the TSX Energy Index quickly fell almost 7% from its recent high. Falling energy prices and falling energy stocks also weakened the major U.S. indices towards the end of the week.
So, is that it? The oil rally is over? We doubt it, but we could go through a corrective period. We appear to have made five waves up from that low of $42.05 seen way back in June 2017. The reaction also might have been knee-jerk as the Russians and Saudis emphasized the change would be gradual and wouldn’t start for at least a month until the OPEC ministers’ meeting in Vienna in June 2018. No doubt there will be a concern once U.S. sanctions against Iran begin to bite and how it might impact Iran’s contribution to global supply. It is expected that U.S. sanctions could knock at least 250 thousand to 500 thousand barrels a day of Iranian oil off the market.
We don’t think the oil rally is over but acknowledge we could go through a one-month to three-month correction before the rally resumes. WTI oil prices could ultimately hit $100 once again, levels not seen since 2014. In the interim, weaker oil prices might at least temporarily help drivers at the pump.
Chart of the week
© David Chapman
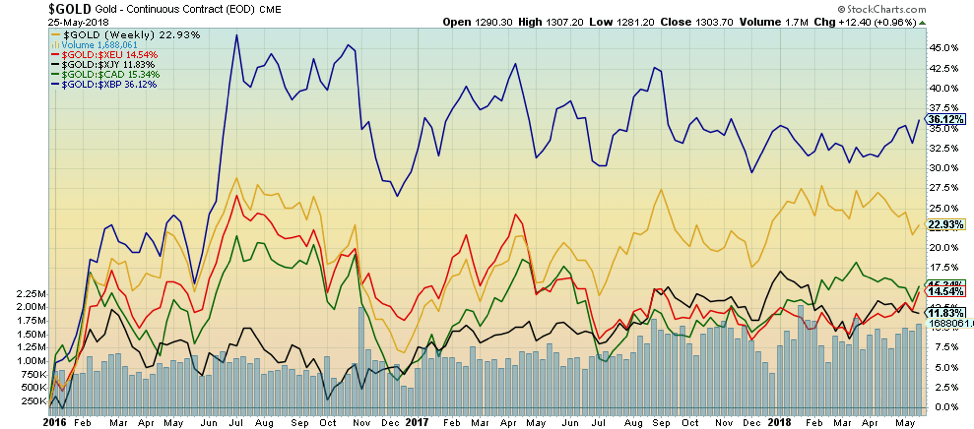
When people think of gold, they always think of gold priced in US$. But in many respects, gold is a currency just like US$, Pounds, Euros, Cdn$, and a host of other currencies. When you check the reserves of central banks what do virtually all of them hold? Gold. Okay, Canada doesn’t, but that’s another story. People would be surprised to learn that the U.S. holds the world’s largest gold reserves totaling 8,133.5 metric tonnes. That’s 261,498,097 troy ounces with a current value at $1,300 of $339.9 billion. It represents just under 75% of the U.S.’s reserves. By contrast, the two main purchasers of gold to add to their reserves over the past few years are Russia and China. Their holdings represent only 17.6% and 2.2% of total reserves respectively. Ideally, they would like to have the same proportion as the U.S. That suggests they have a lot more gold to buy going forward.
Our chart shows the performance of gold in the major currencies. Gold in British Pounds has made the largest gain, up 36.1% since the beginning of 2016 (which just about coincides with gold’s low in December 2015). The strong gain reflects the weakness of Pound Sterling over the past few years. Gold’s performance in US$ is next at 22.9%, followed by Gold/Cdn$ up 15.3%, Gold/Euros up 14.5%, and Gold/Japanese Yen up 11.8%. Their weaker performance reflects the strength of these currencies vs. the US$ over the past few years.
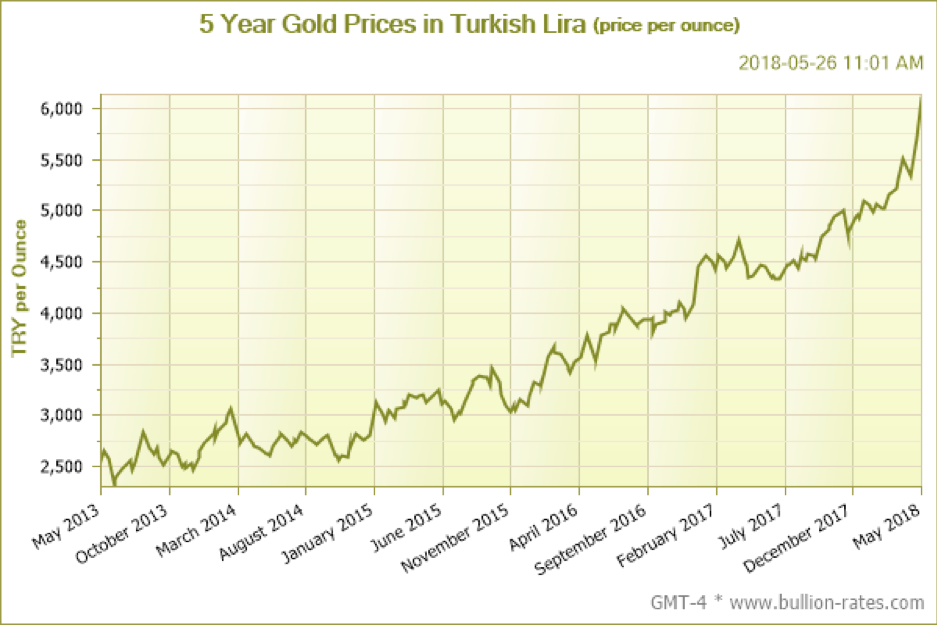
One of gold’s critical roles is to protect against currency debasement. If you live in a country where the currency is collapsing you can’t go wrong holding gold. It helps you maintain your buying power. One could argue that you could get the same thing holding US$ as well, but remember the US$ is just a paper currency (fiat) as well. Holding gold is hard currency. When you look at classic currency collapses, one immediately thinks of Iran, Venezuela, Zimbabwe, Argentina, and as our chart below shows—Turkey. Gold in Turkish Lira has gone up 98% since January 1, 2016. That is proof that gold can protect you when your currency is collapsing. And, unlike US$, it is not a paper (fiat) currency.
© David Chapman
__
DISCLAIMER: David Chapman is not a registered advisory service and is not an exempt market dealer (EMD). We do not and cannot give individualized market advice. The information in this article is intended only for informational and educational purposes. It should not be considered a solicitation of an offer or sale of any security. The reader assumes all risk when trading in securities and David Chapman advises consulting a licensed professional financial advisor before considering a position in any security. That includes consulting with your own licensed professional financial advisor.

-

 Cannabis2 weeks ago
KONOPEX Expo 2026: Celebrating Europe’s New Era of Legal Cannabis
-

 Biotech4 days ago
Volatile Outlook for Enlivex Therapeutics as Investors Await Clinical Catalysts
-

 Impact Investing2 weeks ago
Inter IKEA Launches Electric Truck Fleet to Decarbonize Heavy-Duty Logistics in Italy
-

 Markets6 days ago
Cotton Market Weakens Amid Demand Concerns and Bearish Trends


You must be logged in to post a comment Login