Featured
A close look at the huge margin debt and the Archego Capital collapse
The Archego Capital collapse caught our attention. Some are comparing it to the LTCM collapse back in 1998. But is that the appropriate comparison? We look at another one that may be more relevant. Gold has been on its heels now since August 2020. Sentiment is becoming quite bearish. And we have been looking for a significant cycle low. Are we there yet? At the other end sentiment is very bullish for the stock market.

The Archego Capital affair
Archego Capital. Okay, it doesn’t appear that Archego’s name will quite go down in infamy with Long Term Capital Management (LTCM). If anyone remembers, LTCM was the poster child in the near collapse of the financial system back in 1998. LTCM’s problem was two-fold: huge leverage estimated at over 25:1 debt/equity and exposure to Russia when they defaulted on its sovereign debt. LTCM was founded and managed by former traders from Solomon Brothers headed by the former head of bond trading at Solomon, John Meriwether. Also on board were Nobel prize winners Myron Scholes and Robert Merton whose theories on the pricing of derivatives, including options, brought them fame. Banks were so impressed by the pedigree of its operators that they were, well, literally falling over themselves to lend them money.
LTCM’s investments were primarily bets in the both the bond and equity markets employing derivatives. LTCM’s collapse, coupled with its huge exposure to major Wall Street banks, almost brought down the financial system, forcing the Federal Reserve to act quickly by slashing interest rates and injecting huge sums of liquidity into the financial markets (sound familiar?) The action set the stage for the stock market melt-up in 1999 that became the dot.com bubble.
Flash forward to today. Archego Capital, until now a previously little-known firm, was led by Bill Hwang, a somewhat sketchy individual who had been generally avoided by the blue-chip banks and trading shops until he became too hot to keep avoiding. In 2012 Hwang had pleaded guilty to wire-fraud from an insider trading scandal. He had also been banned by Hong Kong regulators for insider trading. Archego Capital was effectively run from Hwang’s house. These are known as “family offices.” As Hwang’s fund became more successful, the institutions were more than willing to lend him money—led by Credit Suisse (CS) and Nomura Securities (NMR) but also J.P. Morgan and eventually Goldman Sachs, a firm that had once blacklisted Hwang. There were other banks involved as well, including, apparently, Bank of Montreal (BMO) here in Canada.
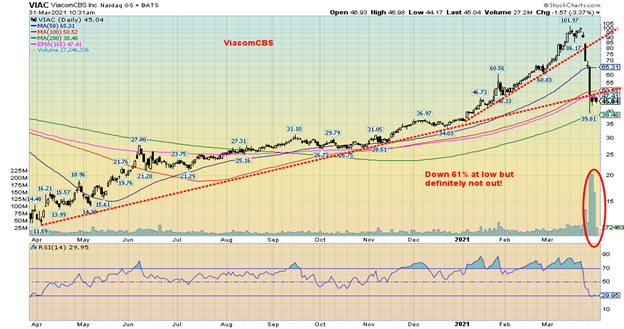
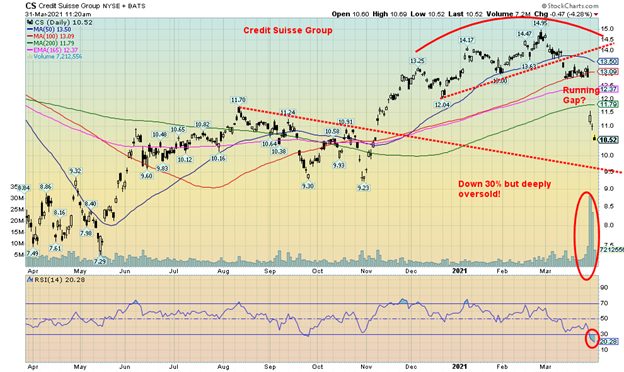
But the two big losers were Credit Suisse and Nomura Securities who face potentially billions in losses. Hwang’s bets included numerous Chinese companies as well as big stakes in ViacomCBS (VIAC) and Discovery Inc. (DISCA), whose stocks fell some 30% or more in the ensuing fire sale. Derivatives were also employed. Apparently, a favourite was one called a “total return swap (TRS)” an equity swap that transfers credit risk and market risk. Hwang’s leverage was not in the same league as LTCM’s, estimated to be only 9:1 debt/equity. But that was enough; Archego could not meet the margin call and was forced to liquidate some $20 billion of stock. Other stocks caught up in the liquidation included Baidu (BIDU), TenCent Music (TME), Vipship Holdings (VIPS), FarFetch (FTCH), IQYI Inc. (IQ), and GSX Techedu (GSX).
As with LTCM, many of Archego’s trades were in the over-the-counter (OTC) market so as to avoid the prying eyes of the market and regulators. As well, the leverage and margin rules are different for institutions than they are for individuals who normally can’t leverage much beyond 0.5:1 debt/equity, although individuals can leverage up further through home equity lines and more. A family office like many hedge funds is under the radar for regulators as they keep the number of investors within limits. (No more than 100 are allowed and usually it is fewer. In Canada, our understanding is it is 50 or fewer).
Archego caused only a ripple in the stock markets as the amounts were small compared to the LTCM debacle. The $20 billion dump of stock from Archego Capital also coincided with the dump of Chinese stocks because of the delisting of Chinese companies on U.S. exchanges. Overall, it doesn’t appear to be having much impact as the markets have subsequently moved to new highs. Keep in mind, however, that for the most part all are bumping up against longer term resistance.
Despite that, the collapse of Archego echoes another early debacle and that may be the real reason to remember Archego’s name. The echo is from the collapse in July 2007 of two hedge funds managed by Bear Stearns. Again, these funds were in highly leveraged situations with sub-prime mortgage-backed securities (MBS) and employing Collateralized Debt Obligations (CD0) and Credit Default Swaps (CDS). Eventually, the collapse of the hedge funds led to the demise of Bear Stearns and its eventual take-out by J.P. Morgan in March 2008. The Bear Stearns collapse was also the start of what became the 2008 financial crisis and the collapse of Lehman Brothers, which also led to the near collapse of the global financial system. Once again, the Fed and the U.S. Treasury had to step into the financial markets to save the day. The problem was not limited to the U.S., and everywhere central banks were forced into the same thing to bail out their financial system. History may not repeat but it often rhymes. So, is this just a one-off? Or a warning sign of something bigger to come further down the road?
Put this against the backdrop of the frenzy of trading sparked by WallStreetBets and RobinHood traders in game stocks and “squeezing the shorts” along with the new frenzy of “non-fungible tokens” and you have the sign of a market that appears as if it can do no wrong. After all the Fed stands poised to move to bail out everyone if the market should even sneeze. In other words, the market believes it is in a “can’t lose” position. The Fed “put” is in place.
Margin debt and FDR redux
As we know, the leverage in the markets is huge. But just how huge? We have previously noted how NYSE margin debt had hit a record high in February (March not yet out) of over $800 billion. That coincided with record prices for the stock exchanges as well. But just how big is it?
The chart below shows the relationship of Security Brokers & Dealers Margin Accounts at Brokers & Dealers to Gross Domestic Product (GDP). The chart below only goes until the end of 2020. At that time the ratio was 22.4%, below the record level seen in Q1 2000 at 28.6% and Q3 2008 at 27.1%. However, it does appear to have broken out to the upside. We are seeing a similar relationship when we look at the margin debt to total stock market capitalization.
Margin Accounts Brokers Dealers/GDP
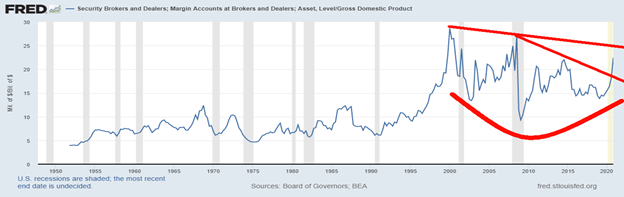
The message seems to be that we are indeed moving into dangerous territory, even if the ratios are not quite at the levels seen in both 2000 and 2008. So, it’s a warning sign. But, given the debacle with Archego, we would not be surprised to see margin debt lower into April and possibly lower in March. Those numbers will be out much later in April from FINRA.
The other big story of the week is the proposed $2.25 trillion U.S. infrastructure and climate plan announced by President Joe Biden, to be paid for with tax hikes on business and the wealthy. The plan would be to tackle badly needed infrastructure upgrades for the U.S.’s crumbling transportation sector (roads, bridges, dams, etc.) and elsewhere. The tax hikes would wipe out most of the tax cuts instituted under former President Donald Trump. The plan could also be a part of a further stimulus for upwards of $4 trillion. Let’s call it FDR redux.
The stock market was responding positively to the news as tech and infrastructure stocks rose and some of the metals that had been weak bounced back. Long-dated interest rates held steady. Despite the ambitious plan it could (will?) receive a rough ride in both Congress and the Senate from the Republicans. Some outsiders were already calling it irresponsible fiscal management à la Zimbabwe. The argument was that it would unleash a fresh round of inflation and spark funds to flee the U.S., putting downward pressure on the U.S. dollar. We are sure that some of the wealthy are already looking at getting funds out of the country.
One thing we have noted over the past few years since the onset of the Trump presidency, the pandemic, and now the Biden presidency is that they are not afraid of adding debt. Under President Trump the U.S. federal debt rose $7.8 trillion or roughly $1.9 trillion/year. Debt/GDP rose from roughly 104% to 130%. While the amount was less than the $9.3 trillion added during the Obama presidency, the Obama presidency was 8 years, not 4, and the average annual increase was under $1.2 trillion/year. That big increase came largely as a result of the 2008 financial crisis that Obama assumed when he took over in January 2009 from the Bush administration.
The U.S. debt/GDP has been a steadily rising number. In 1980 the ratio was 35.4%. The Reagan years were years of ever-increasing debt financing much of it destined for a huge military buildup coupled with the myth of “trickle down economics” aka “Reaganomics” purported by his budget chief David Stockman that by cutting taxes to the wealthy the money would ‘trickle’ to lower groups. By 1990 the ratio was up to 56.6%. When George W. Bush took over in 2000 the ratio had risen to 60.4% slowed as it was by the Clinton surplus years. But by the time Bush II left office the ratio was up to 72.3%. The invasions of Iraq and Afghanistan plus the overall war on terror and again more tax cuts for corporations and the wealthy were major contributors.
The Bush II presidency ended with the 2008 financial crisis, a crisis sparked by deregulation that started under Clinton and continued under Bush. One of the major pieces of deregulation occurred in 1999 with the repeal of most of the Glass-Steagall Act of 1933 that prohibited and created barriers between banks, insurance companies, and, investment dealers so that the pillars could not join together as one. Canada did the same back in the 1980’s that ended the barriers between the four pillars – banks, insurance, securities and trusts. The result was the creation of financial behemoths. The result was these behemoths were effectively allowed to take on far more risk that led to the financial crisis’s that have been a regular occurrence ever since. And these financial institutions are now in the category of “too big to fail”.
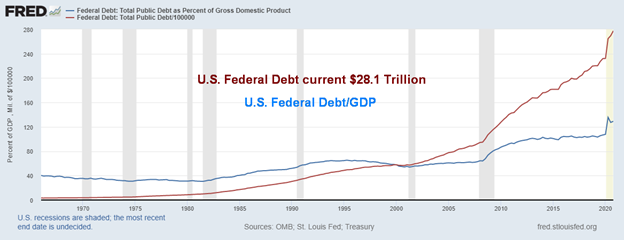
By the time Trump took over the federal debt/GDP ratio was up to 104.8%. Today, as noted, it is 130.0% and is predicted to rise to 190% by 2025. That puts the U.S. in Japan’s territory whose current debt/GDP is 272%.
Japan is what we believe a classic example of the zombie economy. It’s bankrupt but is kept alive on endless amounts of injections of liquidity (QE) thanks to the largesse of the government and the Bank of Japan (BOJ). Much of the debt is purchased by the BOJ and other government entities (monetizing the debt). Amazingly, they have little or no inflation but they also have little or no growth which has been stagnant for upwards of 30 years. Cries that a massive infrastructure program financed by endless amounts of debt will create inflation need only look at Japan. The Fed is buying an increasing amount of the U.S. federal debt, not unlike the BOJ. Will it prevent a sharp rise in inflation? That is to be determined.
If the U.S. federal debt to GDP is a problem at 130% there might also be concerns about household debt to GDP currently at 98%. That is, however, down from the highs recorded in 2006–2007 before the sub-prime housing collapse in 2008. More worrisome is U.S. corporate debt (financial and non-financial) to GDP at 168% with total outstanding of $36.4 trillion. The really worrisome one is non-financial corporate debt, much of which is rated BBB and lower. BBB is the lowest rating level for investment grade debt.
However, given the collapse of Archego, there might also be concerns about financial debt given the billions that may be written off by Credit Suisse and Nomura. Total U.S. debt to GDP is currently 396%. In 2000 that figure was 272%. Unlike the Federal Reserve, households and corporations (financial and non-financial) cannot monetize their debt.
There is considerable support from the public for the planned stimulus spending. Infrastructure spending is direct investment in the economy and could create thousands of jobs. The question is, can it get through Congress and the Senate? They might be happy with the spending but not the planned hikes in taxes on corporations and wealthy as well. In previous administrations, while they talked about slashing deficits under Republican administrations (Reagan, Bush 1, Bush 2, Trump), deficits grew faster than under Democrat administrations (Clinton, Obama). Era of big government? It appears that the era of FDR is back. We’d like to call it FDR Redux.
U.S. Federal Debt (scaled) and U.S. Federal Debt/GDP
What about gold?
All this raises the question of “what about gold?” Over the past several months gold has been on its heels, having fallen almost $400 from the highs seen in August 2020 at $2,089. Silver has also taken a hit, down some $6 since the spike high seen on February 1, 2021 at the height of supposed silver squeeze. Except since then it has been “silver squeeze, what silver squeeze?”
Gold and silver have been falling for a few reasons. The U.S. economy is outperforming the EU and Japan (but not China), and long interest rates have been rising, widening interest rate spreads with the EU and Japan. There are also problems in some emerging economies, particularly in Latin America and Africa. The result is that funds have been flowing into the U.S., buying U.S. dollars and investing (parking?) their funds in the U.S. stock and bond markets. The correlation between the U.S. dollar and interest rates and gold is strong. The dollar and interest rates go up; gold goes down. Not helping as well was the liquidation of Archego Capital. When they are selling to cover offside positions, everything is fair game, including gold and gold stocks. There is, however, little evidence that it is physical gold being sold. Instead, it is primarily paper gold being sold.
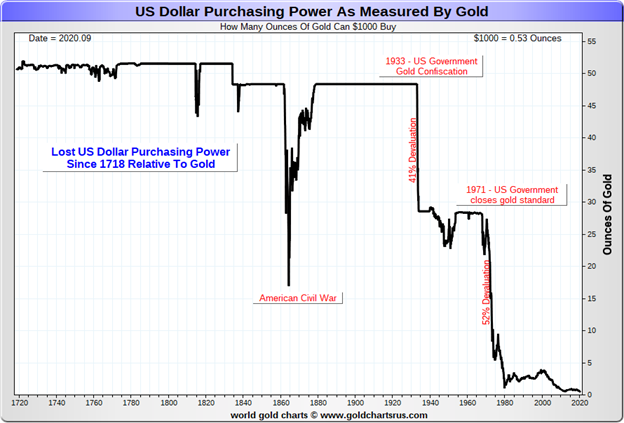
But the reasons for owning gold have not changed despite the recent weakness. Gold remains a hedge against both inflation and deflation; it is a portfolio diversifier given its non-correlation with other assets including stocks and bonds; it is a long-term store of value given its use as money over 3,000 years; it is protection during periods of geopolitical and macroeconomic uncertainty; it protects against currency devaluation and loss of purchasing power (the U.S. dollar has lost 98% of its purchasing power since 1971 when the world was taken off the gold standard); it is in short supply and it takes years to go from discovery of gold to actually building a mine; it has seen increasing demand as emerging market economies have increased their wealth; and demand comes culturally as well, particularly in India and China, the two most populated countries in the world.
Gold remains an integral part of central bank reserves and many central banks including Russia, China, and Turkey have been adding to their reserves in recent years. Central banks have added over 2,000 metric tonnes in the past decade alone. The Basel III rules that have recently gone into effect recognize gold as a Tier 1 capital asset for banks. The Bank for International Settlements (BIS), the central bank for the central banks recognizes the holding of physical gold as a reserve asset equal to cash. The U.S. continues to hold the largest central bank gold reserves in the world with 8,133.5 metric tonnes (261.5 million troy ounces).
While some see gold as merely a substitute for Bitcoin (even Fed Chair Jerome Powell said that), the two cannot be compared. Gold is tangible, Bitcoin is not; gold has uses in jewellery and electronics, Bitcoin has no industrial or consumer use; gold cannot be manufactured, unlike a company adding more shares or even Bitcoin which could also increase the supply at any given time; both gold and Bitcoin are decentralized and neither is issued by a central bank; gold has been around for over 3,000 years while Bitcoin has been in existence for only a decade or so; gold is a store of value while Bitcoin has few uses and has turned into primarily a speculative instrument that is subject to hacking and scams.
Setting aside Bitcoin’s spectacular bubble run-up in the past few years, gold has been the best performing asset since 2000. There are periods where the others (stocks and bonds) outperform as we have witnessed recently; however, gold has, over the very long term, outperformed. Since 1971 when the gold standard ended and gold became free trading, gold is up almost 4,800% vs. the S&P 500 gaining around 3,900%. The chart below shows gold’s performance from 2000 to March 31, 2021. Gold is up 413.3%, the TSX up 122.5%, the TSX Financials (TFS) are up 273.4%, silver is up 289.8% while the TSX Gold Index (TGD) is up 229.6%. Surprisingly, gold stocks that are leveraged to the price of gold have underperformed gold during the period.
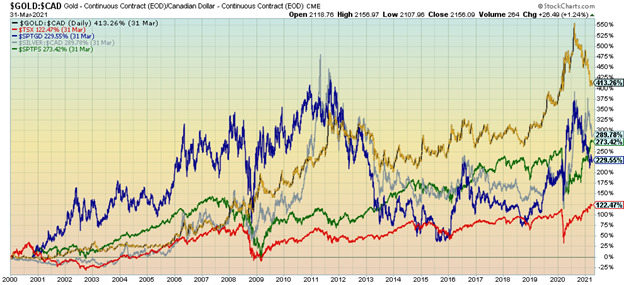
The U.S. dollar has lost roughly 98% of its purchasing power since the world was taken off the gold standard in August 1971 by former president Richard Nixon. All major currencies including the euro, the pound sterling, the Japanese yen, and the Canadian dollar have also lost comparable purchasing power. Other currencies have fared worse. Historically, all fiat currencies eventually collapse.
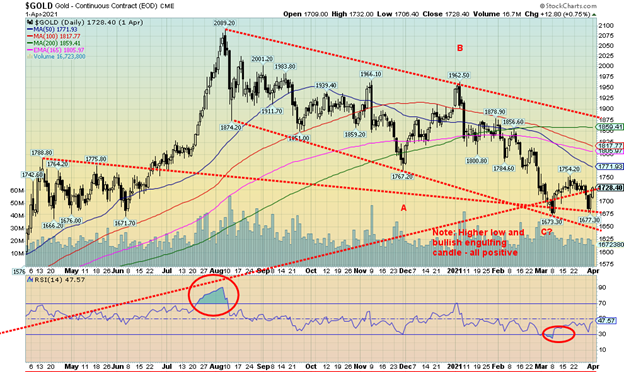
We believe gold is continuing to try and find its 31.3-month cycle low. The low, according to cycles analyst Ray Merriman (www.mmacycles.com), was expected to be centered around April 2021 +/- 5 months. We are now into the heart of that anticipated cycle low. The low is counted from the major cycle low of December 2015. The 7.83-year cycle divides generally into 3 cycles of 31.3 months. The first 31.3-month cycle low occurred in August 2018, 32 months after the December 2015 major low. Grant you, the period for this low does extend out to September 2021 so until we confirm the recent low at $1,673.30 seen on March 8, 2021 the jury is out.
On Wednesday this past week, gold and silver both rallied strong to the upside with gold rising some $20+. It was followed by another strong rebound on Thursday and another $20+ day for gold. Wednesday’s action left a bullish engulfing candle on the charts, signalling that a low might have been made. Further, gold made a higher low while silver made new lows for the recent down move. As well, the gold stocks rebounded, closing higher on the week and making a higher low. The first confirmation that a low might be in is when gold can clear and close over $1,750 and silver over $26.50. Further resistance exists up to $1,875. A major breakout could occur above that level. What’s key is that the recent low holds, as a break of $1,670 could signal a collapse to $1,575/$1,600. Overall, we were encouraged by the positive action this past week that gold may have hit a low.
Stock markets continue to trade in record territory. Many believe this rally is never-ending. Sentiment is at or near bullish extremes. Gold sentiment is starting to approach bearish extremes. Gold is once again just a barbarous relic. Households are at record levels for allocation to the stock market. Other indictors for the stock market such as price-to-sales, price-earnings (PE), the Buffett indicator (stock market cap/GDP ratio) are at or near record levels that were seen prior to major declines. But after all the Fed has their back. We are in a “can’t lose” world. Or are we?
MARKETS AND TRENDS
| % Gains (Losses) Trends | ||||||||
| Close Dec 31/20 | Close Apr 1/21 | Week | YTD | Daily (Short Term) | Weekly (Intermediate) | Monthly (Long Term) | ||
| Stock Market Indices | ||||||||
| S&P 500 | 3,756.07 | 4,019.87 (new highs) | 1.1% | 7.0% | up | up | up | |
| Dow Jones Industrials | 30,606.48 | 33,153.21 (new highs) | 0.2% | 8.3% | up | up | up | |
| Dow Jones Transports | 12,506.93 | 14,748.38 (new highs) | 1.0% | 17.9% | up | up | up | |
| NASDAQ | 12,888.28 | 13,480.11 | 2.6% | 4.6% | neutral | up | up | |
| S&P/TSX Composite | 17,433.36 | 18,990.32 | 1.3% | 8.9% | up | up | up | |
| S&P/TSX Venture (CDNX) | 875.36 | 960.84 | 1.9% | 9.8% | down | up | up | |
| S&P 600 | 1,118.93 | 1,340.30 | 0.7% | 19.8% | up | up | up | |
| MSCI World Index | 2,140.71 | 2,226.34 | 0.2% | 4.0% | up (weak) | up | up | |
| NYSE Bitcoin Index | 28,775.36 | 58,977.90 | 10.5% | 105.0% | up | up | up | |
| Gold Mining Stock Indices | ||||||||
| Gold Bugs Index (HUI) | 299.64 | 276.39 | 3.1% | (7.8)% | neutral | down | up | |
| TSX Gold Index (TGD) | 315.29 | 295.20 | 3.1% | (6.4)% | up (weak) | down | up | |
| Fixed Income Yields/Spreads | ||||||||
| U.S. 10-Year Treasury Bond yield | 0.91 | 1.67% | (0.6)% | 83.5 | ||||
| Cdn. 10-Year Bond CGB yield | 0.68 | 1.51% | 0.7% | 122.1% | ||||
| Recession Watch Spreads | ||||||||
| U.S. 2-year 10-year Treasury spread | 0.79 | 1.51% | (2.0)% | 91.1% | ||||
| Cdn 2-year 10-year CGB spread | 0.48 | 1.28% | 1.6% | 166.7% | ||||
| Currencies | ||||||||
| US$ Index | 89.89 | 92.95 | 0.2% | 3.4% | up | up (weak) | down | |
| Canadian $ | 0.7830 | 0.7970 | 0.4% | 1.7% | up (weak) | up | up | |
| Euro | 122.39 | 117.78 | (0.2)% | (3.8)% | down | down (weak) | up | |
| Swiss Franc | 113.14 | 106.13 | (0.4)% | (6.2)% | down | down | up | |
| British Pound | 136.72 | 138.33 | 0.3% | 1.2% | down (weak) | up | up | |
| Japanese Yen | 96.87 | 90.42 | (0.9)% | (6.7)% | down | down | down | |
| Precious Metals | ||||||||
| Gold | 1,895.10 | 1,728.40 | (0.2)% | (8.8)% | down | down | up | |
| Silver | 26.41 | 24.95 | (0.6)% | (5.5)% | down | neutral | up | |
| Platinum | 1,079.20 | 1,208.60 | 2.6% | 12.0% | neutral | up | up | |
| Base Metals | ||||||||
| Palladium | 2,453.80 | 2,654.20 | (0.7)% | 8.2% | up | up | up | |
| Copper | 3.52 | 3.99 | (2.0)% | 13.4% | neutral | up | up | |
| Energy | ||||||||
| WTI Oil | 48.52 | 61.45 | 0.8% | 26.7% | neutral | up | up | |
| Natural Gas | 2.54 | 2.6 | 0.8% | 3.9% | down | neutral | neutral |
New highs/lows refer to new 52-week highs/lows and in some cases all-time highs.
U.S. job numbers
We confess we had not anticipated that the U.S. employment numbers would be reported on April 2, given it was the Good Friday holiday. The expectation was that it would be the following Friday April 9 as has been the case in the past. But reported they were and while they were not a complete surprise, they were better than expected.
Nonfarm payrolls rose 916,000 in March, well above the expected 647,000. February nonfarm was revised upwards to 468,000. The job gains in March were led by gains in leisure and hospitality, public and private education and construction. It sounds great, but recall that the U.S. lost 22,362 thousand back in March/April 2020 and they have now recovered 13,959 thousand (62.4%), leaving them still short 8,403 thousand. In other words, still a long way to go. Despite the markets being closed, S&P 500 futures were trading higher and indications were that the U.S. dollar was also trading higher.
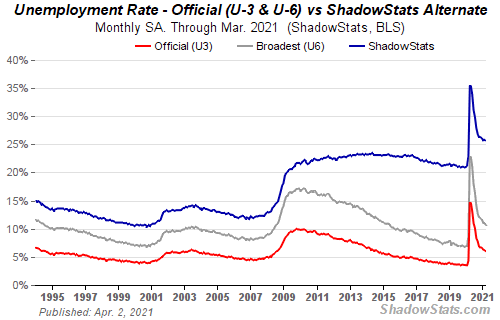
The headline unemployment rate (U3) fell to 6% down from 6.2%. The U3 rate is the one most reported and commented on. But it only counts people who are without jobs that are actually looking for work. To satisfy that requirement they must have been looking for a job over the previous four weeks. The underemployment rate (U6)—defined as the U3 plus those working part-time wanting full-time and unemployed less than one year—dropped to 10.7% from 11.1%. U6 is also known as the real unemployment rate.
The Shadow Stats (www.shadowstats.com) unemployment rate — defined as the U6 unemployment plus those defined out of the labour force in 1994 and unemployed more than one year and wanting work but not looking—slipped to 25.7% from 25.8%. Given a labour force of 160,558 (up 347 thousand in March from February) the U3 unemployment rate translates into 9,633 thousand unemployed (some 4 million higher than in February 2020) and the U6 unemployed translates into 17,180 thousand, a differential of 7,547 thousand between the two officially reported unemployment rates. Of the total labour force, 125,803 thousand were employed full time, up 935 thousand on the month, while those working part-time were at 25,078 thousand, down 31 thousand on the month. Those unemployed more than 27 weeks or more was 4.2 million, up by 3.1 million from February 2020. (Source: www.stlouisfed.org)
The labour force participation rate rose to 61.5% from 61.4% but is down 1.8% from February 2020 while the employment population ratio was 57.8% vs. 57.6% but still down 3.3% from February 2020. In other words, the population has grown but the number of people actually working has fallen. All that helps to translate the U3 unemployment lower than what it might have been if the participation rates and the employment population rates had been higher.
Of those not in the labour force but who want a job, the number was at 6.9 million in March which is up 1.8 million since February 2020. Of those not in the labour force but wanting a job and marginally attached, the number was at 1.9 million in March, up 416 thousand since last February 2020. Those not in the labour force but wanting a job now was at 6,850 thousand in March, down 83 thousand from February. Those not in the labour force totaled 100,860 thousand in March vs. 100,708 in February. Some 55.3 million are retirees while there are 9.6 million disabled and some 10.5 million are students ages 16–19 or at least considered not in the labour force.
Also, in March, some 11.4 million reported they were unable to work because their employer closed or lost business. Some 10.2% did receive at least some pay.
The number of hours worked rose to 34.9 from 34.6 but average earnings fell 0.1% as a result of the new jobs being lower paying. The minimum wage is still $7.25. In 1970 the minimum wage adjusted for inflation was $10.85. It is estimated that by raising the minimum wage to $15, as many are requesting, this would lift 32 million up, thus reducing the impact on poverty, wages, and inequality. It is noted that the 1% control 31.4% of net worth, 38.2% is controlled by the 90–99 percentile, and 28.3% is controlled by the 50–99 percentile. The under-50 percentile controls a mere 2.0% of assets. The 1% hold 53.1% of all equities and mutual funds. (Source: www.stlouisfed.org)
The March employment report is considered to be quite good. However, the U.S. remains well short of employment levels before the pandemic and many economists admit there is still a long way to go. Structural unemployment continues to rise along with the number not in the labour force but wanting work who are discouraged. If the numbers continue to be good, that encourages more to re-enter the labour force seeking work. That in turn raises the participation rate and could negatively impact the unemployment rate (U3). The Fed remains quite accommodative and will continue to be so until at least 2023. The U.S. is moving along with the vaccines which is also being touted as why employment will continue to expand as things open. The question is, how much permanent damage has been done and how many companies are on life support? As well, it is unknown at this time how the third wave of the pandemic will impact employment, given the strength of the variants. A third wave is not unusual for pandemics as the 1918–1920 Spanish flu came in at least three waves, and history shows that three waves were present in other pandemics. The question is the severity of the third wave which appears to be just getting underway.
Canada reports its job numbers next Friday April 9.
—
(Featured image by Bullion Vault CC BY-ND 2.0 via Flickr)
DISCLAIMER: This article was written by a third-party contributor and does not reflect the opinion of Born2Invest, its management, staff or its associates. Please review our disclaimer for more information.
This article may include forward-looking statements. These forward-looking statements generally are identified by the words “believe,” “project,” “estimate,” “become,” “plan,” “will,” and similar expressions. These forward-looking statements involve known and unknown risks as well as uncertainties, including those discussed in the following cautionary statements and elsewhere in this article and on this site. Although the Company may believe that its expectations are based on reasonable assumptions, the actual results that the Company may achieve may differ materially from any forward-looking statements, which reflect the opinions of the management of the Company only as of the date hereof. Additionally, please make sure to read these important disclosures.
David Chapman is not a registered advisory service and is not an exempt market dealer (EMD) nor a licensed financial advisor. We do not and cannot give individualized market advice. David Chapman has worked in the financial industry for over 40 years including large financial corporations, banks, and investment dealers. The information in this newsletter is intended only for informational and educational purposes. It should not be considered a solicitation of an offer or sale of any security. The reader assumes all risk when trading in securities and David Chapman advises consulting a licensed professional financial advisor before proceeding with any trade or idea presented in this newsletter. David Chapman may own shares in companies mentioned in this newsletter. We share our ideas and opinions for informational and educational purposes only and expect the reader to perform due diligence before considering a position in any security. That includes consulting with your own licensed professional financial advisor.


The TopRanked.io Weekly Affiliate Marketing Digest [The Top VPN Affiliate Programs Roundup]
Want to be let in on a little secret about two massive affiliate opportunities you can take advantage of today?...


Sustainable Finance Faces Hurdles as Green Asset Ratio Reforms Fall Short of Full Transparency
The Green Asset Ratio (GAR) measures banks' alignment with the EU Taxonomy but remains low due to methodological flaws and...


XRP Hits New All-Time High Amid U.S. Crypto Policy Shift and Ripple’s Expansion
XRP surged past its 2018 all-time high, reaching $3.65 amid renewed political support for crypto in the U.S. under Trump....


Germany Moves to Curb Medical Cannabis Abuse, Sparking Access Concerns
Medical cannabis imports in Germany have surged, but health insurance-covered prescriptions remain low. Easy online access raises concerns about abuse...


JPMorgan’s Data Fees Shake Fintech: PayPal Takes a Hit
JPMorgan Chase will charge fintechs for customer data, threatening business models reliant on free access. PayPal’s stock plunged 5.7% after...
 |
|
 |  |
 |
|
-

 Biotech4 days ago
Advancing Sarcoma Treatment: CAR-T Cell Therapy Offers Hope for Rare Tumors
-

 Impact Investing2 weeks ago
Shein Fined €40 Million in France for Misleading Discounts and False Environmental Claims
-

 Impact Investing1 day ago
Nidec Conversion Unveils 2025–2028 ESG Plan to Drive Sustainable Transformation
-

 Impact Investing1 week ago
Vernazza Autogru Secures €5M Green Loan to Drive Sustainable Innovation in Heavy Transport