Business
Could a constitutional crisis grip the U.S.?
We look at the vaccine and ask is a constitutional crisis possible. We look at some history of constitutional crisis in the U.S. and the effects on stocks and gold. Our “Chart of the Week” asks have commodity prices bottomed and is a new commodity boom about to get underway? Cycles and valuations suggest it is very possible. It was a fascinating week and we are still 65 days away from inauguration.

Good news. There is a potential vaccine. Bad news. There is the potential for a constitutional crisis. First the good news. The announcement by Pfizer (PFE-NYSE) that their Phase 3 COVID-19 vaccine trial is more than 90% effective is a potential game changer even though it may also be too good to be true. As a reminder, there are four phases drugs must go through. But getting through Phase 3 is quite important as now the testing of the drug can expand to cover a lot more people to help determine how safe it might be and how durable it is.
We suppose the news couldn’t come at a better time, considering that cases have been soaring, averaging well over a half-a-million a day. There are over a million new cases every two days. In the U.S. they have been averaging over 125,000 cases every day and some believe they could soon see 200,000 cases in a day (the high so far was November 13 with almost 188,000 cases in the U.S.). The death toll also keeps on rising, although deaths as a percentage of cases have fallen. A reminder, though, is that the vaccine is still not a done deal and it could still take longer than everyone expects. The expectation now is possibly late in Q1. By that time there could be over 75 million more cases and upwards of another million or more dead. Nor do we know what the impact on the economy is going to be this time around. All indications are that it won’t be good.
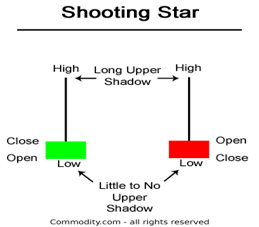
Nonetheless, the stock market loved it as the S&P 500, the Dow Jones Industrials (DJI), the Dow Jones Transportations (DJT), and the NASDAQ all leaped to new all-time highs on November 9. There was a great rotation as value stocks, banks, energy, and travel all soared but the stay-at-home stocks and tech stocks faltered. Gold fell and bond yields jumped. However, a funny thing happened. The tech stocks all reversed down and the NASDAQ that had leaped to new all-time highs closed sharply lower on the day, putting in an outside possible key reversal day to the downside. The other indices opened, soared to their new all-time highs, then also reversed and closed up on the day but below their opening range, leaving what we call a possible bearish shooting star pattern on the charts. Since then the all-time highs have remained intact. (Note: we discuss this further under our usual presentations of the S&P 500, DJI, and NASDAQ).
So, have the markets priced in the potential for a vaccine already? The potential for a large stimulus package in the U.S. is also on hold because of the uncertainty that remains over the election. As well, hospitals are already strained and things are bound to get worse. Questions remain. Will the vaccine protect against severe COVID-19 along with moderate or mild cases? What is the impact on different demographic groups? When will the FDA review be completed? The expectation is in December. How often will it be necessary to take the vaccine? How many will be willing to take the vaccine? How do we know there won’t be adverse side effects? None of these questions have been properly answered.
The vaccine won’t be here for distribution tomorrow. Restaurants, airlines, cruise ships, theatres, shopping malls, gyms, offices, and more are not going to suddenly fill up tomorrow just because a vaccine may be coming. Given the current huge numbers, many may be closing down or if lockdown is brought back, they will be shutting down. Oil demand is not going to suddenly soar. The IEA sees demand down by at least 8.8 million bpd below 2019 levels. The world is not returning to normal any time soon. And, if the stimulus package falters given election uncertainty, then millions could be facing bankruptcy and homelessness. And what if the 90% efficacy proves to be only 50%? What then?
Case Shiller PE Ratio
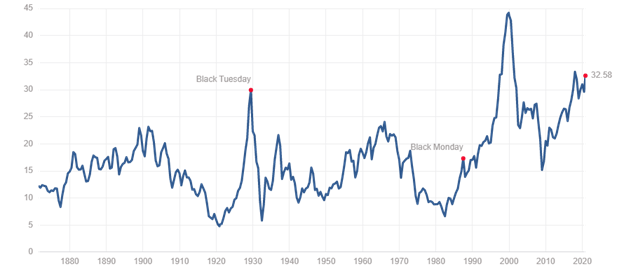
Already, many market ratio measurements are at or near all-time highs as shown by the Case-Shiller PE ratio above. Others such as Price to Book and Price to Sales Ratio are at the highest levels in twenty years. No, none of this means the market is about to take a tumble but it does send a warning. And no, it doesn’t appear to have impacted earnings as, overall, 52% of S&P 500 corporations have reported higher quarterly profits compared to a year ago. Communications services companies lead the way with about 67% of them reporting higher quarterly profits. As we say, is this time different? We know the markets have been fueled by record low interest rates that aren’t set to rise for years, plus trillions of dollars of stimulus through the Fed (QE) and from the governments to combat the negative effects of COVID-19.
Still, despite the big announcement, hospital beds are filling up rapidly. The numbers are rising and are staggering, particularly in the U.S., even as they are plateauing elsewhere, particularly in Europe. Lockdowns are underway again and that alone will slow the economy down. Yet rhetoric and clashes are also increasing over those opposed to the measures. As well, another company, Moderna (MRNA-NASDAQ) is also jumping into the vaccine race as they too may be in a position to provide one that is just as good as Pfizer. Scientists are also working overtime on a solution in Asia and Europe.
However, is there another potential crisis on the horizon? The election may be over and the projection is that Joe Biden will become the 46th President of the U.S. Congratulations have come from leaders all over the world, his transition team is set and ready to go, and interviews are being conducted for key cabinet posts.
However…
- Donald Trump remains president until January 20, 2021.
- The president has not conceded and top Republicans back him.
- The president claims the election was stolen that it was fraudulent. Again many top Republicans back him.
- U.S. states have until December 8 to resolve all controversies and disputes and to certify the election.
- The Electoral College doesn’t meet until December 14 to confirm the EC vote.
- Legal challenges, which are a right, are underway in Michigan, Pennsylvania, Arizona, Nevada, and Georgia.
- Recounts are underway in Georgia (announced by Governor) and Wisconsin (requested).
- The White House has instructed the General Services Administration to not sign off for any transition of government.
- The president has unleashed a purge of the Defense department and other departments that includes many top civilians of the Pentagon. More purges could soon follow.
- The Secretary of State has stated publicly that “There will be a smooth transition to a second Trump administration.” The claim is that he was kidding.
Are these things that go bump in the night as the U.S. prepares for its next inauguration on January 20, 2021? Or is this the basis for a pending constitutional crisis? Ours is not to determine whether that could happen or whether it is justified but instead to pose the question, what if it did?
The U.S. does have some history of constitutional crisis. There are six that are noted: the 1832 Nullification Crisis whereby President Jackson authorized federal troops in South Carolina to enforce federal laws; the 1841 presidential crisis after the sudden death of William Henry Harrison; the secession of seven Southern states in 1861 that triggered the American Civil War (1861–1865); the 1876 presidential election that saw disputed elections in three states; the 1952 steel strike following the nationalization of the steel industry on the basis of preventing a strike that would impede the Korean War; and the 1972–1974 Watergate Scandal.
Of interest to us are two: the secession crisis of 1861 and the Watergate Scandal of 1972–1974. The secession of U.S. states and the Civil War was actually, in the end, positive for the stock market as the war effort required a huge buildup of arms to fight the war. The stock market actually rose during the Civil War as factories, primarily in the north, churned out arms. The war, like all wars, was good for business. The interesting thing that did occur is that gold, which was fixed at $20.67/ounce because of the gold standard actually soared in price, more than doubling to $46.36 by 1864. After the war, gold retreated in price, eventually going back to $20.67 by 1879. Gold soared because of the suspension of specie payments by the U.S. Treasury as the government was no longer able to meet its obligations in coin. Paper money fell in value while gold rose in price. By 1862 gold was trading like a commodity in New York and as it was free-trading and in demand, it rose sharply over the next few years.
The Nixon years were against the backdrop of the Vietnam War and protests on the streets of the U.S. The U.S. faced a mild recession in 1969–1970 following Nixon’s election in 1968. The recession came after a long period of expansion and was sparked by rising inflation, tightening monetary policy, and an attempt to bring down budget deficits. But it was Watergate and Nixon’s re-election in 1972 that helped spark the constitutional crisis and a stock market collapse.
The Watergate break-in occurred in June 1972. With the Watergate investigation fully underway in 1973, it became increasingly clear that a cover-up was underway and it went right to the top into the president’s office. The infamous “Saturday Night Massacre” came in October 1973 when Nixon ordered officials to fire the special prosecutor looking into Watergate. Instead of firing the prosecutor the officials refused and resigned. Another official carried out the firing. The new prosecutor continued the investigation and by March 1974 several Nixon aides were being indicted. By May, impeachment proceedings were underway. In early August 1974 the “smoking gun” of a tape between Nixon and H.R. Haldeman, Nixon’s Chief of Staff, came to light, showing it was their intention to block the investigation. With support crumbling, Nixon resigned on August 9, 1974 rather than face certain impeachment.
By what may have been pure coincidence, the Arab oil embargo was underway in October 1973. Did the stock market fall because of the oil embargo or because of Watergate or both? More likely the oil embargo played a bigger role, but Watergate didn’t help as there was a loss of confidence in government. Overall, from October 1973 to August 1974, the DJI fell 37%. Given the top was in January 1973 and the stock market didn’t bottom until December 1974 the total decline for the DJI was 45%. The recession was underway by November 1973 and lasted until March 1975. At the time it was steepest recession since the Great Depression.
While the stock market was falling, gold was rising. Gold, which had been set free-trading in August 1971 when Nixon took the world off the Bretton Woods gold standard, rose 149% from the time of the Watergate break-in in June 1972 to Nixon’s resignation in August 1974. Throughout this period the U.S. dollar was also falling against major currencies after the collapse of Bretton Woods and the dollar peg in March 1973. That also helped fuel gold’s rise.
Gold up, stocks down. While the connection between Watergate and the rise of gold and the collapse of the stock market is tenuous, it did occur. A constitutional crisis today could see a U.S. dollar crisis as confidence in the U.S. falls and that in turn could spark a rise in gold prices and a collapse in the stock market. The potential for a constitutional crisis today cannot be dismissed out of hand, even if at this time the possibility appears to be a long shot.
The Nixon Years 1968–1975

The Nixon Years Gold 1968–1975

Chart of the Week

Have commodities bottomed? While it is not conclusive, there is a good chance that commodities have made a major bottom. Above is the CRB Index, one of the more widely followed commodity indices. The CRB Index is made up of 19 different commodities with a weighting of 39% energy (crude oil, heating oil, natural gas, RBOB gasoline), 41% agriculture (cocoa, coffee, corn, cotton, soybeans ,sugar, wheat, lean hogs, live cattle, orange juice), 7% precious metals (gold, silver), and 13% industrial metals (aluminum, copper, nickel).
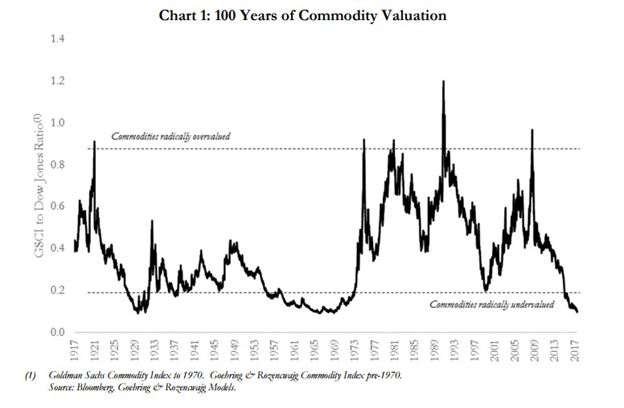
Commodities go through long periods of boom and bust. Two charts below demonstrate that. The first chart is a 100 years of commodity valuation. The chart only goes to 2017 but shows at the time that commodities were undervalued as much as they have ever been over the past 100 years. We are now three years later and, as the chart above shows, the CRB Index is lower today than it was in 2017. The odds of the undervaluation having improved during that time are probably nil.
The second chart is a very long-term chart of commodity prices dating back to 1770. The chart is current only to 2013, but again our monthly chart above shows commodity prices have been in a steady downward deterioration since then. Different commodity groups tend to have their own cycles so there may be periods where some commodities are rising in price while others are falling. Cycles are caused by overproduction, war, and shortages, as each plays a role in how they impact supply and demand. But one thing that the long term shows us is that there are multi-decade periods of price-ascents and price-decline. The big trends occur when all four commodity sectors are rising or falling generally together.
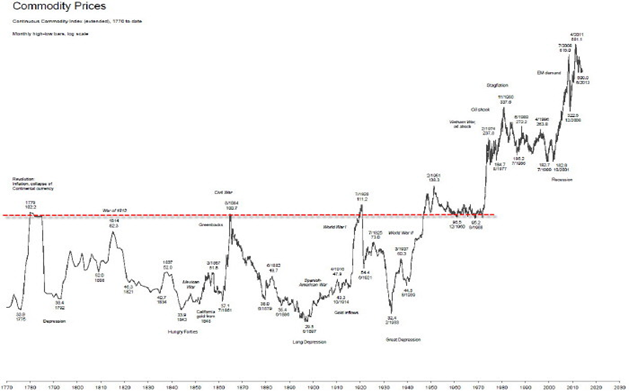
There have been numerous studies on commodity cycles. Cycles are usually measured trough to trough. One study we saw showed during the 20th century there have been four commodity cycles ranging in length from 29–33 years. The first cycle identified ran from 1899–1932 (33 years), the second 1933–1961 (29 years), the third 1962–1995 (29 years) and the fourth 1996-present (24 years). By that measurement this cycle appears to be shorter than the others; however, since we haven’t received any confirmation that we are indeed in a new up cycle, the current rebound may be just another bear market rally with a final low or double bottom to come sometime by 2030.
What we decided to do here was take the most common cycles and see how well they line up for the CRB. The major long-term cycles are 75 years (range 55–88 years), its half cycle 37.5 years (range 26–44 years) and its half cycle 18.75 years (range 13–22 years, although most fall between 15–21 years). Using the chart dating from 1775 we thought we’d see how well it lines up. Cycles are not precise which is why there are wide ranges. One has to use other indicators to tell us when a cycle has bottomed or topped. For the cycle to be valid, the next trough should fall within the ranges noted above. While the chart above doesn’t have the best clarity, we can, however, see important trough dates on the chart.
| 75 Years (55–88 years) | 37.5 Years (26–44 years) | 18.75 Years (13–22 years) |
| 1775 | 1775 | 1775 |
| 1848 (73 years) | 1808 (33 years) | 1792 (17 years) |
| 1921 (73 years) | 1843 or 1848 (35 or 40 years) | 1808 (16 years) |
| 1999 (78 years) | 1886 or 1897 (43 or 49 years?) | 1834 (26 years?) |
| Next due 2054–2087 | 1921 (35 years from 1886) | 1848 (14 years) |
| 1960 (39 years) | 1861 (13 years) | |
| 1999 (39 years) | 1879 (18 years) | |
| Next due 2025–2043) | 1897 (18 years) | |
| 1921 (24 years?) | ||
| 1933 (12 years?) | ||
| 1960 (27 years?) | ||
| 1977 (17 years) | ||
| 1999 (22 years) | ||
| Next due 2012–2021 |
There are a few occasions where the cycle was longer than the expected range (shown with a ?). However, we note that any cycle that went on longer than usual was usually followed by a short cycle. When you average the two, they fall within the range. The 18.75-year cycle would appear to support the possibility of major low in 2020 as it would be 21 years from 1999. If 2020 turns out to be a low, then the next 18.75-year cycle would fall somewhere between 2033 and 2042. That would fit well with the next 37.5-year cycle due 2025–2043.
Confirmation that the commodity cycle has made a bottom would not happen until the CRB Index first clears above 180, then above 200. Rising commodity prices have implications for inflation and interest rates as both would be expected to rise. We have been experiencing rising prices for precious metals and industrial metals. Agriculture prices have also been on the rise. If energy prices were turn around from their current depression, then there is a good chance we could have all four commodity sectors rising at the same time and confirming our next commodity boom.
MARKETS AND TRENDS
| % Gains (Losses) Trends | ||||||||
| Close Dec 31/19 | Close Nov 13/20 | Week | YTD | Daily (Short Term) | Weekly (Intermediate) | Monthly (Long Term) | ||
| Stock Market Indices | ||||||||
| S&P 500 | 3,230.78 | 3,585.15 (new highs) | 2.2% | 11.0% | up | up | up | |
| Dow Jones Industrials | 28,645.26 | 29,479.81 (new highs) | 4.1% | 3.3% | up | up | up | |
| Dow Jones Transports | 10,936.70 | 12,085.32 (new highs) | 4.1% | 10.9% | up | up | up | |
| NASDAQ | 9,006.62 | 11,829.29 (new highs) | (0.6)% | 31.8% | up | up | up | |
| S&P/TSX Composite | 17,063.53 | 16,675.64 | 2.4% | (2.3)% | up | up | up | |
| S&P/TSX Venture (CDNX) | 577.54 | 736.37 | (0.8)% | 27.5% | up | up | up (weak) | |
| S&P 600 | 1,021.18 | 994.29 | 7.5% | (2.6)% | up | up | up (weak) | |
| MSCI World Index | 2,033.60 | 1,990.38 | 3.6% | (2.1)% | up | up | neutral | |
| NYSE Bitcoin Index | 7,255.46 | 16,136.09 (new highs) | 4.2% | 122.4% | up | up | up | |
| Gold Mining Stock Indices | ||||||||
| Gold Bugs Index (HUI) | 241.94 | 315.20 | (8.9)% | 30.3% | up | up | up | |
| TSX Gold Index (TGD) | 261.30 | 345.57 | (8.2)% | 32.3% | up | up | up | |
| Fixed Income Yields/Spreads | ||||||||
| U.S. 10-Year Treasury yield | 1.92 | 0.83 | (4.6)% | (56.8)% | ||||
| Cdn. 10-Year Bond yield | 1.70 | 0.65 | (3.0)% | (61.8)% | ||||
| Recession Watch Spreads | ||||||||
| U.S. 2-year 10-year Treasury spread | 0.34 | 0.68 | (4.2)% | 100.0% | ||||
| Cdn 2-year 10-year CGB spread | 0 | 0.38 | (2.6)% | 3,800.0% | ||||
| Currencies | ||||||||
| US$ Index | 96.06 | 92.75 | 0.6% | (3.5)% | down | down | down | |
| Canadian $ | 0.7710 | 0.7610 | (0.9)% | (1.2)% | up (weak) | up | neutral | |
| Euro | 112.12 | 118.33 | (0.4)% | 5.5% | up | up | up | |
| Swiss Franc | 103.44 | 109.55 | (1.3)% | 5.9% | neutral | up | up | |
| British Pound | 132.59 | 131.97 | 0.3% | (0.4)% | up | up | neutral | |
| Japanese Yen | 92.02 | 95.62 | (1.2)% | 3.9% | up | up | up | |
| Precious Metals | ||||||||
| Gold | 1,523.10 | 1,886.20 | (3.3)% | 23.8% | down | up | up | |
| Silver | 17.92 | 24.77 | (3.5)% | 38.2% | up | up | up | |
| Platinum | 977.80 | 896.00 | (0.4)% | (8.4)% | up | neutral | neutral | |
| Base Metals | ||||||||
| Palladium | 1,909.30 | 2,329.70 | (6.8)% | 22.0% | neutral | up | up | |
| Copper | 2.797 | 3.18 | 1.0% | 13.7% | up | up | up | |
| Energy | ||||||||
| WTI Oil | 61.06 | 40.13 | 8.1% | (34.3)% | up (weak) | up (weak) | down | |
| Natural Gas | 2.19 | 2.99 | 3.5% | 36.5% | up | up | up |
Note: For an explanation of the trends, see the glossary at the end of this article.
New highs/lows refer to new 52-week highs/lows.
What a week. The market opened on Monday with the announcement that Pfizer had a vaccine that had 90% efficacy. The market gapped open, shot up to a new all-time high, then reversed and closed below the opening level. Still, a big gain on the day against the backdrop that someone might have a vaccine for the COVID-19. But that intraday reversal left what we call a shooting star on the charts. We show the example below. A shooting star is a Japanese candlestick formation that is created when the low, the open, and the close are roughly the same price. It leaves what is a long stick-like formation above the lower body. The formation can close either above the opening level or below it. In this case, it closed below the opening level. The stick-like portion is usually at least twice the length of the small body at the bottom. The pattern is viewed as a bearish reversal candlestick pattern. And, coming as it did at new all-time highs, it could take on a more ominous tone.
Since Monday, the market has not recovered that high. That’s not to say it won’t. In the end the S&P 500 gained 2.2% on the week. The U.S. markets mostly made fresh all-time highs. The Dow Jones Industrials (DJI) gained 4.1%, the Dow Jones Transportations (DJT) was up 4.1% as well, but the NASDAQ lost 0.6%, reversing on Monday and closing lower (more on the NASDAQ to follow). U.S. indices making new all-time highs along with the DJI, DJT, and the S&P 500 were: Value Line, the Dow Jones Composite (DJC), the S&P Equal Weight Index, the S&P 400 (mid-cap), the Wilshire 5000, and the Russell 1000, 2,000, and 3,000. Not making new all-time highs this past week were the Dow Jones Utilities (DJU), the NYSE, the AMEX, the S&P 100 (OEX), and the S&P 600 (small cap). Not everyone joined the party.
Over in the EU, no one we follow regularly was making new all-time highs even as the London FTSE gained 7.3%, the Paris CAC 40 was up 8.5%, and the German DAX jumped 4.8%. In Asia, China’s Shanghai Index (SSEC) was down 0.1% but the Tokyo Nikkei Dow (TKN) soared to new 52-week highs (the all-time high was seen in early 1990), up 4.9%. The MSCI World Index gained 3.6% but did not make new all-time highs. Bitcoin was up 4.2% and made fresh 52-week highs once again. Others we saw make new highs on the week were South Korea, Taiwan, Turkey, India (Nifty 50), Netherlands, and the Emerging Market Index (EEM). Neither of the two indices in Canada made new highs as the TSX Composite gained 2.4% but the TSX Venture Exchange (CDNX) lost 0.8%.
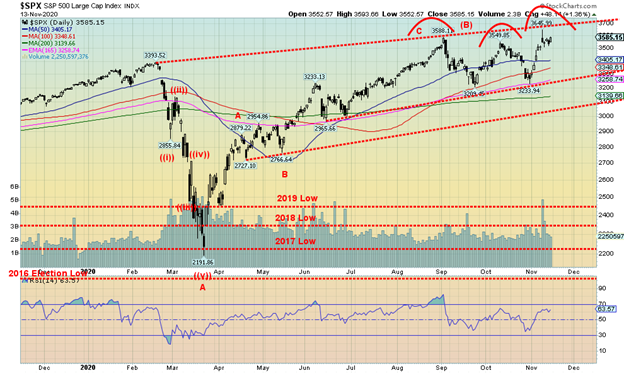
The week ended a bit flat after spiking to the new all-time highs on Monday. With a raging COVID-19, shutdowns looming and a dark winter ahead according to some, along with the uncertainty surrounding the election with a potential dispute, the market settled back but did not fail. A move back under 3,500 would be short-term negative and confirm to us that a top may be in. Under 3,400, things would pick up and under 3,200 a panic could occur. We note as well that the spike high this week came in just below the channel line, connecting the February high with the August high. We failed just under that line in October as well. Could that line be the “line in the sand”? We need a move above 3,700 to confirm that the bull is alive and well.
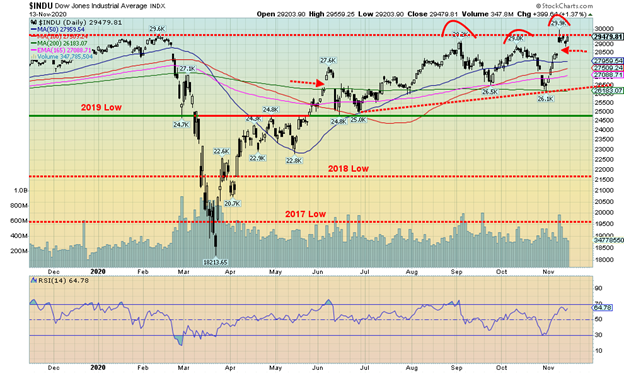
As with the S&P 500, the DJI gapped higher on Monday, spiked, then reversed and closed below the opening level, leaving a shooting star pattern on the charts. We note the DJI also left a nice gap on the charts, not dissimilar to what we saw in June. The market then gapped down, leaving what appeared to be an island reversal on the charts. By August that island reversal was erased. Nonetheless, we could see an island reversal this week and this time it might hold. A move back under 28,500 would be a short-term negative and once under 28,000 we should be confirming a top on the DJI. The major breakdown line is at 26,500. We note that the all-time high this week was only 365 points above the February high or 1.2%. Despite all efforts, the DJI did not make a new all-time close this week. That was seen in February at 29,551. The high close this past week was at 29,397. That is a bit of a divergence in that we made a new all-time but failed to make a new all-time high close.
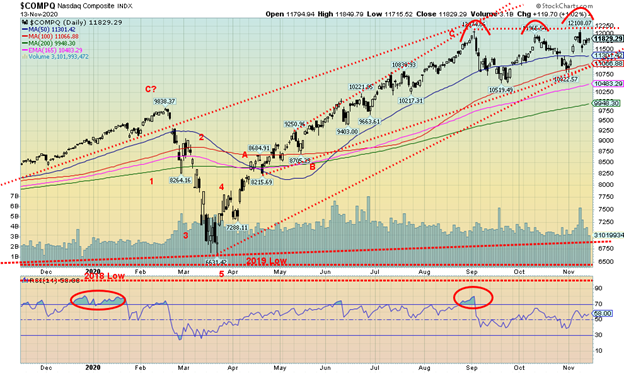
Did the NASDAQ make a key reversal this past week? On Monday the NASDAQ, like the other indices, leaped open making a new all-time high at 12,108.07, then reversed, put in an outside trading day, and closed down on the day by 1.5%. It is rare to see an outside reversal day like this at an all-time high. That is why it could very well be a key reversal and a top may be in. The premise was that the tech stocks (the stay-at-home stocks) that took the market higher were now out and value stocks were in. All because of the possibility of the vaccine. Oops, hold on the vaccine; it still won’t be ready for months and COVID-19 is raging with records falling daily. The big tech stocks didn’t fare well this week. Facebook lost 5.6%, Amazon dropped 5.5%, Netflix was off 6.6%, and Microsoft dropped 3.2%. Google did make an all-time high, gaining 0.9%, and Apple was up 0.5%. Tesla lost 5.0% but value triumphed as Buffett’s Berkshire Hathaway gained 8.9%. Beware—if the NASDAQ falls under 11,500 and under 11,000 it would be game over. As we have noted, triple tops are very rare but they do happen. The triple top scenario would fail if the NASDAQ were to move above 12,100 by at least 1% or so. The neckline on the triple top is around 10,850 and, if broken, could project down to 9,200. The 200-day MA is at 9,950.
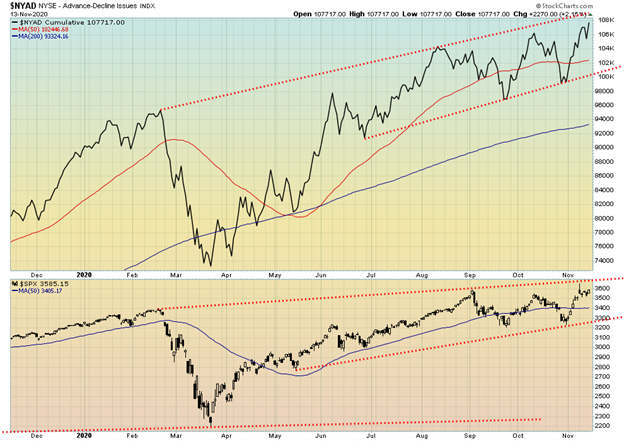
We were hoping that the NYSE advance/decline line would not make new highs this past week along with the S&P 500. But it did, thus confirming the advance by the stock market. All we can note in looking at the two is that both are bumping up against a potential top of a channel. The question is, will they charge through it?
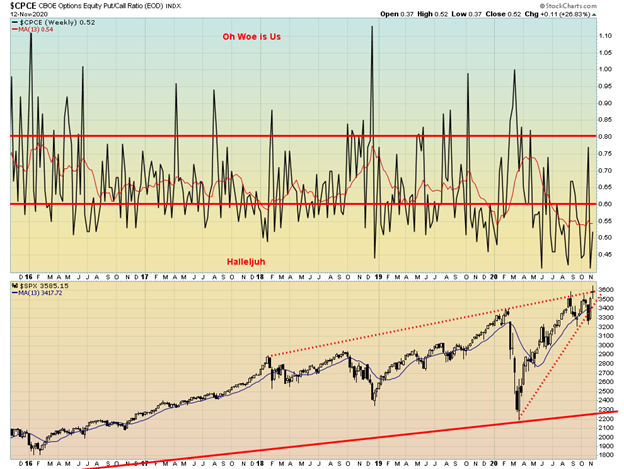
The CBOE put/call ratio remains firmly controlled by call options. The ratio improved this past week to 0.52, up from the record low seen the previous week at 0.41. It is still high in favour of calls over puts. The market remains quite bullish and potentially quite complacent. The mantra is that the Fed has their back, and that belief is entrenched. So, buy, buy, buy.
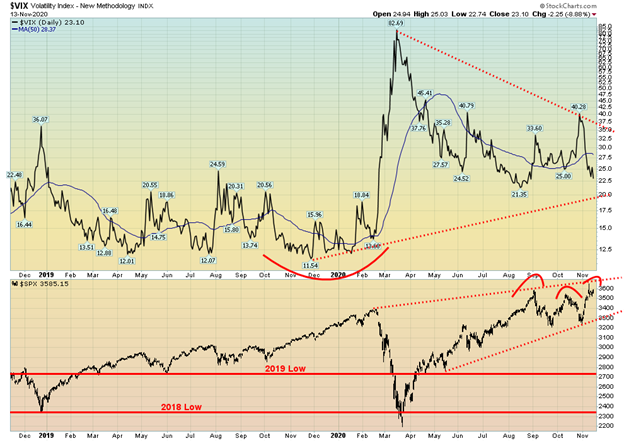
Sometimes patterns just don’t work out. A week or two ago we noted what looked like a head and shoulders bottom on the VIX Volatility Indicator. Well, it did pop higher but it failed and fell back, eventually taking out the low of the right shoulder. Once that happened, any chance of a fulfilled head and shoulders bottomed failed. Now we have to await a new pattern. One thing we can note is that the S&P 500 did hit new all-time highs this week; however, not only is the VIX nowhere near its all-time lows (VIX moves inversely to the S&P 500), but the VIX is still above its August 2020 low. That’s potentially a negative divergence between the VIX and the S&P 500. It can be confirmed only if the S&P 500 were to top out here and start a new leg to the downside.
Value triumphed over growth on the TSX this past week as Financials (TFS) gained 6.7%, Income Trusts (TCM) were up 8.4% and Real Estate jumped 6.9%. Meanwhile, Golds (TGD) were hit, down 8.2%, Materials (TMT) was off 5.9% and Metals & Mining (TGM) fell 2.6%. The hot high-tech sector was cooled as Information Technology (TKK) lost 4.1%. Overall, 5 of the 14 sub-indices were down on the week with 9 up. The only other loser was Consumer Staples (TCS) that was up, then reversed and closed lower, off 1.7% on the week. Consumer Discretionary (TCD) on the other hand gained 6.5%. The big winner was Energy (TEN) which jumped 15.4%, but will it hold? Health Care (THC) was up 5.9% while Industrials (TIN) traded to new all-time highs gaining 3.3%, Telecommunications (TTS) was up 5.4% and Utilities (TUT) gained 1.1%. The tug of war left the TSX Composite up only 2.4% on the week. The small cap TSX Venture Exchange (CDNX) actually fell, losing 0.8%.
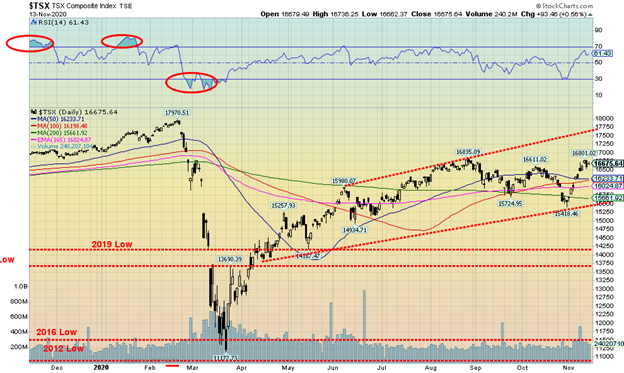
As it is so often with the TSX, it depends which sector you are in. Despite the losses, Golds, Metals, and Materials remain in bull markets and we have no sell signals. Energy remains in a bear market. The TSX could still be topping here but we need evidence of a top. And we don’t have that—yet. If the TSX hits the top of the channel at 17,750 it would still be short of the all-time high seen last February. We fully admit triple tops are rare. And, right now, the TSX appears to be possibly making a triple top. The bottom of the channel is down around 15,500 so we are a way from a breakdown. Meanwhile, the TSX may have completed an ABC correction with the low at 15,418 on October 30. The recent high at 16,835 needs to be taken out to suggest a move to the top of the channel near 17,750. A reversal and plunge back under 16,300 would be the first sign that things are failing instead. Indicators are fairly neutral here and have considerable room to move higher. But the March breakdown through the 2019 low, the 2018 low, the 2017 low, and even briefly the 2016 low suggested to us something was amiss and possibly we were entering a bear market. But Canada, like the U.S., has the BofC propping things up and the government sending out cheques, trying to prevent a meltdown on Main Street. And that alone could keep the market higher.
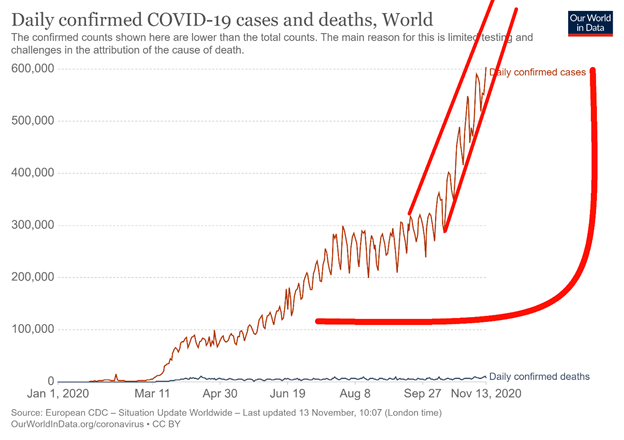
The numbers are soaring. We tick off more than another million cases every other day. The latest 7-day average is over 572 thousand cases daily with days now rising above 600 thousand. Could a million-case day be far behind? It’s a relentless rise. Eleven countries have now reported more than one million cases with one, Peru, projected to be there this coming week. With cases rising it is no surprise that deaths are also rising, averaging of late 8,500 dead every day. There have been 10,000-death days. One piece of good news is that the deaths/cases ratio has fallen overall to 2.4% down from 3%. And the daily average of deaths/cases is down to around 2%. That’s a 33% drop overall. Better drugs and care are helping to keep the death rate down. But it is nowhere near the common flu rate of 0.1%. Countries have, once again, moved into lockdowns and as they rise, social tensions rise with those protesting the lockdowns or the wearing of masks vs. those who support the wearing of masks and lockdowns. With that, there is no happy medium and no compromise when one is badly needed.
Reported Coronavirus Cases and Deaths: November 15, 2020 15:53 GMT
Number of Cases: 54,544,313
Number of Deaths: 1,321,546
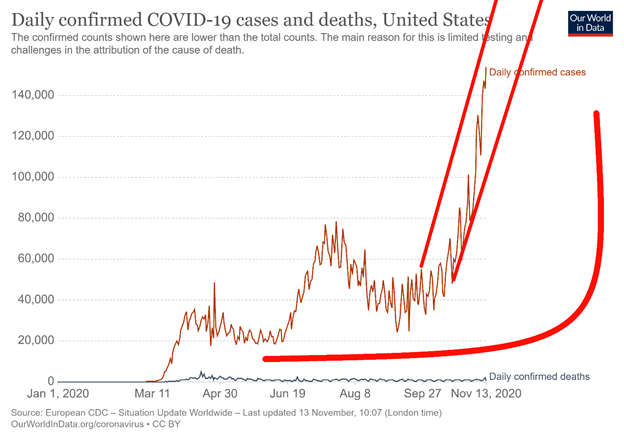
The numbers in the U.S. go from bad to worse to even worse. Friday the 13th brought the U.S. over 188 thousand cases, a record at least until the next one, and over 1,400 dead. The expectation is growing that the U.S. will soon see a 200 thousand day and even 300,000 day. Two states, Texas and California, are now over one million cases. Florida, in third place, is chugging towards a million cases. The U.S. overall deaths/cases ratio is now at 2.4% with the daily death/cases ratio having fallen to around 0.7% to 1.0%. Hospitals are filled to capacity. Yet nowhere is the social divide more apparent than in the U.S., between those committed to lockdowns and wearing a mask and those opposed. The divisions are as deep as the electoral divisions.
Reported Coronavirus Cases and Deaths: November 15, 2020 15:53 GMT
Number of Cases: 11,235,666
Number of Deaths: 251,285
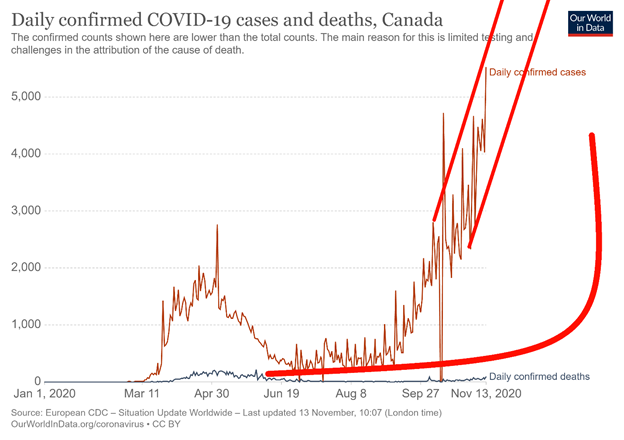
The numbers are rising precipitously in Canada as well, particularly in Ontario and Quebec. Canada is expecting 10,000/day soon. Canada remains entrenched in 31st place globally for cases but 22nd in deaths. Canada had a particularly high death rate of around 7% back in the spring. Since then it has fallen to 3.8%, thanks to daily rates now around 1.2%. A great drop over 80% in terms of deaths/cases. But as cases mount, so do the deaths. Just that the ratio remains lower. In terms of cases/million, Canada is faring better than most—in 92nd place. But they are in 44th place in terms of deaths/million. The leader in deaths per million is tiny San Marino but more realistic is Belgium in second place with an average 7 times the global rate. In terms of cases/millions the leader is tiny Andorra but again more realistic is, once again, Belgium in fourth place again with a rate 6.5 times the global average.
Reported Coronavirus Cases and Deaths: November 15, 2020 15:53 GMT
Number of Cases: 291,931
Number of Deaths: 10,891
US 10-Year Treasury Note, Canada 10-Year Government Bond (CGB)
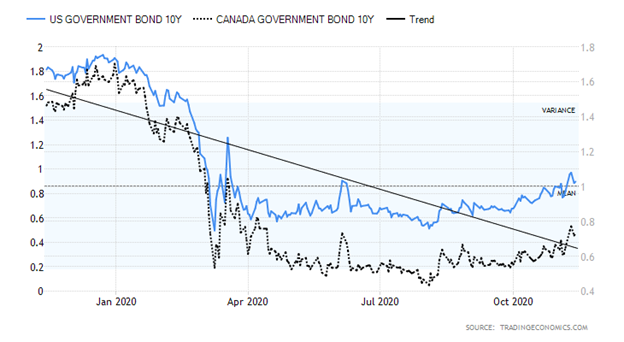
The announcement by Pfizer of a vaccine saw bond prices fall and yields rise on the expectation that would translate into an improved economy. Not so fast. By the week’s end the COVID-19 was raging, the election was in hot dispute, and instead of signs of a strengthening economy it was the opposite. Numbers that caught our attention this past week were the Redbook Index that fell 1.2% in November, JOLTS job openings for September that came in at 6,436 thousand below expectations of 6,500 thousand, and the Michigan Consumer Sentiment Index that unexpectedly fell to 77 when the market had expected a reading of 82. The October Michigan consumer sentiment index was at 81.8. It didn’t help that both Fed Chair Jerome Powell and Vice Chair Randy Quarles gave downbeat talks suggesting a dark winter ahead. Quarles indicated that it could be 2023 before things really begin to turn around. Many other analysts are not looking for any real improvement in employment until 2022. That was despite the weekly initial jobless claims that came in at 709 thousand below the expectations of 735 thousand and the previous week at 757 thousand. No matter how one cuts it, the jobless claims remain elevated. Inflation is also ticking up as the CPI was up 1.2%, about as forecast, while core inflation rose 1.6% below expectations of a rise of 1.8%. The U.S. 10-year Treasury note tried to go higher this past week, hitting a high of 0.98%. But then by week’s end it came right back down, closing at 0.89%. The Canadian Government of Canada 10-year bond (CGB) did the same thing, hitting a high of 0.74% before closing at 0.73%. Not quite as dramatic. The great bond yield rise could be over before it really begins. We had noted resistance at 1.00% but do believe that over 1% the yield could rise towards 1.2%. We are in a little uptrend but that would fail if the 10-year fell back below 0.80% and especially under 0.70%.
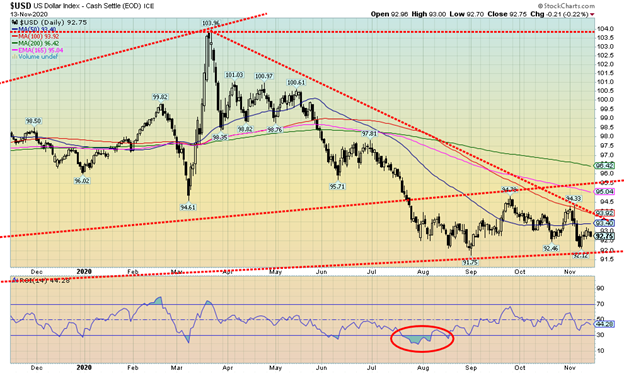
When Pfizer announced the vaccine on Monday, the US$ Index posted a solid turnaround. And then, as quickly as it started, it fizzled. With a high of 93.19 the US$ Index didn’t even make it back to the 50-day MA (93.40). By the week’s end the US$ Index closed off 0.5% from its high. On the week, the US$ Index rose 0.6%. The currencies were mixed with the euro down 0.4%, the Swiss franc off 1.3%, the Japanese yen down 1.2%, but the pound sterling up 0.3%. The Cdn$ made a new high for its move to the upside, then reversed and closed the week lower down 0.9%. The Cdn$ may have topped for the moment. Technically, the US$ Index continues to look weak as indicators that popped quickly turned down once again. The MACD never gave a buy signal and the short-term trend remains down. Two areas of support loom below: the recent low at 92.12 and the September 1 low of 91.75. If they fall, the US$ Index is headed lower, possibly towards 88. The US$ Index needs to break out over 94 to suggest that a low might be in. With COVID raging once again, lockdowns looming, a disputed election, and social unrest, the odds of a U.S. dollar rally appear slim.
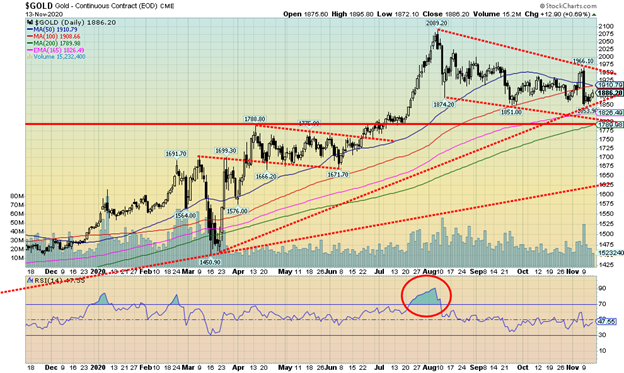
When the Pfizer vaccine was announced on Monday, November 9, the stock market and the U.S. dollar soared but gold tanked and interest rates rose. Gold had a bad week, losing 3.4%. In the process gold almost made new lows for the move down with a low of $1,854. The previous low was seen on September 24 at $1,851. Friday, gold rebounded as the numbers for COVID-19 soared and everyone came to the realization that any vaccine was still months away. Add in the disputed election, rising lockdowns, and social unrest over both the election and COVID-19 restrictions, and the market turned around as gold rose, stocks wavered, and the U.S. dollar fell back. On Friday gold regained 0.7%, closing 1.7% above the week’s low. Gold remains within its bear channel and this week saw gold test the uptrend line from the March 2020 low. So far, it has held. Volume was quite high on Monday when gold fell 5.0%. Gold had an outside reversal day but it was not a key reversal as no new highs were seen. Gold has support at $1,854, then down to $1,851 but below that a fall towards $1,810 is possible. Some maintain bear targets down to $1,760/$1,790. We cannot rule that scenario out just yet. To the upside, gold first needs to regain above $1,910 then above $1,965. The high this past week was at $1,966 and we had noted earlier that it was important for gold to confirm its low with a solid close over $1,960. We never got that. The high close was $1,951. Above $2,030 new highs are probable above $2,089, the August high. Gold has some history of important lows in the November/December period. After that positive seasonals kick in. Gold is down over $200 from its recent high or about 10%. In March 2020 gold lost $254 or 15%. So far, it feels and looks like a normal correction within the context of a bull market. And yes, gold is in a bull market and remains so. Only a major breakdown under $1,790 would turn gold into a bear market. There was no COT this week as the Remembrance Day partial holiday pushed the COT reports out to Monday.
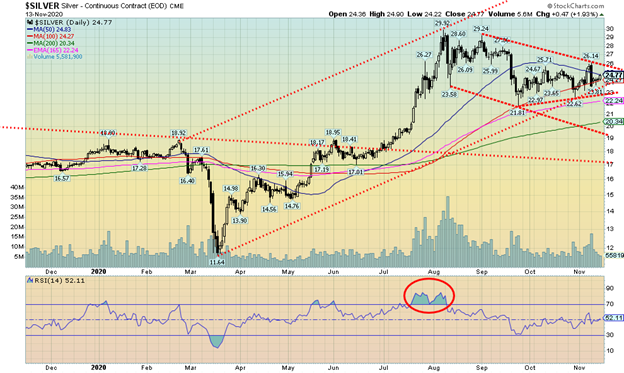
Silver fell this past week along with gold, losing 3.5%. That was actually good as it could have been worse. That’s the bad news. The good news is silver has not seen new lows, unlike gold. An interesting divergence between the metals. Silver’s low for this corrective move is at $21.81 on September 24, 2020. The low this week was at $23.81 and the most recent low was seen on October 29 at $22.62. The gold/silver ratio which peaked at 131.14 back in March 2020 is currently at 76.13. A low of 68.63 was seen in August. The gold/silver ratio continues to point down and we expect that this ratio should fall further. Silver prices tend to lead gold prices both up and down, and with the ratio falling, the leadership to the upside is silver. Silver could be forming a symmetrical triangle. There is support down to $23.60, then down to $22.90. A breakdown under $22.90 could imply a move down to the 200-day MA near $20.35. A downward-sloping channel has support currently near $19.40. Silver prices rebounded on Friday, gaining almost 2.0% as the COVID-19 numbers soared. The RSI is currently neutral near 50. Silver first needs to regain above $25 but the real breakout doesn’t come until silver is over $26. Above $28, new highs are probable. As with gold, there was no silver COT this week.
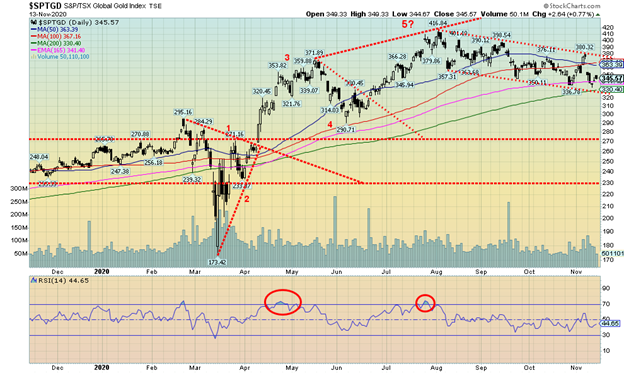
Gold stocks continue to trade in a corrective fashion in a gentle downward-sloping bear channel. It doesn’t appear to us to be a descending triangle which would be characterised by a series of lower highs and relatively flat lows. This channel has featured lower highs and lower lows more in line with a large bull flag. This past week the TSX Gold Index (TGD) fell 8.2% while the Gold Bugs Index (HUI) dropped 8.9%. Essentially, the indices gave back the gains they picked up the previous week. They failed to break out to the upside but continue to hold the downside channel. The 200-day MA looms below at 330 and should act as support even if we were to trade under it at some point. Of concern was the gap down seen on November 9 but downside follow-through was minimal. We finished roughly 3.5% above the week’s low. We do note that the 50-day MA has crossed over the 100-day MA, a negative development as followers of the MA crossovers will say they have a sell signal. On the positive side we note that, despite the lower low this past week, the RSI did not make a lower low, a divergence. The MACD indicator is also diverging. Despite these divergences, none of that is to suggest that we are making a bottom. A bottom needs to be confirmed. For the TGD that means we need to break out over 380 and then confirm it with a close over 400. It’s seemingly a tall order at this point. To the downside, what’s key will be continuing to hold the bear channel and also preferably to hold the 200-day MA. If we are witnessing a 5-point ABCDE correction, then this wave down may be our E wave. Any breakdown that takes us below 290 would, however, signal we have entered a deeper bear market move to the downside.
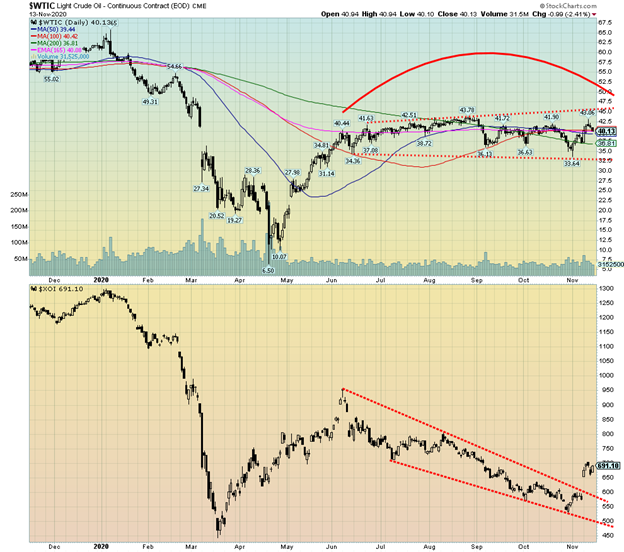
The announcement by Pfizer put a bit of spark in the beleaguered energy market as oil prices jumped and energy stocks were snapped up. But by the end of the week reality was slowing returning to the market as oil fell back against the backdrop of rising COVID-19 cases and lockdowns. Still, WTI oil managed to rise 8.1% on the week, closing at $40.13. Natural gas (NG) also gained 3.5%. The energy stocks fared quite well as the ARCA Oil & Gas Index (XOI) rose 19.8% and the TSX Energy Index (TEN) jumped 15.4%. Both indices gapped higher this week breaking downtrend lines. The expectation is, however, that the XOI above could retest the breakout line filling that gap. Support is now seen down to just under 600 on the index.
The optimism may be short-lived given the rise in COVID-19 cases and lockdowns. The wild card is the big producers who at one point indicated they were poised to turn on the spigots, once again flooding the world with oil in a desperate battle for market share. Saudi Arabia with its very cheap production costs would in that case be a winner. High-cost fracking and dirty oilsands Alberta, both already reeling, would have yet another nail punched in their coffins. Venezuela is also reeling; never mind the deep political divisions in the country. The reality is the vaccine still won’t be available for months. Travel—whether by car, plane, or cruise ship—will continue to be dampened, and for cruise lines already teetering on the edge of bankruptcy and irrelevancy, it may be a final nail in the coffin. The IEA has downgraded its forecasts for 2021. They have indicated it will be years before the market returns to any sense of normalcy.
All of this drop in demand hurts the potential for pipelines as well. The Keystone pipeline could fall as could the Dakota Access pipeline. Here in Canada it could negatively impact Trans Mountain even as it chugs along to completion. Refineries are also closing. Plants in North America, Europe, and Asia have been shutting down due to the drop in demand. Some may never return and tens of thousands of jobs are being lost.
WTI oil continues to bounce around in a trading band that recently widened a bit from $34 to $43. To break the band, it has to either firmly break down or break out to the upside. It doesn’t appear as if it is able to. Downside risk remains while upside continues to appear limited. A war in the Middle East might change that scenario. Is war possible? If it was, it would most likely involve the U.S. and Iran. What better a distraction from a disputed election.
__
(Featured image by Fernandozhiminaicela via Pixabay)
DISCLAIMER: This article was written by a third party contributor and does not reflect the opinion of Born2Invest, its management, staff or its associates. Please review our disclaimer for more information.
This article may include forward-looking statements. These forward-looking statements generally are identified by the words “believe,” “project,” “estimate,” “become,” “plan,” “will,” and similar expressions. These forward-looking statements involve known and unknown risks as well as uncertainties, including those discussed in the following cautionary statements and elsewhere in this article and on this site. Although the Company may believe that its expectations are based on reasonable assumptions, the actual results that the Company may achieve may differ materially from any forward-looking statements, which reflect the opinions of the management of the Company only as of the date hereof. Additionally, please make sure to read these important disclosures.


Mollie Expands Across EEA With €350M Investment to Strengthen European Payments Network
Fintech company Mollie has expanded into Croatia and Iceland, achieving full coverage of the European Economic Area. It has committed...


Trulieve NYSE Listing Signals New Era for Global Cannabis Industry
Trulieve’s NYSE listing marks a milestone for the cannabis industry, giving a major US producer access to institutional capital after...


Moroccan Bond Market Shows Mixed Signals as Primary Eases and Secondary Pressures Persist
The bond market shows a mixed trend, with cautious easing in the primary market as the Treasury raises limited funds...


Markets Diverge as Oil Falls, Rates Hold, and Inflation Persists
Markets reacted to a U.S.–Iran MOU and unchanged Fed rates, with oil plunging while energy stocks showed divergence. Equities fluctuated...


Cocoa Market Faces Mixed Trends Amid Rising Supply and Weak Demand
New York cocoa prices edged lower Thursday while London closed higher, with mixed but improving daily trends. West Africa’s main...
 |
|
 |  |
 |
|
-

 Business1 week ago
SpaceX IPO Sparks Déjà Vu as Market Risks Loom and Gold Bulls Stay Hopeful
-

 Crowdfunding6 days ago
Wyrmgold Launches Crowdfunding Campaign for Believe in me! (please)
-
 Biotech2 weeks ago
The German Biotech Industry Faces Funding Crunch Despite Market Stability
-

 Crypto2 days ago
XRP Under Pressure Amid Macro Forces, Fed Policy, and Regulatory Shifts