Markets
Consumer confidence at the US stock market increases despite danger signs
Consumer confidence is a measurement of how people feel about the economy and their own financial situation and it seems following Trump’s election that they are feeling better economically.
The consumer confidence at the U.S. Stock market is soaring after Trump’s election, much like the stock market itself despite growing signs of danger.
One has to be amazed at the strength of the US stock markets as they climb relentlessly to new highs on a wave of easy money, stock buy backs and short covering and all despite a lack of major retail participation. The market continues to ignore growing danger signs. The key indicator may be the Case Shiller PE Ratio that most recently was at 28.85, a level seen only three times in the past century; in 1929,before the October 1929 stock market crash and the Great Depression,and in 1999,before the peak of the Internet/high-tech bull market that presaged the 2000–2002 Tech Wreck crash. The mean and the median over a century stands at 16.72 and 16.09 respectively. The Case Shiller PE ratio is higher today than it was in 2007 before the 2007–2009 financial crisis crash and subsequent Great Recession.
Of course, that is not the only indicator flashing warning signs. Sentiment indicators, momentum indicators, breadth indicators, put/call option indicators, spreads on junk bonds, stocks trading over their 200-day MA and stocks hitting new 52-week highs exceeding stocks hitting new 52-week lows and market volatility indicators as measured by the VIX are all at or near extremes, flashing warning signs about the stock market. Yet the market ploughs higher. Even the S&P TSX Composite has kept pace regularly, setting new all-time highs led primarily by financials.
But there may be another indicator that also appears to be exuding the same confidence as the stock market and that is consumer confidence.
-
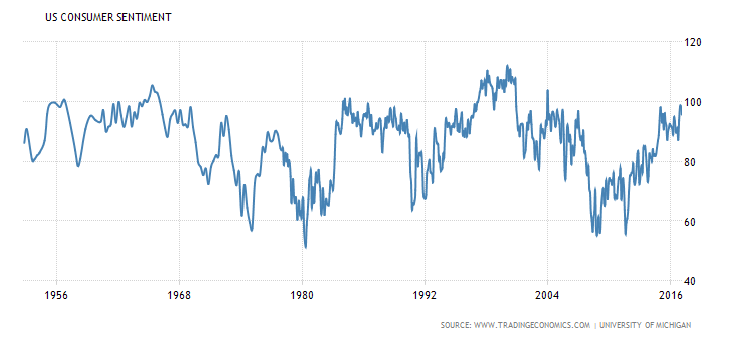
U.S. Consumer Sentiment (Source)
Larry Fink of BlackRock Funds, the world’s largest asset manager, noted something interesting recently. The consumer confidence indicator soared following the election of Donald Trump, just like the stock market. Consumer confidence is a measurement of how people feel about the economy and their own financial situation and it seems following Trump’s election that they are feeling better economically. The consensus before the election was that if Trump were elected the market could crash. Well, it did—at least, for a nanosecond before Trump’s billionaire friend Carl Icahn stepped into the market and apparently bought a $1 billion worth of stocks. The result was: not only did the stock market reverse to the upside but the US$ rose sharply and gold and bond prices plunged. That is why the S&P 500 is up 9% since the election and the Dow Jones Industrials (DJI) has continued rising over 20,000. Consumer confidence followed and it is at its highest levels in well over a decade.
The markets are enamored with the thoughts of deregulation, particularly financial deregulation, infrastructure spending, tax cutting and increased defense spending. Deregulate, cut taxes and spend more and, of course, put “America First” to make “America Great Again.” Not only did the investment and business community buy in but consumers did as well, it seems. The consumer confidence index is up 13% since October 2016.
There is an old saying from investment guru John Templeton that says …
Bull markets are born on pessimism, grown on scepticism, mature on optimism, and die on euphoria. The time of maximum pessimism is the best time to buy, and the time of maximum optimism is the best time to sell.
Still, the cracks in the markets have not as yet been seen. And that is in spite of a growing scandal surrounding the firing/resignation of National Security Advisor Michael Flynn, that attempts to ban Muslims from seven countries were “shot” down by the courts, that deregulation may be harder to bring about than they think, that infrastructure spending and “the wall” may have difficulty in passing Congress, there might even be a fight over tax cuts and growing protests over the Trump administration. And then there is the debt ceiling that comes up for renewal in March. In the past, the battle over the debt ceiling has been rancorous and has occasionally resulted in the shutdown of government. The US national debt is currently just under $20 trillion against an authorized debt ceiling of $18.1 trillion.
What is the Achilles heel? It is debt. Since 2007 global debt has grown an astounding $87 trillion and today is estimated to be around $230 trillion for a global debt/GDP ratio of 302%. The national debt (government) of the 30 largest countries in the world totals $53.7 trillion. The US has the world’s highest national debt at $20 trillion. Given Trump’s agenda US debt is destined to grow. But that is just national or government debt.The $230 trillion includes all debt, governments, corporations and consumers. In terms of national debt alone Japan has a debt/GDP ratio of 240%. Russia surprisingly has the lowest of the 30 countries at around 8%. The current US national debt/GDP ratio is 106%. Anything over 100% is a natural drag on the economy, shaving growth potential by at least 1%.
Interest rates are rising globally. In June 2016 the US 10-year Treasury note carried a yield of 1.37%. Today it is at 2.47%, an incredible rise of 80%. Where once there were negative interest rates in the EU
and Japan, today they are positive again. Yet the risk of a potential debt collapse has not been priced into the markets despite signs that well known financial basket cases such as Greece, Ukraine, Argentina and others are once again teetering on bankruptcy. But sovereign debt risk is merely the tip of the iceberg. The real risk lies in the banking and corporate sectors. The European banking system remains shaky at best. Numerous Chinese corporations are technically bankrupt, particularly in the overblown real estate sector.
Fed Chair Janet Yellen has hinted that another interest rate hike could be coming in March 2017. GDP growth for 2016 is estimated at an anaemic 1.6%. But growth has not been evenly distributed benefiting primarily the upper 20% of the population. According to John Williams Shadow Stats, the US has actually been in an ongoing rolling recession except for brief periods since 2001 based on GDP as it was calculated back in the 1990’s before major changes were made to give the numbers an upside bias.
China, who was once the world’s largest holder of US Treasuries has shed some $188 billion in the past year and has ceded the top holder position to Japan who themselves have shed $31 billion. Overall, foreign holdings of US Treasuries have fallen $142 billion in the past year. Foreign holders are nervous about US debt. They are not buying although there was a bump to the upside in December 2016. Central banks have been forced to increase their holdings of US Treasuries to offset the selling. The selling is not large—yet.
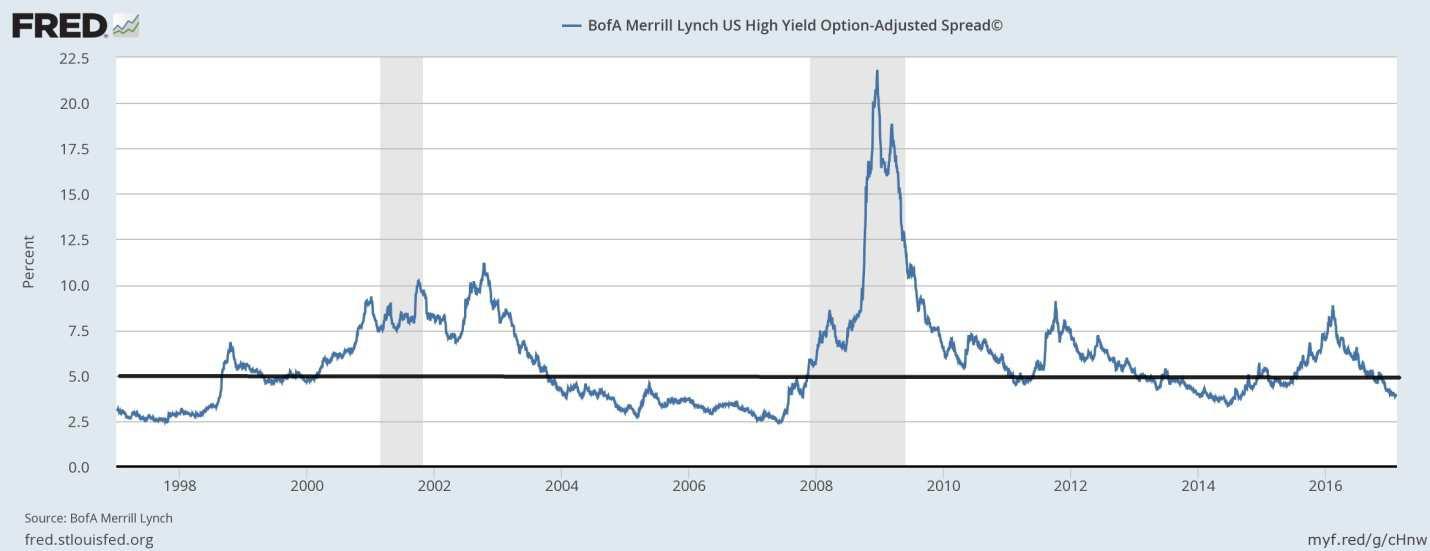
BofA Merrill Lynch U.S. High Yield Option-Adjusted Spread (Source)
There is a degree of complacency in the bond markets. The chart of US high-yield option adjusted spreads shows that it has fallen down into levels seen before previous market tops. It is, however, once again a warning sign and not necessarily a suggestion that the market is about to turn down. Low spreads were sustained from 2004 through 2007 before exploding to the upside during the 2007–2009 financial crisis. Low spreads can be sustained for a period of time. But they are not necessarily a sign of health and could be another sign of complacency in the market.
World trade is contracting. Evidence has shown that the value of world exports (volume*price) has grown by less than 1% annually since 2007. This compares unfavourably to 5% annual growth since 1991. The Baltic Dry Index, a measurement of the “price” of moving major raw materials by sea has fallen from 11,500 in 2008 to 685 today. A study has shown that global exports as priced in US$ have varied directly with the price of oil.
Since 2008 the US$ has increased in value by 23.7% while the Euro has fallen 23.9% and the Japanese Yen has fallen 19.5%. The Cdn$ has fallen 7.1% in the same period. While WTI oil is actually up 14.8% since 2008, WTI oil has fallen sharply since peaking in 2010. Interestingly, despite the weakness seen from 2011 to 2015, gold is up 39.3% in the same period. Despite the huge rally in US stocks since 2009 the S&P 500 lags gold up a lower 23.7%.
Overall globalization has slowed, even halted since the financial crisis of 2007–2009. There is a risk that globalization could actually recede. The Trump administration has made trade a key issue, warning that the US$ is too high and that trade with Mexico, China, Japan and Germany is under scrutiny. They have also trash-talked the Euro, the Japanese Yen and the Chinese Yuan accusing them of being currency manipulators. To lower the US trade deficit the US needs a lower US$. Strangely, US exports have been amongst the stronger of nations since 2008 whereas Japan and China have actually seen some retraction. If the US were to slap a border-adjustment tax, that could perversely send the value of the US$ higher.
Nonetheless, trade wars are in no one’s interest. “Beggar thy Neighbour” policies have proven to be failures in the past. Yet the world could be on the cusp of a trade-currency war. That in turn would have a negative impact on corporate profits and ultimately GDP, given that it would negatively impact global supply chains and increase the cost of trade and outsourcing. If there is a saving grace, the WTO did not exist during the Great Depression and it may be the WTO that can act as a mediator to lessen the negative impact of trade wars.
With valuations in the stock market at grossly overbought levels, it may be a surprise to learn that real assets (defined as art, jewellery, real estate, precious metals) are considerably under-owned in relation to financial assets (stocks, bonds). Gold, as an example, is estimated to be less 0.6% of all global financial assets. In 1980, gold was at 5% of all global financial assets. Even at the price peak for gold at $1,900 in 2011, gold represented less than 0.9% of global financial assets.
Despite an improvement in gold prices from lows in December 2015 and December 2016 the sentiment towards gold and precious metals remains at low levels. And this is despite gold being the best performing asset since 2000—up 323% vs. a rise of 59.3% for the S&P 500. Since 2016 the Dow Jones Industrials (DJI) is up 17.1%, the S&P 500 is up 13.9% while gold is up 16.3% and silver has gained 29.5%.
Two markets: one overvalued and over-owned, the other undervalued and under-owned. It has been up, up and away for the US stock markets. But, given the risks, the question investors must ask is—how will it all end? And when?
—
DISCLAIMER: This article expresses my own ideas and opinions. Any information I have shared are from sources that I believe to be reliable and accurate. I did not receive any financial compensation in writing this post, nor do I own any shares in any company I’ve mentioned. I encourage any reader to do their own diligent research first before making any investment decisions.


Abivax Shares Surge as New Trial Data Eases Safety Concerns Over Ulcerative Colitis Drug
Abivax shares surged nearly 36% after positive updated trial results for its ulcerative colitis drug obefazimod reassured investors following earlier...


El Dorado Raises $9M to Expand Cross-Border Fintech Platform
El Dorado, a Latin American fintech improving cross-border financial services, raised a $9 million Series A led by Paradigm with...


Bitcoin Stalls Near $60K as Strategy Moves, ETFs Outflow, and EU MiCA Rules Take Effect
Bitcoin hovers near $60,000 with ETF outflows, while Strategy boosts reserves, sells BTC, and raises dividends to reassure investors. Ethereum...


Cannabis Dominates Global Drug Use: Trends, Risks, and Shifting Markets
Cannabis remains the world’s most widely used illicit drug, with 256 million users in 2024, surpassing all others combined. Growth...


Italy Approves First Hydrogen-Powered Train for National Rail Network
ANSFISA has approved Italy’s first hydrogen-powered train, the Alstom HMU214, for use on the Brescia–Iseo–Edolo line. Capable of 140 km/h,...
 |
|
 |  |
 |
|
-

 Impact Investing1 week ago
Edison Accelerates Renewable Growth and ESG Impact in 2025
-

 Cannabis7 days ago
Spain Cannabis Laws: Private Use, Fines, and Grey Areas
-

 Crowdfunding2 weeks ago
Wyrmgold Launches Crowdfunding Campaign for Believe in me! (please)
-
 Business2 days ago
Dow Jones Near Highs Signals Strength Until Volatility Returns
You must be logged in to post a comment Login