Featured
Why the sky is the limit for Corning Incorporated stock
Corning stock went on to make a series of higher highs and higher lows, which has become the quintessential characteristic that defines a bullish trend.

How has Corning Incorporated stock changed from January 2017?
I am bullish on Corning Incorporated (NYSE:GLW) stock and this view originated in January 2017, when certain developments I follow suggested that this view was not only prudent but also warranted. I outlined these developments in a publication titled Corning Incorporated: GLW Stock Is Taking Off, and since that publication, GLW stock is up 15.25%. Corning stock has become a perfect example of an investment that breaks out of a long-term base and stages an orderly linear advance.
This linear advance is well supported by a number of key metrics, and as long as Corning stock remains above these metrics, this investment will remain in bullish alignment, which supports a further advance.
The large basing pattern I speak of is a very large ascending triangle, which was in development for 14 years until it was finally resolved.
The following Corning stock chart illustrates the large basing pattern that initiated my bullish view on this investment:
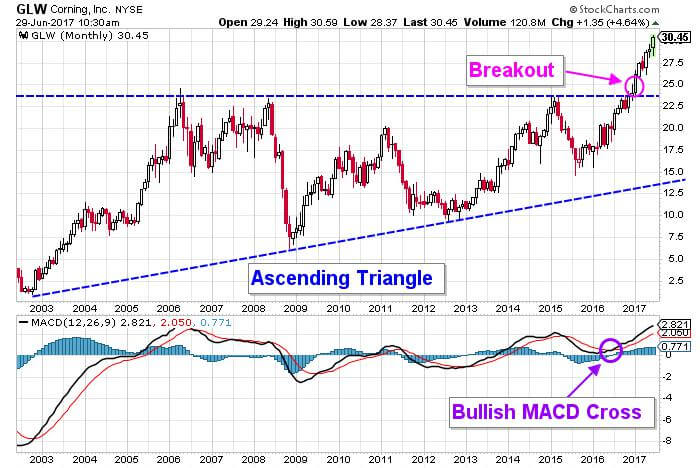
Chart courtesy of StockCharts.com
The technical price pattern is created using two converging trend lines, where the trend line representing support is upward sloping and the trend line representing resistance is horizontal. These converging trend lines create a dynamic where the range between resistance and support contracts as the pattern develops. This confinement of the trading range causes momentum to build within the pattern. This buildup of momentum is a result of a battle being waged between bullish and bearish investors, fighting for a dominating position as the pattern develops.
The bullish camp was crowned the winner of this battle when the GLW stock price exited the pattern in December 2016 by breaking above the trend line that was acting as resistance. The stock price has since risen, which was fueled by the momentum that was stored in the pattern while it was in development for the last 14 years.
The moving average convergence/divergence (MACD) indicator has been in bullish alignment since July 2016, where it was first generated. MACD is an indicator that is used to distinguish whether bullish or bearish momentum is dominating. In order to stage an advance, bullish momentum is required, and this indicator effectively suggested that bullish momentum was aligned in a dominating position. This was an instrumental indication that the large basing pattern was set to be completed.
The completion of the basing pattern implied that Corning stock was free to appreciate, and that is exactly what transpired, as GLW stock has staged an impressive advance.
The following Corning stock chart illustrates the metrics that are currently supporting this impressive bullish advance.
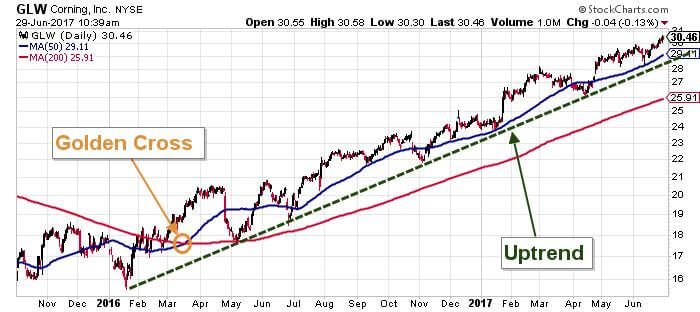
Chart courtesy of StockCharts.com
This GLW stock chart clearly shows that the recent advance began in January 2016, prior to the breakout from the ascending triangle.
The first indication that suggested an advance was in progress was a golden cross that was generated in March 2016. A golden cross is a bullish indicator that is used by the investment community to suggest that a bull market is in development. This indication is produced when the faster 50-day moving average, which is highlighted in blue, crosses above the slower 200-day moving average, which is highlighted in red. This indication captures the acceleration of the shorter-term trend against the long-term trend, indicating that momentum is fueling a move to the upside.
After the golden cross was generated, Corning stock went on to make a series of higher highs and higher lows, which has become the quintessential characteristic that defines a bullish trend. This trend is best captured using a simple uptrend line, which is easily created by simply connecting the series of lows that define this bullish trend. There are numerous points of contact on this trend line which serves to suggest that this simple uptrend is in fact very significant. I would go as far to say that as long as the stock price remains above the trend line, higher stock prices will prevail. The opposite is also true, and if the stock price would ever fall below the trend line, a larger correction and lower prices could be expected to follow.
At of this current juncture, GLW stock is above the uptrend line, the golden cross is in bullish alignment, and it is in no danger of reversing. The same can be said about the MACD indicator. This trifecta of indicators serves to suggest that the bullish trend is embedded and set to continue. The all-time high of $93.83 that was set in September 2000 is acting like a magnet, pulling the share price towards it.
Bottom line
I continue to hold a bullish view on Corning stock because a number of indications on the GLW stock suggest that this view is warranted. As a result, I will continue to hold this view as the long as the indications that suggested it remain in bullish alignment.
—
DISCLAIMER: This article expresses my own ideas and opinions. Any information I have shared are from sources that I believe to be reliable and accurate. I did not receive any financial compensation in writing this post, nor do I own any shares in any company I’ve mentioned. I encourage any reader to do their own diligent research first before making any investment decisions.


PayPal’s Slowdown: From Fintech Leader to Low-Growth Dividend Stock
PayPal has shifted from fintech leader to low-growth, value-style stock, losing over 25% in market value and trading at a...


Tilray (TLRY) Falls as Bearish Momentum Persists Despite Marketing Push
Tilray (TLRY) fell 3.32% to $4.44, remaining below key moving averages and signaling continued bearish pressure. Despite a £1 million...


ESG Gap Persists as Firms Struggle to Link Sustainability to Financial Value
KPMG’s Global Survey shows a major gap between ESG awareness and financial integration. While 72% of managers understand sustainability strategies,...


Bitcoin and Ethereum Slide as Market Pressure Builds Amid Strategy Concerns and Layer 2 Disruptions
Bitcoin fell below $60,000 with heavy ETF outflows, pressured by concerns over Strategy’s finances and its STRC stock decline. Ethereum...


AI Venture Builder Launches €600K Crowdfunding Round to Scale Secure AI Solutions
AI Venture Builder, an Italian-British firm developing AI applications and vertical startups, returns to CrowdFundMe with a equity campaign. After...
 |
|
 |  |
 |
|
-

 Africa2 weeks ago
Remote Work Reshapes Sales Management: Key Lessons for Moroccan Leaders
-

 Biotech2 days ago
Gilead HSV Plan Could Transform Market Outlook
-

 Crypto1 week ago
Crypto Market Stays Stable as Bitcoin and Ethereum See Mild Declines
-

 Fintech4 days ago
Mollie Expands Across EEA With €350M Investment to Strengthen European Payments Network
You must be logged in to post a comment Login