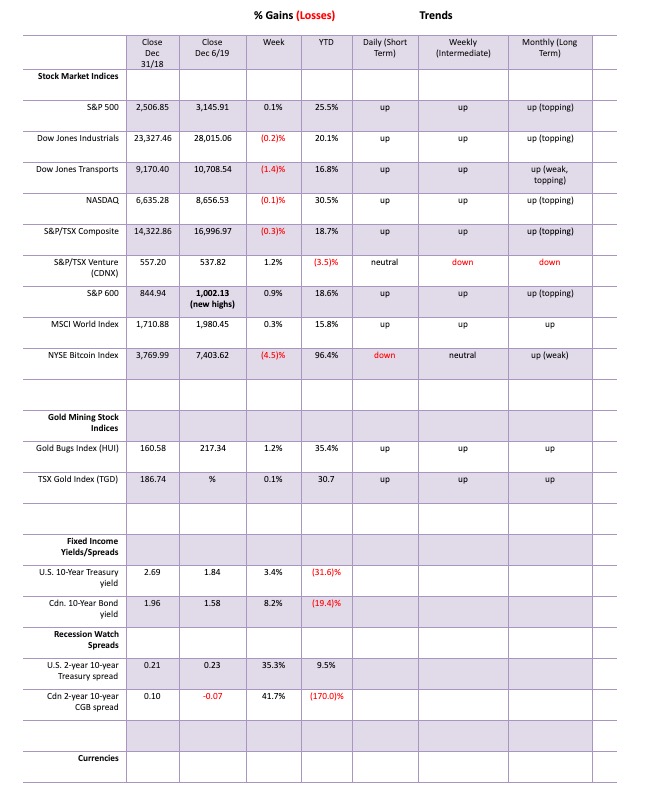
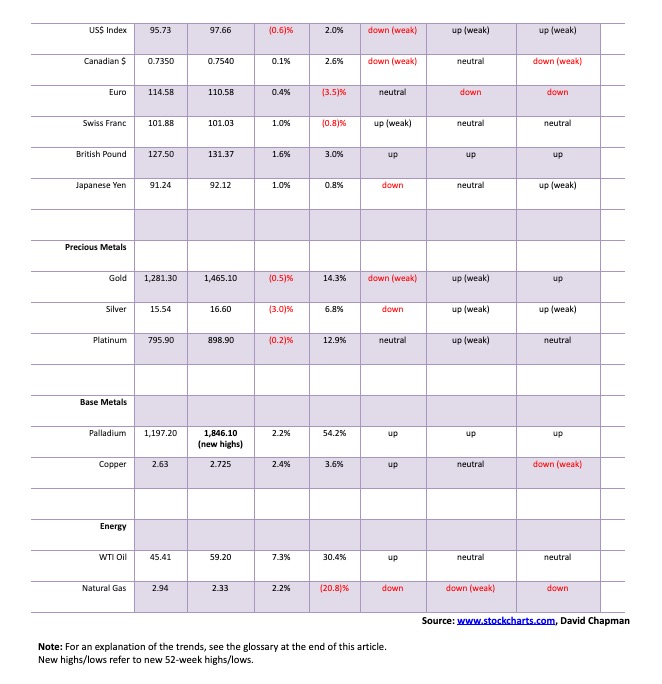
Markets
Could Canada trigger a global recession?
Tariffs imposed on Brazil and Argentina spooked the markets but by week’s end suggestions of calm with the U.S./China trade war and a gangbuster nonfarm payrolls sparked the market right back up again. Stock markets fell sharply early in the week, then rebounded but still posted modest losses. Bond yields rose, the U.S. dollar rose and gold fell. An OPEC surprise sparked higher oil prices.

“There is no cause to worry. The high tide of prosperity will continue.”
—Andrew W. Mellon, September 1929, American banker, businessman, industrialist, philanthropist, art collector, politician; 1855–1937
Andrew Mellon must have been in the camp of the perma bulls. But then, what else does one say when you are the son of the founder of Mellon Bank (founded 1869) and served as the U.S. Secretary of the Treasury from 1921 to 1932. He was Treasury Secretary at the time of the 1929 stock market crash and the start of the Great Depression. He served under three presidents, including Herbert Hoover. As if that wasn’t enough, Elaine Chao’s take on Smoot-Hawley and the trade wars of the 1930s is a rather odd statement coming from Trump’s Secretary of Transportation, especially given Trump’s propensity to trigger trade wars.
“When a country (USA) is losing many billions of dollars on trade with virtually every country it does business with, trade wars are good, and easy to win. Example, when we are down $100 billion with a certain country and they get cute, don’t trade anymore-we win big. It’s easy!”
—Donald Trump, President of the United States 2017–, tweet on March 2, 2018; b. 1946
So, what happens? Trump this week alone re-imposed tariffs against Argentina and Brazil over steel and aluminum and threatened France with tariffs on wine, cheese, and hand bags because France was imposing a tax on digital services that could affect U.S. tech companies such as Facebook (FB) and Google (GOOG). He also once again trash-talked the U.S. dollar and his perception that U.S. interest rates are too high. The stock markets “tanked” from record highs, the U.S. dollar swooned, and gold rose. Cynically, we wonder if he was short the stock market and the dollar and long gold.
The stock markets bounced right back when it appeared that, lo and behold, the U.S. and China might work out the first phase of a trade deal by December 15. The U.S. is poised to raise tariffs once again if there is no deal. While a deal is unlikely tariffs that are supposed to kick in may be dropped. But what if there is no deal and the tariffs are imposed? But one wonders how anything positive could happen when Trump signed a bill supporting the Hong Kong protestors and Congress passed a bill supporting the Uighurs.
That seems to be what we have to and will continue to go through. A tweeting president who seems to be able to move stock markets, the U.S. dollar, and gold at will. Yet, despite it all, the markets keep going higher. After all, Trump wants a higher stock market to help his re-election chances in 2020, impeachment or not. He always seems to be a tweet away from moving it higher.
A year ago December, the stock market fell sharply with the S&P 500 ultimately down roughly 20%. No Santa Claus rally in 2018. Or maybe not? The rally started December 26, 2018. It’s still rising despite this week’s pause. Or is it a pause and not the start of a larger drop? There was a long pause from roughly May to October. Sell in May and go away. Buy when it snows; sell when it goes is the mantra. It’s been snowing. The bulls would have us believe we will just keep going. After all there is FOMA (fear of missing out), the Fed will protect us, there is a lot of cash on the sidelines and it has to go somewhere.
The bears will say there is too much debt (there is—$250 trillion of it, up some $100 trillion since 2008), the global economy is slowing (the IMF lowered its forecast for world GDP growth from 3.7% to 2.9%), U.S. GDP growth has been on a downward trajectory, the trade wars will upend the stock market, the global protests could eventually negatively impact GDP (they already are—Hong Kong, France, Chile), PE ratios are too high, the climate crisis will negatively impact GDP. With bond yields at record lows, they are projecting that growth could remain tepid for years. Canada, we learned, is the only country in the world with a negative yield curve. Negative yield curves have been a precursor to a recession in the past.
S&P 500 real earnings growth is slowing, but we wouldn’t call it disastrous. What happened in 2008 was disastrous. But then it rebounded. Some say we are in an earnings recession. The chart below shows a slowing.
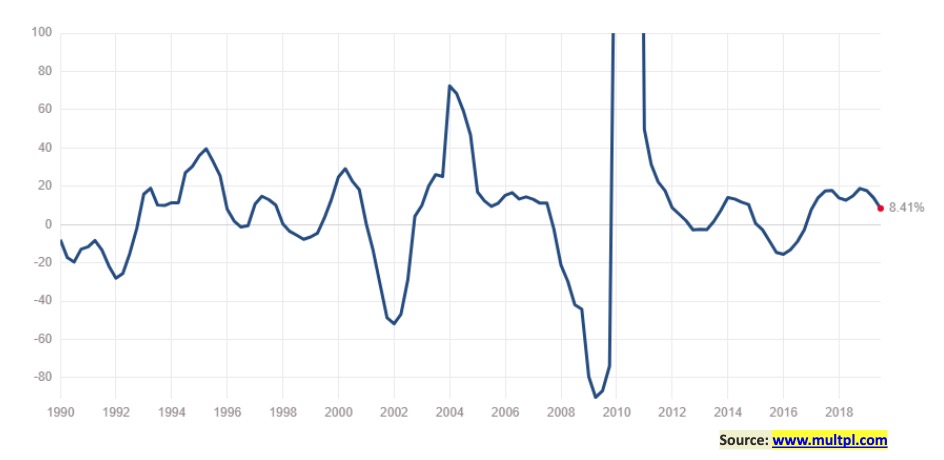
S&P 500 Real Earnings Growth (%) ©David Chapman
Dividend yields are favorable. The S&P 500 dividend yield is 1.86%. That compares favorably with the U.S. 10-year Treasury note at 1.74%. In Canada it’s even better with the S&P TSX Composite dividend yield at 3.1% vs. a yield of 1.59% for the Government of Canada 10-year bond (CGBs).
But P/E levels are in what some would call nose-bleed territory. The Shiller P/E ratio, known as the Cyclically Adjusted PE Ratio (CAPE), stands at 30.24 which is higher than it was at the time of the 1929 stock market crash and far higher than it was in 2007 before the 2008 financial crisis. It was higher recently, but the record high (44.19) was seen in December 1999 at the height of the high-tech/dot.com bubble. The S&P TSX Composite CAPE ratio stands at 23.69 according to Siblis Research.
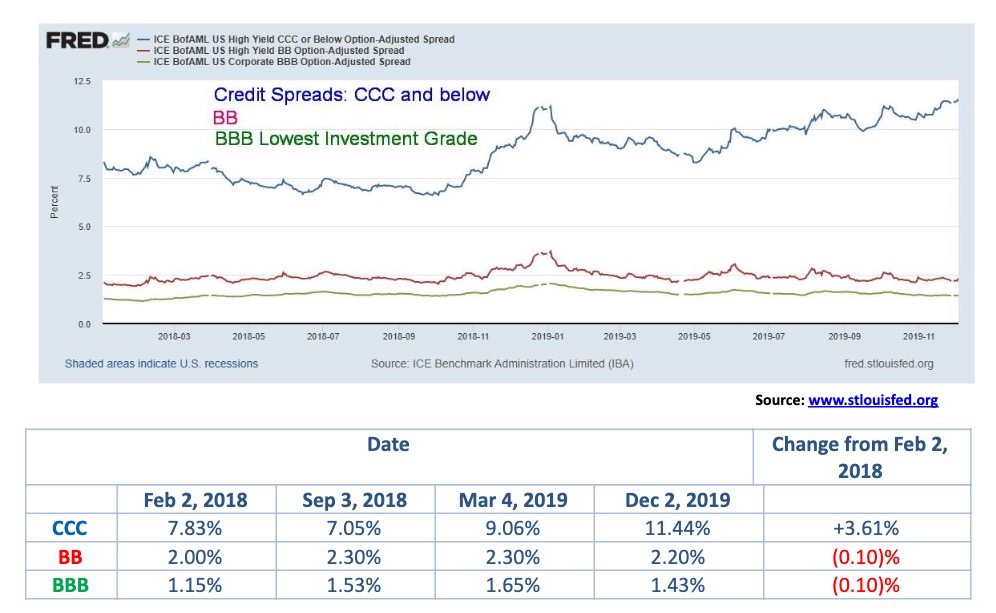
We are seeing a few disturbing issues. Junk bond credit spreads are widening. Since 2018, CCC-rated and below high yield bonds have seen their spread from U.S. Treasuries widened to 11.44% from 7.83%. Surprisingly, the spreads on BB-rated and BBB-rated bonds (the lowest investment grade) have remained stable. As we noted last week, BBB-rated bonds make up the largest proportion of investment grade bonds, making up some 40% of the U.S. corporate bond market. But a slowdown could spark credit downgrades and the funds holding these bonds might have to sell them because they can only hold investment grade bonds.
We have constantly talked about the Fed’s repo program. Many continue to wonder what is going on because no explanation is forthcoming from the Fed. It seems to be the elephant in the room that nobody wants to talk about. Many wonder whether there is a liquidity crisis out there being papered over. Deutsche Bank has been mentioned numerous times and we are well aware of problems in the European banking sector. But could there be a problem in the U.S. banking sector? After all, the Fed is stepping in when the banks who normally provide funds are not providing the funds for the repo market. The real problem we suspect is in the European banking sector. There are major problems in the Chinese banking sector and shadow banking system but that is a problem for PBOC, not the Fed.
Below are a couple of interesting charts. The first one looks horribly disjointed. It is. According to the chart the Fed commenced an aggressive repo program in February 2008. It fell off sharply after October 2008 following the Lehman Brothers collapse in September 2008. It was replaced by the TARP program, designed to bail out the banking system. After that nothing until now, commencing in late August 2019. According to the numbers below, the Fed has added some $207 billion of repo funds to the market.
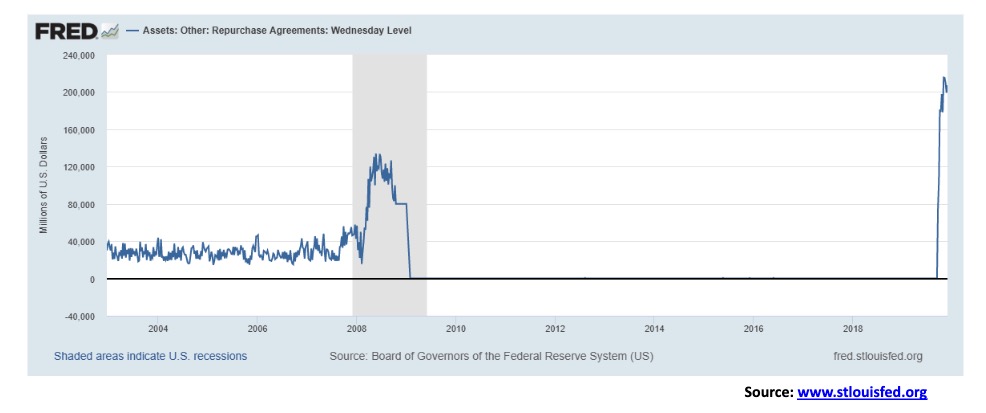
Assets: Repurchase Agreements ©David Chapman
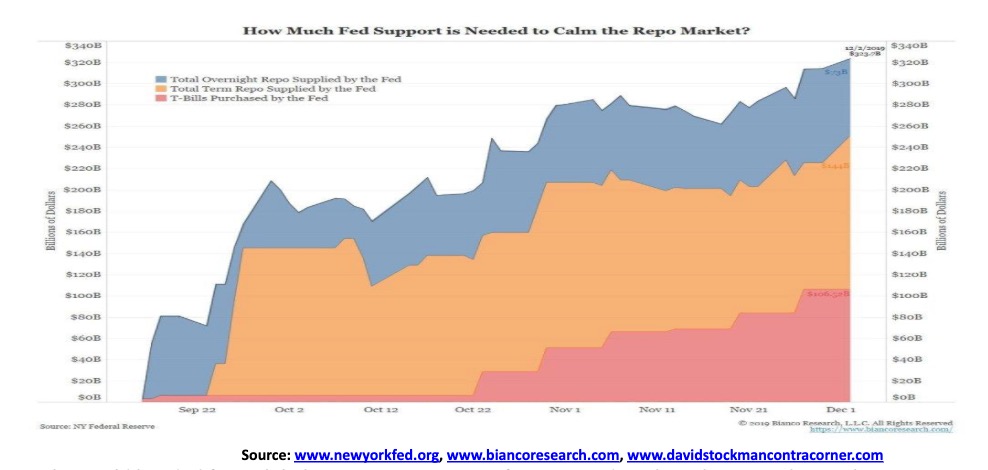
According to the NY Fed, the repo feed has been even bigger. The chart below shows that over $300 billion has been purchased, including both repos and Treasury Bills. The question is easy: how much Fed support is needed to calm the repo market? And why now? And, quite simply, why? What’s going on?
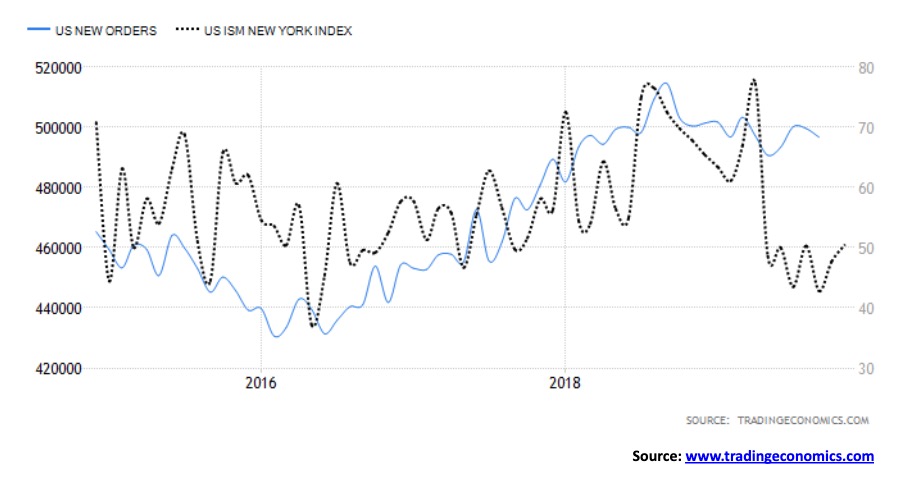
Is the world headed for a global recession? ISM manufacturing indices have been weak. But then, over the past month or two, some (U.S. and China) have improved. The chart below shows the U.S. ISM Index along with U.S. new orders. New orders have been rolling over and down for the past three months. The ISM index improved in November to 50.4 and the Manufacturing PMI jumped to 52.6. Readings over 50 suggest growth in the economy. But globally it is uneven as Manufacturing PMI’s in Japan, Germany, UK and Italy have been below 50, indicating recessionary conditions. China’s PMI recently rebounded as well, back over 50. Canada’s, for the record is 51.4.
The U.S. job numbers came in unexpectedly strong for November. Nonfarm payrolls rose 266,000, well above the consensus of a gain of 183,000. Part of the reason for the improvement was the ending of the GM strike. Of the 266,000 nonfarm payrolls, striking GM workers returning to work were 48,000 of the totals. Those are not new jobs. Of the remaining jobs, over 100,000 were in low-paying jobs in retail, health care, and hospitality. Many could be part-time. Roughly 44,000 were created in professional, technical, and financial jobs.
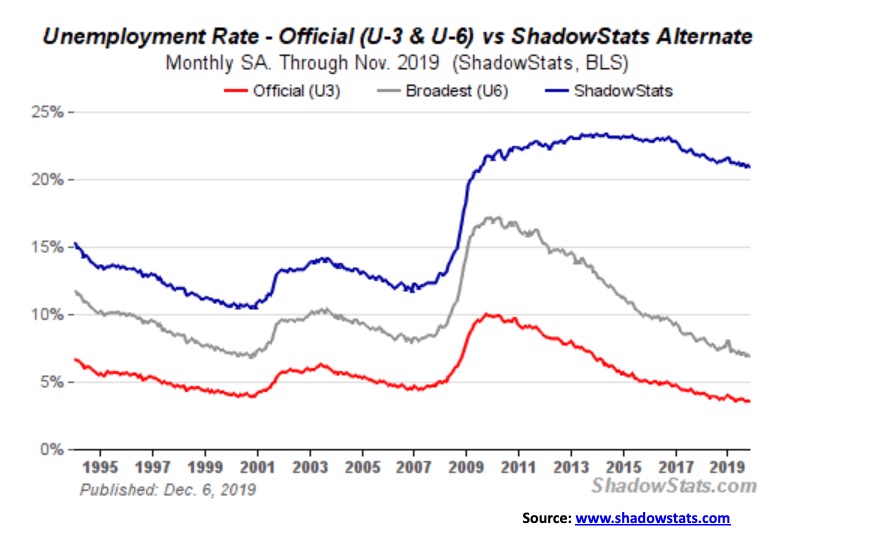
The unemployment rate (U3) fell to another 50-year low at 3.5%, down from 3.6%. The last time the unemployment rate was this low was 1968. The U6 unemployment rate (U3 plus discouraged workers unemployed less than one year plus part-time employees seeking full-time employment) was down to 6.9% from 7.0%. Shadow Stats unemployment (U6 plus discouraged workers defined away in 1994 unemployed over one year) came in at 20.9% vs. 21.0%. The average job growth in 2019 has been 180,000/month vs. 223,000/month in 2018. Average hourly earnings rose 3.1% year over year. That was higher than expected and could put upward pressure on inflation, something the Fed wants.
The unexpected jump in nonfarm payrolls, coupled with the lower unemployment rate, sparked a rally in the stock market. As well, the U.S. dollar rose, bond prices fell (yields rose), and gold fell.
It was no surprise, however, that the labour force participation rate fell in November to 63.2% from 63.3%, given the decline in the U3 unemployment rate. Lowering the participation rate helps lower the unemployment rate. Oddly enough the civilian labour force, according to the Federal Reserve Bank of St. Louis, only rose 40,000 in November. A far cry from 266,000. The number reported not in the labour force increased by 135,000 in November bringing it to 95,616,000. Of that, 54,198,000 are listed as retirees and 9,966,000 are disabled. 37 million are considered to be living in poverty, 11% of the population and 27.3 million are not covered by any health insurance.
Despite the great numbers reported for nonfarm payrolls for November, there was an oddity. A couple of days before the nonfarm payrolls come out, an employment report known as the ADP National Employment Report is released by Moody’s Analytics. Econometrics for the ADP report and the nonfarm report are essentially the same. Yet the ADP report showed only a jump of 67,000 workers for November a far cry from the 266,000 jobs according to the BLS’s nonfarm report. The expectation for the ADP report was for 140,000 jobs. For the nonfarm report the expectation was for 180,000 jobs. The ADP report came in substantially under; nonfarm report came in substantially over. Who’s right? Normally the two are in sync.
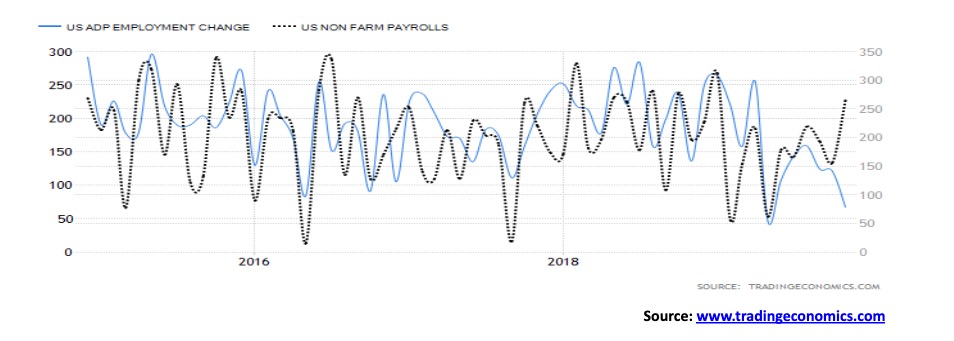
ADP Employment vs. Nonfarm Employment – ©David Chapman
The market, however, focuses on the nonfarm report, not the ADP report. The stronger than expected jobs numbers no doubt could put the Fed on hold as far as lowering interest rates are concerned. Many economists are now scratching thoughts of a recession. The Fed is saying that, given the strong labour market, the U.S. should be able to maintain a stable economy.
Canada wasn’t so lucky. Canada’s equivalent of the nonfarm payroll came in as a loss of 71,200 jobs in November. That consisted of a fall of 38,400 full-time jobs and 32,800 part-time jobs. The market had expected a gain of 10,000. The unemployment rate jumped to 5.9% from 5.5%, even as the labour force participation rate fell to 65.6% from 65.7%. Is Canada headed for a recession?
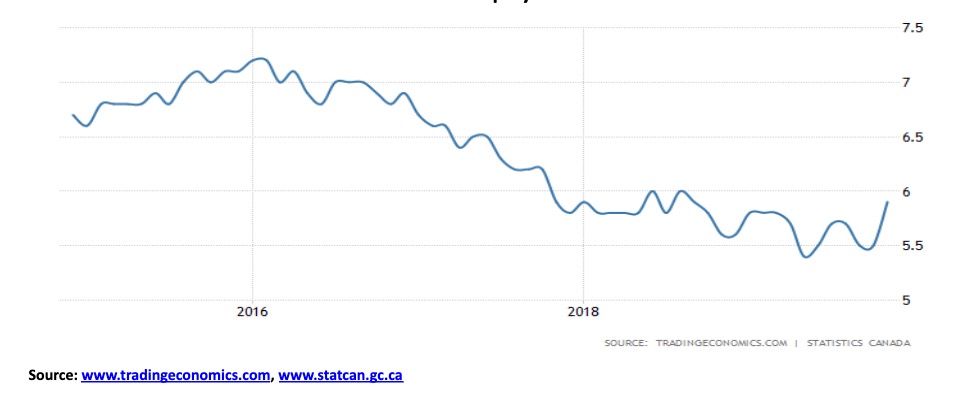
Canada Unemployment Rate – ©David Chapman
The job numbers in the U.S. may be calming for the authorities and stock market bulls. Consumer sentiment also improved, coming in at 99.2 vs. 96.8 in November. It is now recession, what recession? Will FOMO take over in the stock market and we will burst out to even higher highs? The stock markets on Friday surged on a wave of euphoria. Any talk of the Fed cutting rates at the December is all but dead. The focus is shifting to 2020. But then there is the background noise of global protests, impeachment, climate crisis, and the tweets of the President on trade with the looming December 15 date for at least some modicum of a trade deal with China. And, to add to that, the mystery in the repo market.
Markets And Trends #1 – ©David Chapman
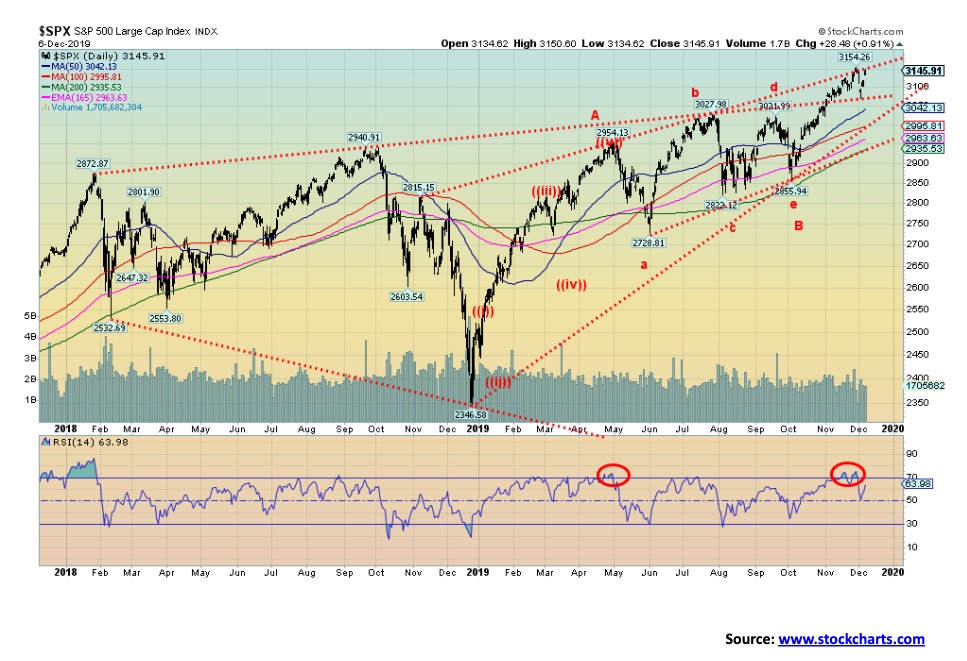
Friday’s higher than expected nonfarm payrolls sent stock markets flying upward with the S&P 500 gaining 28+ points or almost 1.0%. It saved the week that started out poorly on Trump tweets of tariffs against Brazil and Argentina and threats against France. The S&P 500 finished the week up a small 0.1%. Other indices did not fare as well. The Dow Jones Industrials (DJI) lost 0.15%, the NASDAQ was off 0.1%, and the Dow Jones Transportations (DJT) dropped 1.4%. The fact that the DJT was down so sharply and continuing to fail to make new all-time highs is a divergence we can’t ignore. It also signals to us that global trade is not doing well.
That the averages must confirm each other is a basic tenet of Dow Theory; however, the DJI and DJT continue to diverge with each other. Every time we have seen this happen it resulted in the strong index eventually joining the weak index to the downside. Interestingly enough, the S&P 600 small cap was up 0.9% on the week and made new 52-week highs. It was not, however, a new all-time high. For the record, the NYSE Composite gained 0.3% and is within 50 points of its all-time high. The S&P 400 mid cap was up 0.6% and it too is within 20 points of its all-time high. Of the FAANGs, both Apple and Google made new all-time highs this past week.
Internationally, the London FTSE fell 1.8%, the Paris CAC 40 was off 1.8%, and the German DAX dropped 1.4%. In Asia, China’s Shanghai Index (SSEC) was up almost 1.0% and Japan’s Tokyo Nikkei Dow (TKN) gained 0.3%. Could there be a shift into Asia? We noted last week that the SSEC looked potentially bullish. Other Asian markets saw Hong Kong’s Hang Seng Index gain 0.6% while the Singapore Straits Times Index was essentially flat. India’s Nifty Fifty Index, on the other hand, lost 1.1%.
So, what’s next for the North American stock markets? Once again, we are up against the channel lines. We will either fail or burst through. If we burst through, the move should be what we call a blow-off. We are not going to rule that out. This week is the FOMC (Dec 10–11) and the wide expectation is that they will leave interest rates unchanged. As well, the December 15 tariff date with China is looming and our expectations, based on what we are reading and sensing, are that Trump will leave things alone. He wants a deal but doesn’t need one immediately. He mused that it might have to wait until after the election, but we wouldn’t hold our breath. At this point, with impeachment looming, he may not want to rattle or provoke the Chinese further. If nothing happens, then the stock market could burst through the channel and start a blow-off move into January 2020. Think of it as a Santa Claus rally on steroids.
If, however, things fail then the stock market could turn down once again. In the interim, we could see new all-time highs. The S&P 500 has some room to move higher this week within the channel but not much, possibly to 3,175. The first sign of trouble would be for the S&P 500 to break back under this week’s low at 3,070. A break under 3,000 would be negative and suggest a decline to 2,900.
So, two scenarios for this week. One, we wiggle higher but eventually fail. Or two, we burst through and start a blow-off move into January. Since December 15 falls on the weekend, the scenario might not play itself out until the following week. Either way, for investors a blow-off move is for speculators only. And either way it promises to be an interesting week.
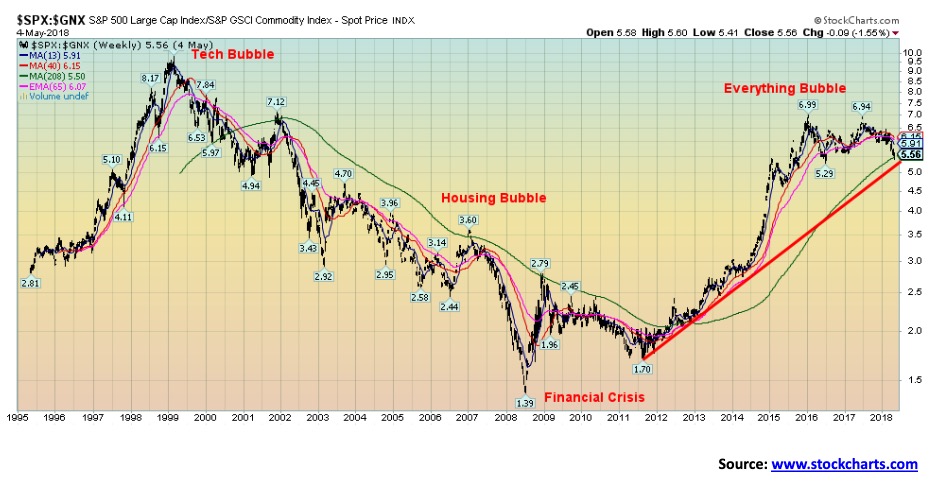
This is an interesting chart. This is the S&P 500/S&P GSCI Commodity Index ratio. A rising ratio favours the S&P 500 over commodities. A falling ratio favours commodities over stocks. This ratio is another way of looking at the DJI/Gold ratio. From the peak in 1999 to the final low in June 2008, commodities were favoured. The final low was seen in August 2011 which coincidently coincided with the top in gold. Since then, stocks have been favoured over commodities. However, the ratio topped in January 2016 and that top has held since. This past week the ratio fell 1.6%, suggesting commodities are being favoured over stocks. The ratio is threatening to break down under the 4-year MA and break under the uptrend line from the 2011 low. On Friday the ratio closed at 5.56. The 4-year MA is at 5.50 and the uptrend line is just below near 5.20. A firm breakdown under 5 would set the tone and we could go on a multi-year run of commodities being favoured over stocks. The ratio, of course, could still bounce around here but it is noteworthy we are approaching that 2016 low at 5.29. A break of that level could set up the break of the uptrend line. Something to watch going forward. A breakdown of this ratio would also be positive for gold.
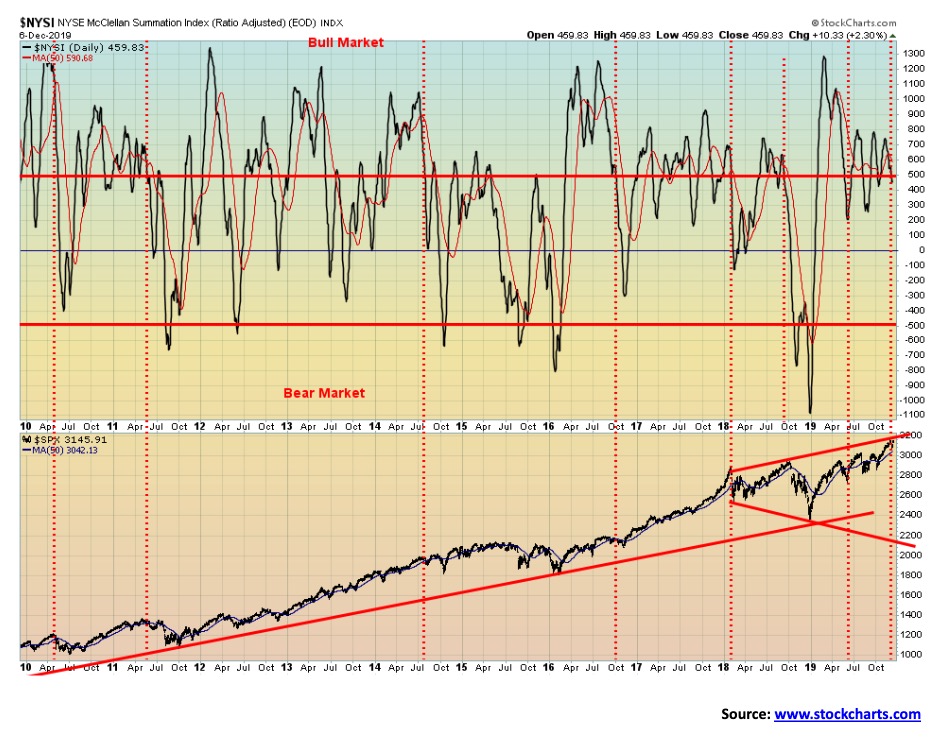
This past week the McLellan Summation Index (ratio-adjusted), known as the RASI, fell under 500 even as the S&P 500 was moving higher. This a divergence. It doesn’t mean that the S&P 500 is about to top, but it does act as a potential warning sign. The NYSE advance-decline line continues to rise, suggesting to the bulls that the stock market should also move higher. The VIX volatility indicator is falling once again but we’ll watch for divergences. If the VIX does not make new lows along with the S&P 500 making new highs that would act as another warning sign. The put/call ratio still favours calls as the market moves higher this past week. So, while some sentiment and breadth indicators remain positive, the RASI is signaling the opposite. No, it doesn’t the mean the market is about to fall but it is a warning sign.
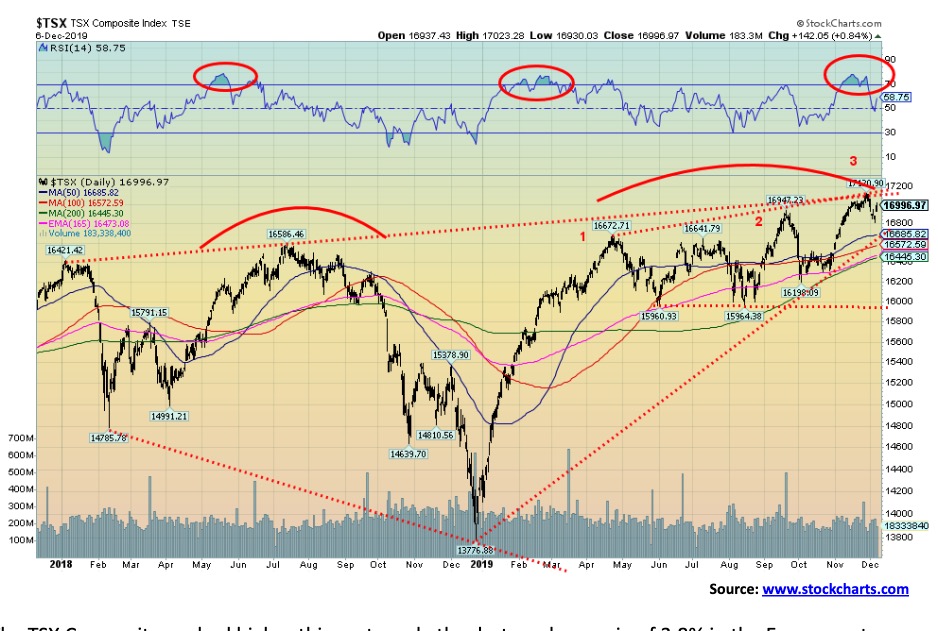
The TSX Composite pushed higher this past week, thanks to a sharp gain of 3.8% in the Energy sector. The TSX Energy Index (TEN) represents 16.1% of the TSX Composite. Financials are the largest TSX component and with them falling 2.0% this past week it most likely prevented the TSX Composite from making new highs. The Financials represent 32.1% of the TSX. The rise in the TSX did not take out the top of what appears as a potential ascending wedge triangle this past week. Only a firm breakout over 17,200 would do that. Two sub-indices did make new all-time highs this past week: Information Technology and Utilities. Only three of the 14 sub-indices were down on the week. Besides Financials, both Consumer Discretionary and Materials were down. Real Estate was flat while the remaining 10 sub-indices posted gains on the week. The recent low for the TSX Composite was at 16,816, so a breakdown under 16,800 would be negative, particularly if accompanied with no new high. A breakdown under 16,800 could set up a fall down to 16,500 at minimum. On a positive note, the TSX Venture Exchange (CDNX) put in another up week, gaining almost 1.2%. That marked the third consecutive week of gains and turned the daily or short-term trend neutral from down. Could there be a shift into small caps going on?
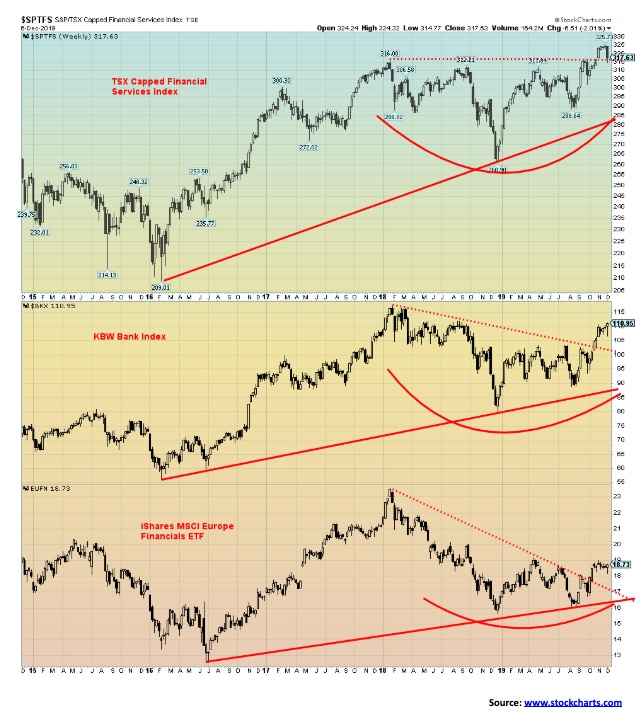
With bank earnings in Canada coming in below expectations, the TSX Financials Index (FS) fell 2.0% this past week. Bank indices, represented here by the KBW Bank Index (BKX) in the U.S. and the iShares MSCI Europe Financials ETF (EUFN), paused but didn’t fall. If there is trouble in the banking system being papered over by the Fed’s repo program it is not showing. All three indices appear to have broken out in October/November. The pause or pullback could be a test of the breakout zone. The TSX Financials would only fail with a breakdown under 300. Both the BKX and the EUFN do not appear to be poised to break down and both could be poised to move higher. But a test of the breakout zone is positive to ensure that the breakout is solid.
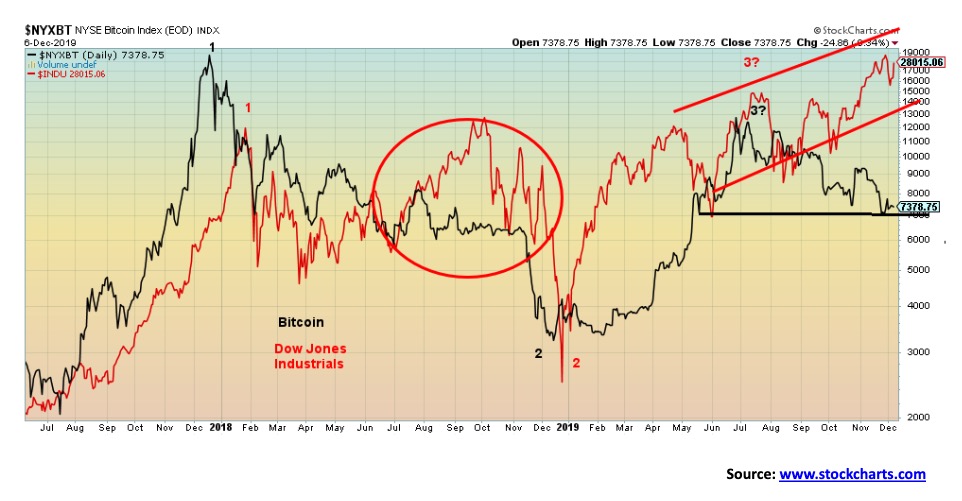
Bitcoin began trading back in 2015, and ever since then Bitcoin and the DJI have generally followed the same route. Bitcoin made its big top in December 2017 and the DJI followed, making its top in January 2018. Both Bitcoin and the DJI made important lows in December 2018. Bitcoin’s most recent top was in June 2019 and the DJI did follow with a high in mid-July. However, the two started to diverge in August with the DJI turning up and Bitcoin continuing down. That happened back in 2018 as well. In August 2018, both Bitcoin and the DJI turned higher. However, before month-end, Bitcoin turned down once again even as the DJI turned higher. The DJI didn’t top until October. Bitcoin never recovered even as it was drifting lower. Both Bitcoin and the DJI then plunged from November into the December 2018 lows. The two tend to follow each other, so when they don’t it is a divergence. Bitcoin is still moving lower even as the DJI is turning higher. As in 2018, Bitcoin could be building a platform to eventually fall off of. Could the DJI then follow? Bitcoin lost 4.5% this past week but still remains up almost 100% on the year. There are still a mind-boggling 4,904 cryptocurrencies listed at Coin Market Cap. The market cap of all cryptos has fallen to $204.5 billion with Bitcoin the largest at a market cap of $136.9 billion, representing almost 67% of the entire crypto market. Together with number 2 and 3, Ethereum and XRP, they represent a market cap of $162.9 billion or almost 80% of the crypto market. Doesn’t leave much for the other 4,901 cryptos. There are still 11 cryptos listed with a market cap of $1 billion or more.
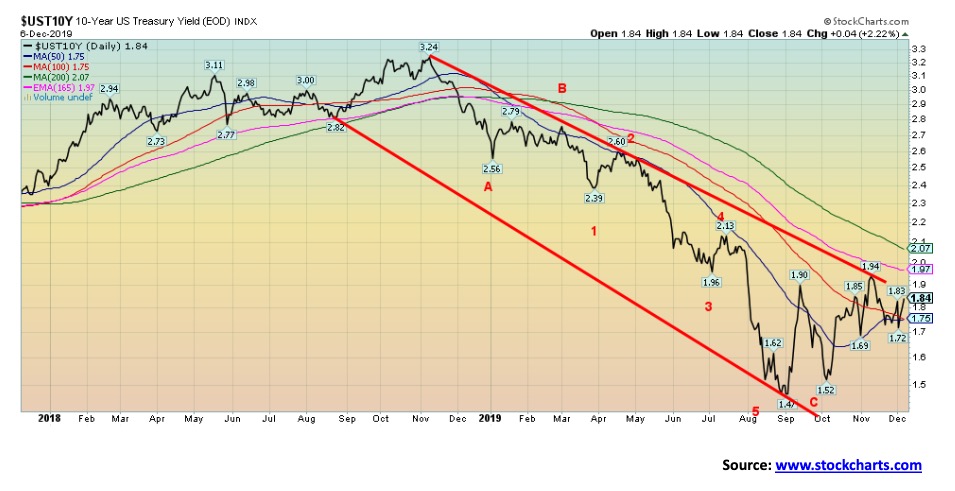
Friday’s stronger than expected nonfarm payrolls helped push up bond yields as the U.S. 10-year Treasury note closed at 1.84%, up 3.4% on the week or 6 bp. There is resistance just above at 1.90%, but a break above that level could send the 10-year up over 2.00%. The 200-day MA is currently at 2.07% and that could be a target. The strong nonfarm payrolls on Friday seems to have ended any talk that the Fed might cut their key interest rate at the Dec 10–11 meeting. Nonetheless, with the Fed meeting this week it should be another volatile week. This week’s meeting is the final one of 2019. We are also starting to approach the December 15 date for imposing more tariffs on China. Here, the action in the stock market and bond market seems to suggest that there won’t be any further moves on tariffs, irrespective of whether there is at least some sort of preliminary deal in place. Also, out this coming week is the consumer price index (CPI). The market is expecting a 0.1% gain in the CPI and a 0.2% gain in the core inflation rate (ex food and energy). Year over year, the expectation is for the CPI to be up 1.9% and the core inflation rate to be up 2.3%. Anything higher could send bond prices lower, yields higher (yields move inversely to prices). The CPI is due on December 11, the same date that the Fed makes its interest rate decision. The Fed would welcome more inflation. The PPI comes out the next day, December 12, and on Friday the 13th we get retail sales (expected gain of 0.3% for November). The jagged upward pattern we are seeing for the 10-year suggests to us that we should break out above 1.90% and eventually over 2.00%. A break under 1.70% would send bond yields lower. But we suspect that would only occur if the Fed cuts rates and CPI and retail sales surprise sharply to the downside.
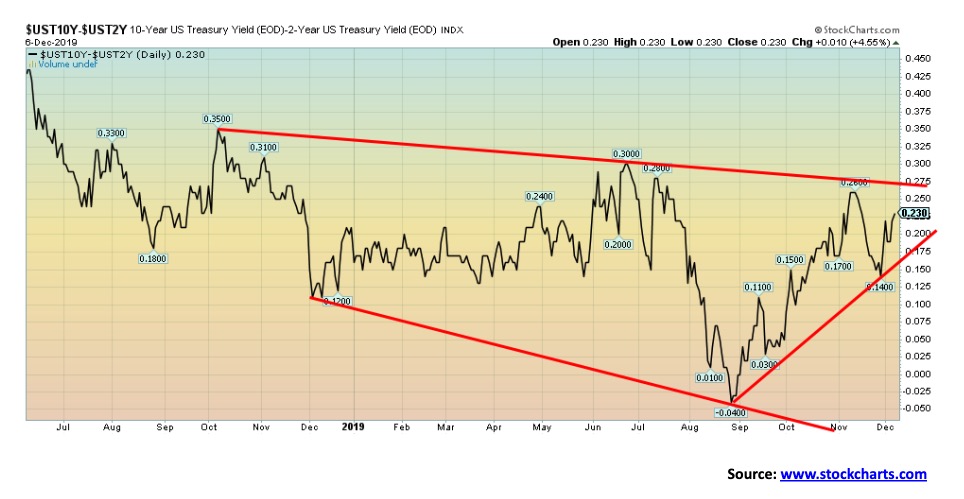
Recession Watch Spread – ©David Chapman
Our recession watch spread of the U.S. 10-year Treasury note less the U.S. 2-year Treasury note widened again, this time to 23 bp from 17 bp the previous week. The 2–10 spread only briefly went negative back in August. Since then it has reverted to positive. A negative yield curve could signify a coming recession, but history also shows that the recession doesn’t become a possibility until the yield curve re-inverts positive once again.
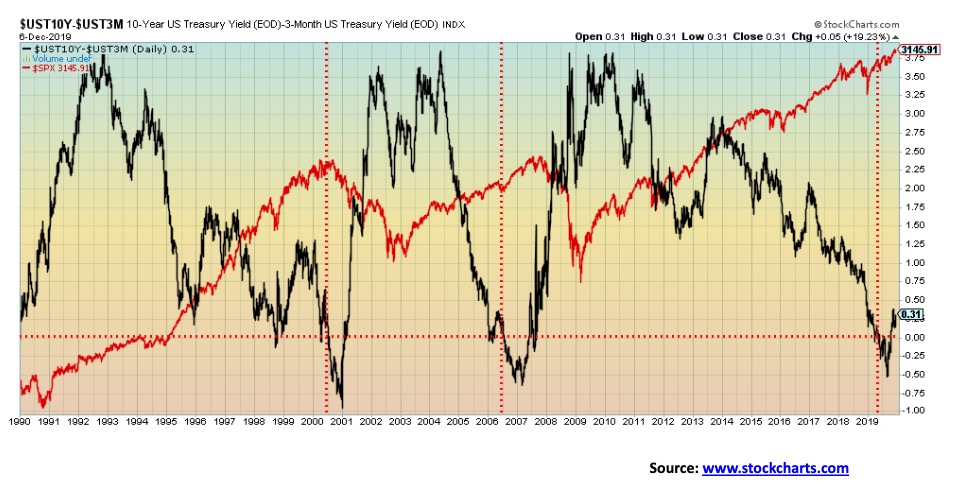
This chart shows us our second recession spread using the U.S. 10-year Treasury note less the U.S. 3-month Treasury bill (3m–10 spread). Note how, once the spread goes negative, that the S&P 500 has a tendency to keep on rising. This was especially the case back in 2006. It wasn’t until the 3m–10 spread re-inverted positive once again that the S&P 500 eventually fell and that wasn’t right away. So far, we are seeing the same thing. The 3m–10 spread went negative in May 2019, hitting a low of negative 52 bp in August. The curve re-inverted positive again in October and is now positive 31 bp. Quite the turnaround. The S&P 500 has also continued to the upside, gaining 6.5% since early October. Back in 2007 the 3m–10 spread turned positive in July. The S&P 500 topped in October. If the time lag is the same this time around, and there is no rule that says it has to be, then the stock market could make its final top in January 2020.
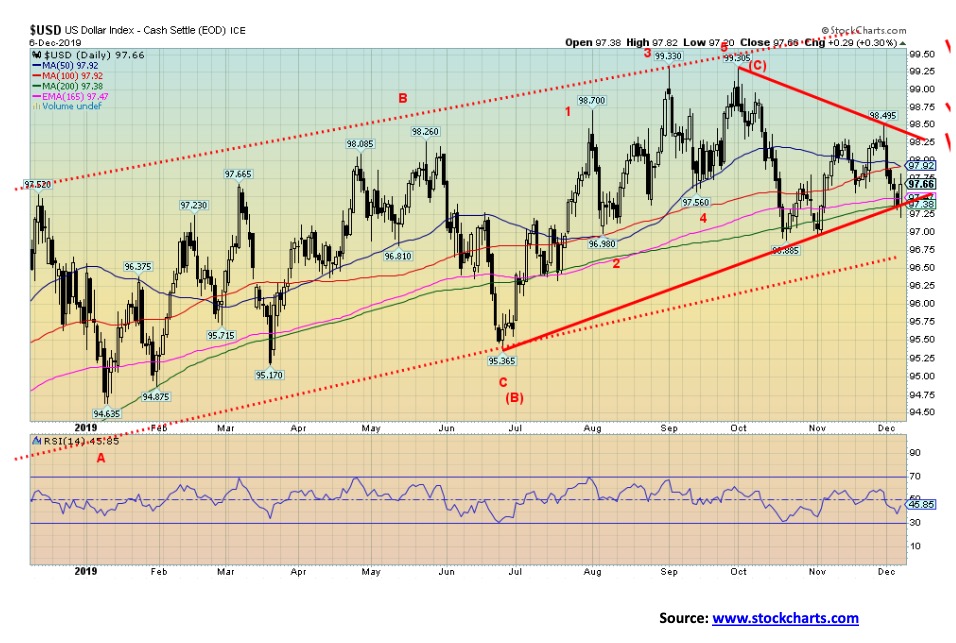
The stronger than expected nonfarm payrolls on Friday may have saved the US$ Index from a breakdown. The US$ Index spiked down to a low of 97.20 before reversing and closing up on the day. So, is this another save for the US$ Index? Maybe, but we wouldn’t bet on it until the index takes out 98.25 to the upside. The odds and the pattern continue to favour the downside. Friday’s rebound didn’t save the US$ Index from a down week. It lost about 0.6%. The euro was up 0.4%, the Swiss franc gained 1.0%, the pound sterling leaped up 1.6%, while the Japanese yen was up 0.8. The Canadian dollar gained a small 0.1%. For the Canadian dollar it would have been more, but Friday’s job numbers in Canada were the opposite of the U.S.’s nonfarm payrolls and, as a result, the Canadian dollar reversed sharply to the downside. The pound sterling’s gain is now pointing to a big Conservative victory this coming week. For better or worse, Boris Johnson’s Conservatives appear headed to victory. That ought to seal Brexit with all its potential for economic disruption. The US$ Index’s reversal on Friday was impressive but it should be ultimately short-lived. There might be some follow-through, but the odds favour a return to the downside. Another break of 97.30 would seal the deal and target the US$ Index next down to 96.75. Below 96.75, further downside could occur. As noted, only a breakout above 98.25 might change the bearish scenario. Resistance is seen up to 98.
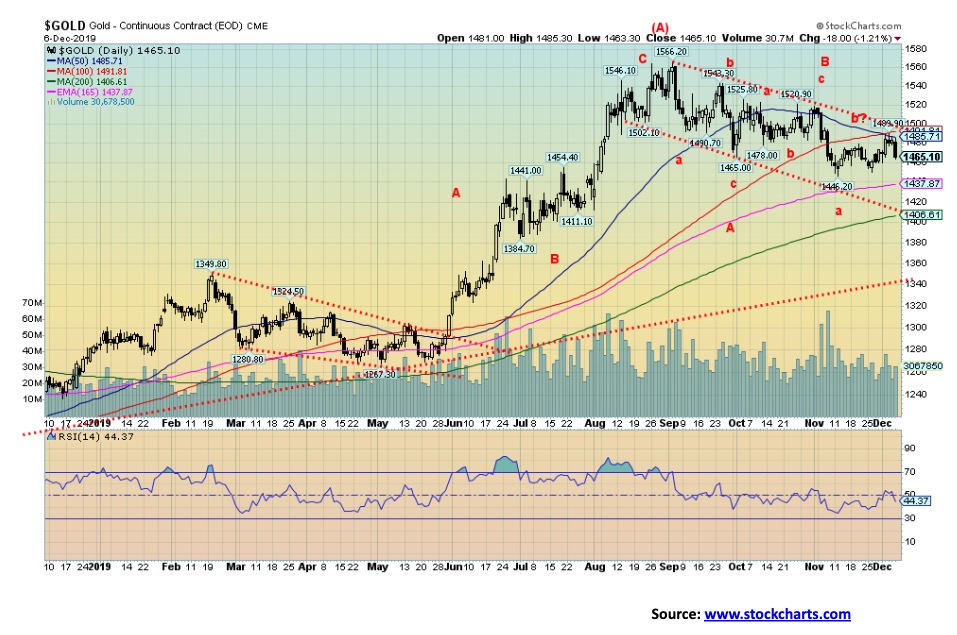
Gold started the week rising on word that the U.S./China trade deal may falter again and the imposition of tariffs on Brazil and Argentina. It fell sharply on Friday following the release of the stronger than expected nonfarm payrolls. That the nonfarm payrolls have questionable calculations, overstate the real position, and are subject to revisions down the road makes little difference in the here and now. Gold fell 0.5% this past week while silver was down 3%. Gold and silver diverged as silver made a new low for its move to the downside but gold did not. Both gold and silver diverged with the gold stocks as they rose while gold and silver (the metals) fell. Platinum was off a small 0.2% but palladium continued its record-breaking pace, gaining 2.2%. Copper exhibited strength off of the nonfarm payrolls and rose 2.4% on the week. That’s potentially good for gold as copper has a tendency to lead gold. Sentiment towards gold and silver is not what we would deem extreme. Too many people in the gold commentary industry remain too bullish. We were also perplexed with the bet that a mystery buyer made purchasing 5,000 call options on gold at a $4,000 strike price with an expiry date of June 2021. Moneywise, that was a $1.75 million bet. Since most purchases of options expire worthless it is quite a bet. It is also the kind of thing we’d expect to see at significant tops. However, with the U.S. dollar looking increasingly toppy, who knows—the bet may pay off big time. The buyer doesn’t need to reach $4,000. The buyer just needs a significant spike and the options would increase in value. Nonetheless, there could be another plunge coming here for gold to complete the c wave of what appears as a double zigzag pattern abcabcabc. Gold may or may not see new lows. New lows would be below $1,446 and potentially take gold down towards $1,420. Our breakout point remains at $1,500 with resistance above there at $1,520. Above $1,530/$1,540 gold could make new highs above $1,566. We continue to have unfulfilled targets for gold up to $1,725 based on the huge multi-year bottom pattern that formed between 2013 and 2019. Others have much higher targets.
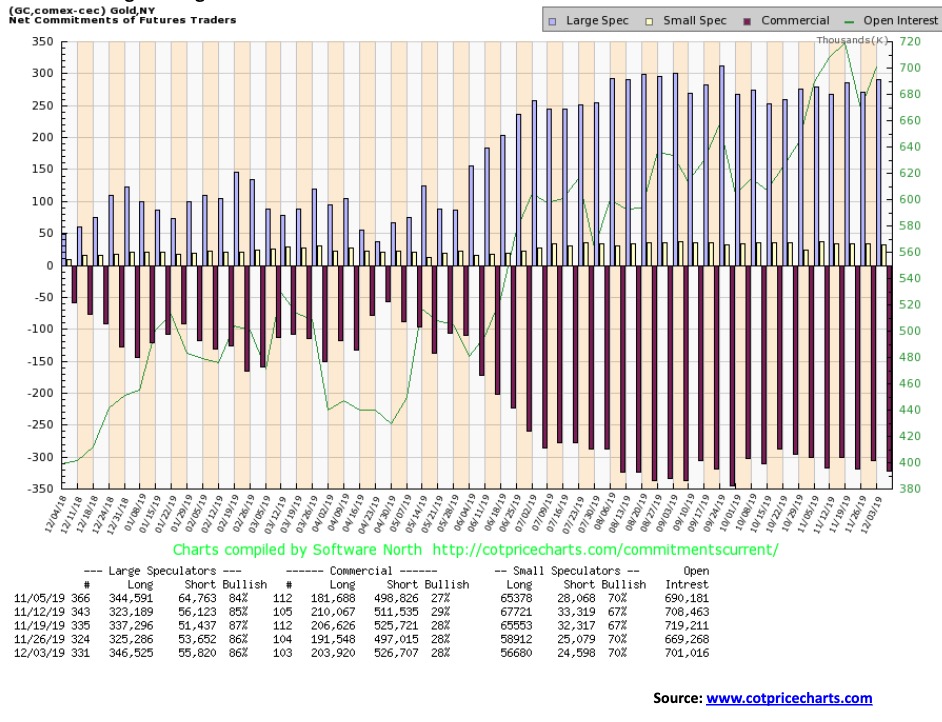
The gold commercial COT has not been encouraging. The commercial COT came in at 28% this past week unchanged from the previous week. However, the mix changed as long open interest rose over 12,000 contracts while short open interest over 29,000 contracts. We interpret that as being bearish going forward. We do note, however, that even the commercials can be wrong sometimes. The large speculators COT (hedge funds, managed futures, etc.) was also unchanged at 86%. That remains rather bearish.
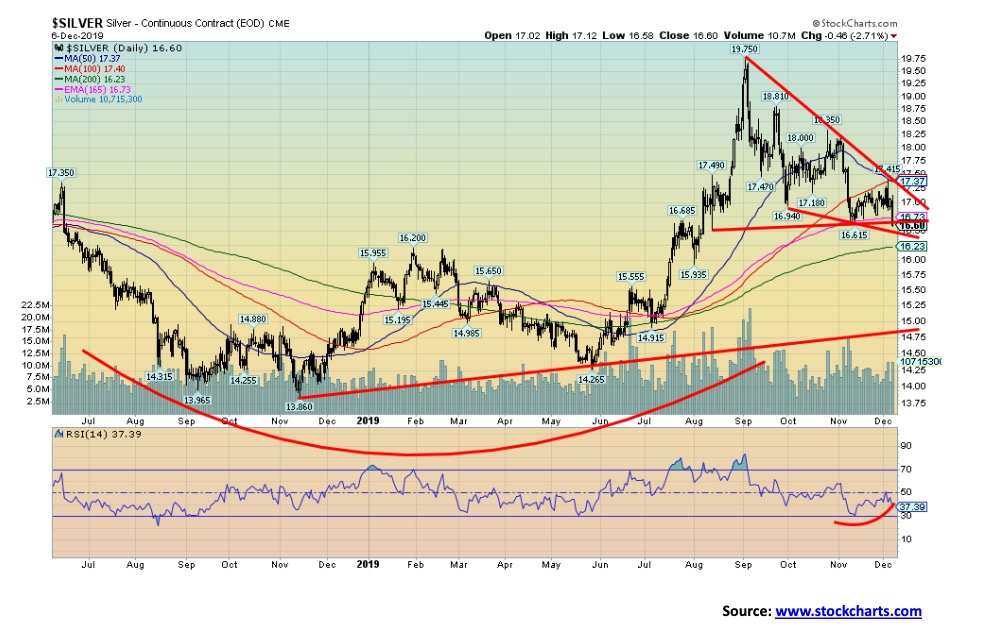
As we noted, silver fell to a new low for the move down this past week but it was not confirmed by gold which failed to make new lows. Silver was down 3% this past week. The gold stocks were up on the week instead of down and they remain off their lows. Silver is still holding in the triangle configuration; however, it is at the lower end of the pattern. A breakdown under $16.50 could suggest that silver could fall to next support near $16, with interim support near $16.25. Below $16, major support would not come until it reached near $15. To the upside, the recent high near $17.40 is proving to be resistance so a break over that level could send silver quickly up to $18. Silver is at a crossroads here. Volume hasn’t been impressive, suggesting all this backing and filling is corrective in nature.
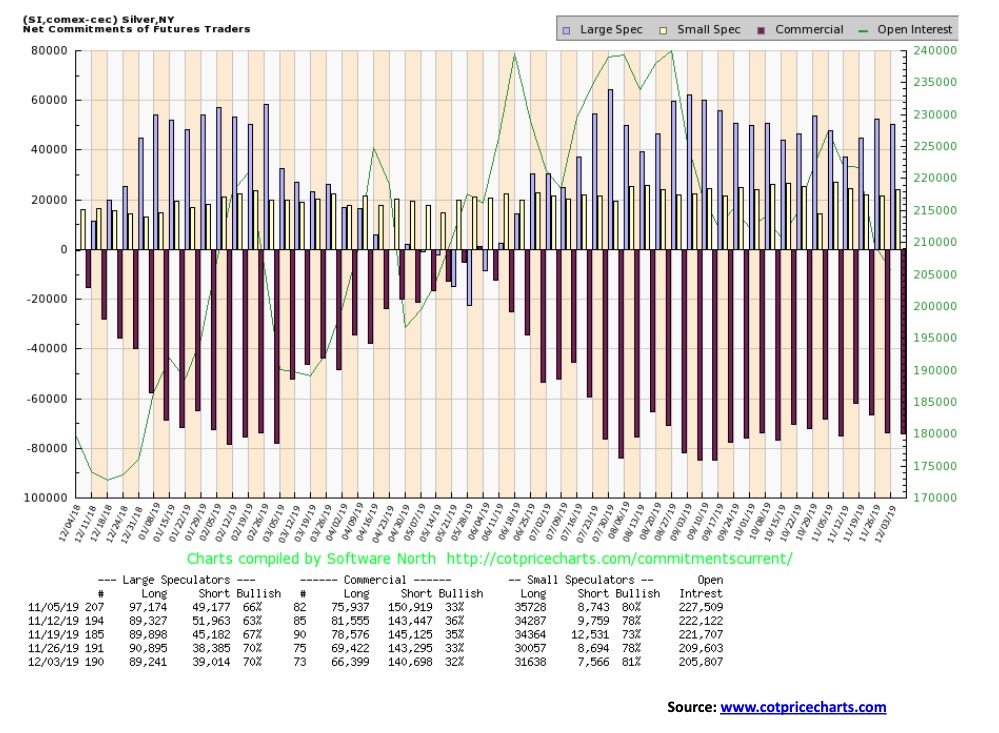
We were hoping to see some improvement in the commercial COT for silver, but no such luck. The commercial COT actually slipped this past week to 32% from 33%. It wasn’t as bad as it looks as long open interest fell roughly 3,000 contracts and short open interest fell about the same. The large speculators COT was unchanged at 70%. Overall, the silver commercial COT remains somewhat bearish, suggesting we may have further downside work to do on silver prices.
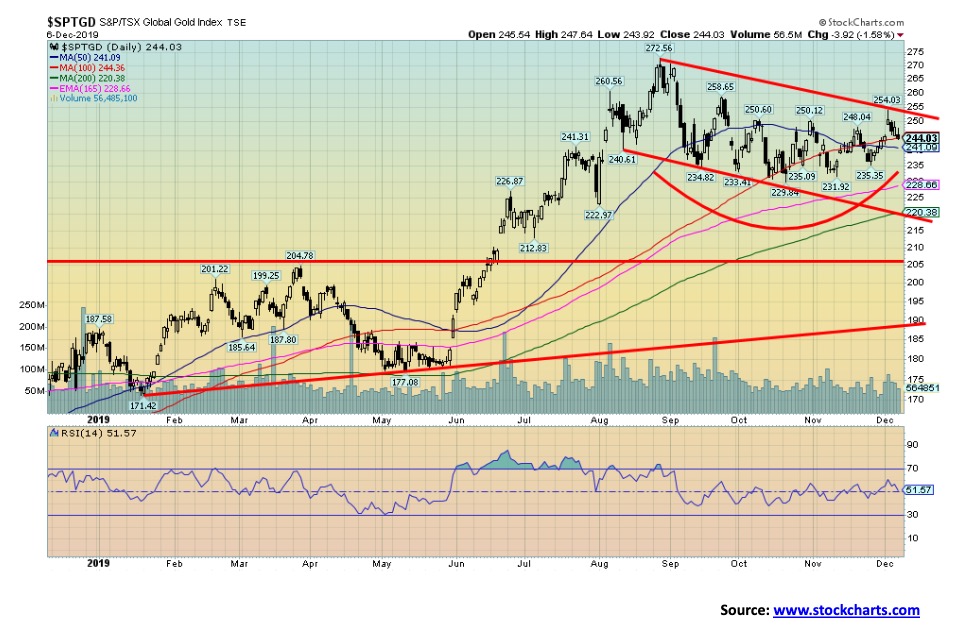
The gold stocks are failing to keep pace to the downside with gold and silver. This is a potentially positive and encouraging development. Both the Gold Bugs Index (HUI) and the TSX Gold Index (TGD) saw gains this past week, even as both gold and silver closed lower on the week. The HUI gained almost 1.2% while the TGD was up a more modest 0.1%, but at least it was positive. Both have continued their blistering pace in 2019 with the HUI up 35.4% and the TGD up 30.7% on the year. Sentiment is rather neutral with the Gold Miners Bullish Percent Index currently at 72. A level of 100 would be extreme bullishness while 0 would be extreme bearishness. The only time we saw extremes was the July 2016 top and the December 2015 low. Since making a low at 230 on October 22, the TGD has been making a small series of higher highs and higher lows. We appeared to break out earlier in the week, but the failure to hold the breakout caused us to reset our breakout point. Currently that is at 255. A firm breakout over that level that holds could target up to 295–300. Support is now at 235–240 and the TGD would not break down unless it broke under 230. A breakdown under 220 would be fatal to the TGD and we could fall sharply from there. Major long-term support is seen at 190. Indicators are pretty neutral here, so if gold and silver turn up again the gold stocks will benefit considerably.
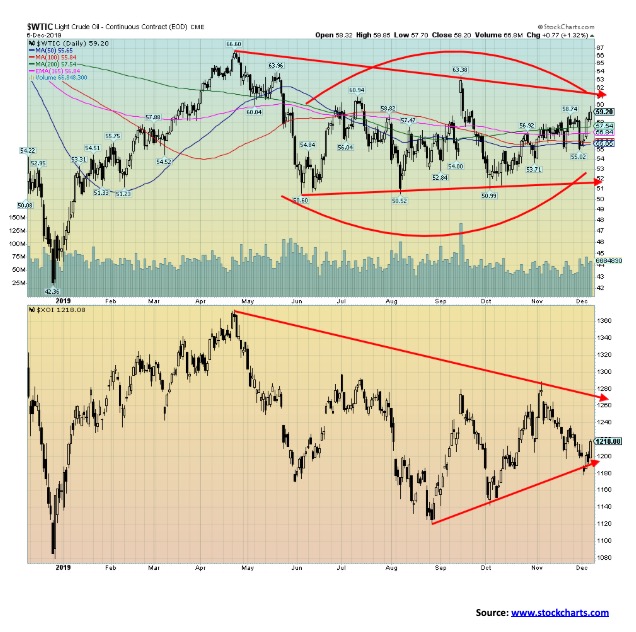
Cut, cut, cut! Surprise! OPEC, led by Saudi Arabia, did surprise everyone this past week by agreeing to an additional 500,000 bpd cut. The Saudis said they would maintain their unilateral cuts beyond what was required to defend oil prices. Oil responded by jumping $4 on the week or 7.3%. The 500,000 bpd is in addition to cuts made last March. OPEC was already producing below their current limit. So, some were wondering what these additional cuts might mean. There are already production issues in Iraq and Iran because of ongoing unrest in both countries and severe sanctions placed on Iran.
The WTI oil chart is now looking bullish, just in time for the best seasonals. The December–June period is known as the best period to be invested in oil and gas. Natural gas prices managed a gain of 2.2% on the week. The energy stocks responded positively with the Arco Oil & Gas Index (XOI) rising 1.4% and the TSX Energy Index (TEN) doing even better with a gain of 3.8%. WTI oil jumped off of support of converging MAs and closed over the important 200-day MA. But resistance lies above at $60/$62. Once WTI oil clears $62, targets could be up to $75 to $80. The XOI is just starting to rise and has some distance to go to break out over 1,260 with targets up to 1,800. The TEN (not shown) needs to break out over 138 and would then have targets up to 190. WTI oil has solid support, it appears, down to $55/$57. The XOI has support down to 1,180. If oil should fail, the absolute breakdown point is at $50/$52.
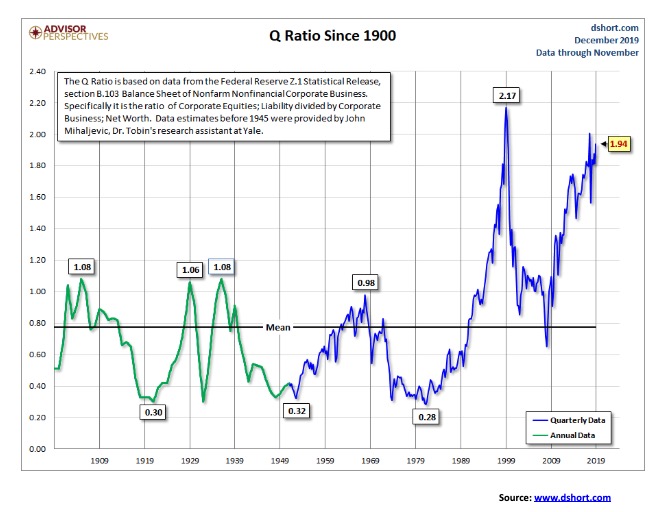
Ah, yes. The Q ratio—or, as it is more properly known, Tobin’s Q Ratio. Nobel Laureate James Tobin developed the Q ratio as a method of evaluating the fair value of the stock market. The Q ratio is the total price of the market divided by the replacement cost of all its companies. Because of the complexity of calculating this, the government actually does the work by collecting all the data. The Fed supplies the numbers through its financial account releases.
The data, while important, is a lagging one as it is usually at least two months behind at any point in time. Earlier data was calculated in a somewhat different manner, even if the data is ultimately comparable. The all-time high for the Q ratio was at the peak of the high-tech/dot.com bubble in 1999–2000 when it hit 2.17. That suggested that the market price was 180% overvalued. The most recent data suggests that the market price is 150% overvalued. It is higher than it was even at the time of the 2008 financial crisis.
Despite the overvaluation, it is noted that overvalued and undervalued are conditions that can persist for some time, even years. Ultimately, however, it reverts to the mean. And the Q ratio correlates well to stock market peaks and bottoms. The tech bubble peak was a prime example. Given that the Q ratio is currently considerably overvalued, it is something to keep in mind going forward. This does not last forever.
—
(Featured image by Hermes Rivera via Unsplash)
DISCLAIMER: This article was written by a third party contributor and does not reflect the opinion of Born2Invest, its management, staff or its associates. Please review our disclaimer for more information.
This article may include forward-looking statements. These forward-looking statements generally are identified by the words “believe,” “project,” “estimate,” “become,” “plan,” “will,” and similar expressions. These forward-looking statements involve known and unknown risks as well as uncertainties, including those discussed in the following cautionary statements and elsewhere in this article and on this site. Although the Company may believe that its expectations are based on reasonable assumptions, the actual results that the Company may achieve may differ materially from any forward-looking statements, which reflect the opinions of the management of the Company only as of the date hereof. Additionally, please make sure to read these important disclosures.


The TopRanked.io Weekly Affiliate Marketing Digest [The Top VPN Affiliate Programs Roundup]
Want to be let in on a little secret about two massive affiliate opportunities you can take advantage of today?...


Sustainable Finance Faces Hurdles as Green Asset Ratio Reforms Fall Short of Full Transparency
The Green Asset Ratio (GAR) measures banks' alignment with the EU Taxonomy but remains low due to methodological flaws and...


XRP Hits New All-Time High Amid U.S. Crypto Policy Shift and Ripple’s Expansion
XRP surged past its 2018 all-time high, reaching $3.65 amid renewed political support for crypto in the U.S. under Trump....


Germany Moves to Curb Medical Cannabis Abuse, Sparking Access Concerns
Medical cannabis imports in Germany have surged, but health insurance-covered prescriptions remain low. Easy online access raises concerns about abuse...


JPMorgan’s Data Fees Shake Fintech: PayPal Takes a Hit
JPMorgan Chase will charge fintechs for customer data, threatening business models reliant on free access. PayPal’s stock plunged 5.7% after...
 |
|
 |  |
 |
|
-

 Fintech1 week ago
Ripple and Mercado Bitcoin Expand RWA Tokenization on XRPL
-
 Crypto11 hours ago
XRP Hits New All-Time High Amid U.S. Crypto Policy Shift and Ripple’s Expansion
-

 Impact Investing1 week ago
Italy’s Electric Cars Market Rebounds, but 2030 Targets Remain Elusive
-

 Cannabis3 days ago
Germany Moves to Tighten Medical Cannabis Rules Amid Surge in Private Use