Featured
The US stock market analysis – is recession still coming?
Is a recession coming? Slowdown yes. Recession maybe. Bad news is souring investor confidence and the fed is continuing its mysterious repo programme. Is this just to keep a lid on interest rates or is there a major liquidity crisis brewing? There are banking problems in the EU and China and the looming shadow of a trade war continues to cause concern.
“History is a collection of agreed upon lies.”
Voltaire, French philosopher, writer, historian, advocate of free speech; 1694–1778
“Experience is helpful, but it is judgement that matters.”
General Colin Powell, Chairman Joint Chiefs 1989–1993, Secretary of State 2001–2005; b. 1937
“I’m very big on having clarified principles. I don’t believe in being reactive. You can’t do that in the markets effectively. I can’t. I need perspective. I need a game plan.”
Ray Dalio, money manager, founder Bridgewater Associates; b. 1949
According to an UBS survey, 3,400 high net worth investors with at least $1 million in investable assets and representing 55% of the respondents are expecting a significant drop in the markets at some point in 2020. As a result, the super-rich have increased their cash holdings by 25% of their average assets. Ray Dalio, the billionaire hedge fund founder, co-chair and co-chief of Bridgewater Associates, has seen his firm make a $1.5 billion bet that stock markets around the world will fall by March 2020. The bet is mostly made up of put options. Then again, Mr. Dalio, who seems to be obtaining a reputation as a perma-bear, was warning about a coming great depression back in 2016.
Of course, we have the perma-bulls as well. Larry Fink, CEO of Blackrock Inc. one of the world’s largest investment management companies with an estimated $6.8 trillion assets under management, has said most investors are under-invested, there remains a lot of cash on the sidelines, and the real risk is for a melt-up, not a melt-down. We have seen many bullish headlines and have listened to numerous pundits telling everyone to buy like it is 2009. FOMO — “fear of missing out”— is alive and well.
So, which is it? A collapse into the next great depression? Or a huge melt-up à la the late 1920s and the late 1990s? They both could be right. We have acknowledged that we are in a secular bull market, even as there are many who say that we are in a bear market that is just fooling everyone as it goes higher. After all, to get a real bear market you have to get everyone in the market so the maximum number can lose a lot of money when it turns down. What better way to accomplish that then with a melt-up.
There is a lot of noise in the background. The impeachment proceedings provide a daily dose of drama. Protests are ringing around the world daily, led by Hong Kong. But the protests keep coming—Bolivia, Chile, Lebanon, France, Iran, Iraq, and more. And they are not just garden party type protests. People are being killed. They are the biggest protests since the Arab Spring of 2010 and 2011, along with the Occupy Wall Street movement and Black Lives Matter. Paramilitary evictions ended Occupy’s movement, autocracy deepened in the Arab world, and the war continues on in Syria. More recently, there have been mass protests related to the environment and climate change, some under the banner of Extinction Rebellion. A president was overthrown in Bolivia in what many believe was a coup d’etat. Hong Kong recorded a recession in Q3 with a 3.2% contraction following a 0.5% contraction in Q2. Mass protests do take an economic toll.
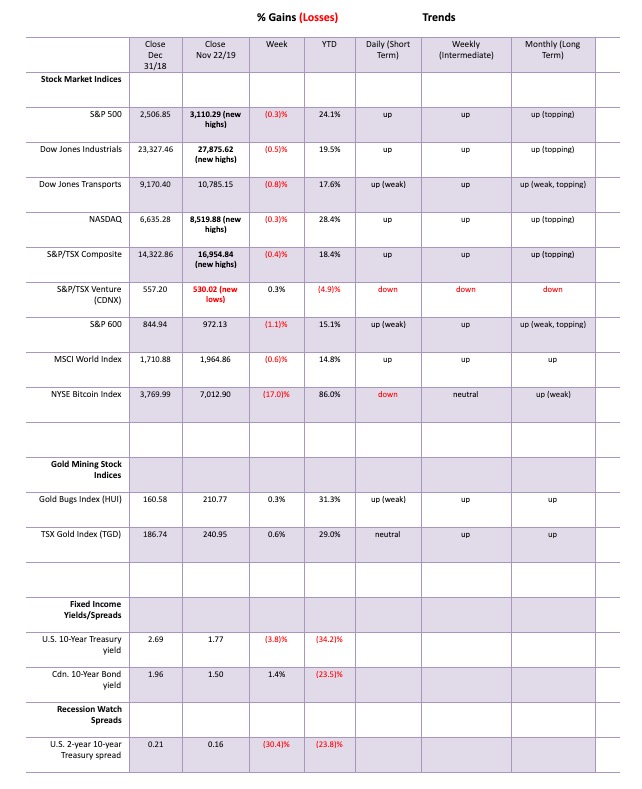
Globally, the world is slowing although there are numerous indicators that could be bottoming. Global growth is forecast at 3.2% in 2019 and the IMF is looking at 3.5% growth in 2020. Stock markets are at all-time highs, at least some of them. This past week the S&P 500, the Dow Jones Industrials (DJI), and the NASDAQ all made new all-time highs. So did the Dow Jones World Index (DJW), EuroNext 100, and France’s CAC 40. There were others as well. But, significantly, some didn’t. The Dow Jones Transportations (DJT), the S&P 600 (small cap), and S&P 400 (mid cap) continue to diverge from the DJI and the S&P 500. The indices are supposed to confirm each other. What it is possibly suggesting is the concentration is in the large cap stocks that make up the DJI and the S&P 500. That reminds us of the famous “nifty fifty” rally of late 1972. That market topped in January 1973. What followed was a 45% collapse into December 1974 as Watergate gripped the U.S. and the Arab oil embargo hit.
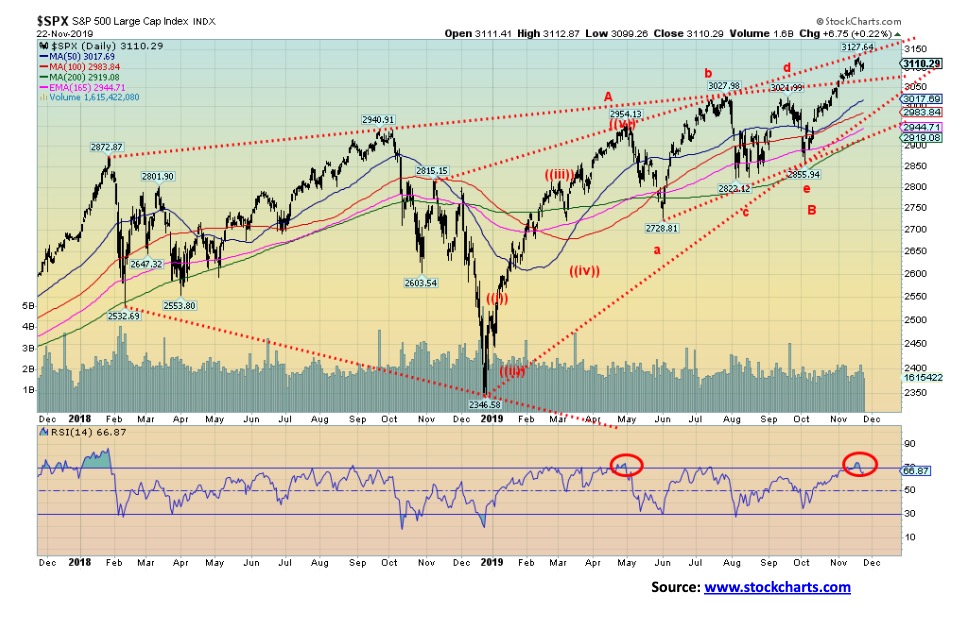
Our 2-year chart of the S&P 500 shows that the index has taken out what appears to be the top of a broadening channel. So, does that end thoughts of a broadening top? Or is it merely an overthrow of a channel line? The S&P 500 hit the top of another channel line of a possible ascending wedge pattern. The market made its new all-time high, then reversed and closed lower on the week. The RSI had become overbought over 70. Technical analysts call that a reversal week. To confirm the reversal week, the market does need to follow through to the downside. As long as the S&P 500 holds above 2,975 on any pullback and does not break down under 2,900, stocks could regroup and roar to another all-time high. While stocks appear to have broken out, we would not call what we have seen so far a clear breakout. We’d have preferred to see a firm close above 3,200.
A comparable spot for the DJI is a breakdown under 26,600. There is support for the DJI down to between 27,250 to 27,500. The DJI did hit a psychological high at 28,000 this past week.
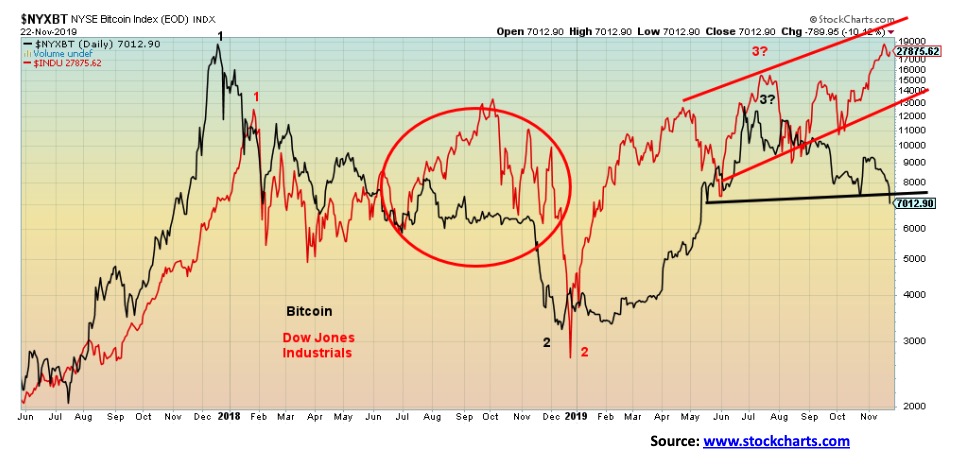
Our chart of the DJI and Bitcoin shows that the DJI has diverged with Bitcoin. As the chart shows, the two tend to follow each other, dating back to when Bitcoin got underway. The two diverged in 2018 with the DJI continuing higher while Bitcoin stumbled and had started to fall. By November/December 2018 the divergence resolved itself with the DJI joining Bitcoin in a sharp fall. Once again, the two have diverged with Bitcoin starting to fall even as the DJI continues higher. Bitcoin even broke this week under what might be a head and shoulders top pattern. Targets for the pattern are down to $2,000 with minimum objectives down to $5,650.
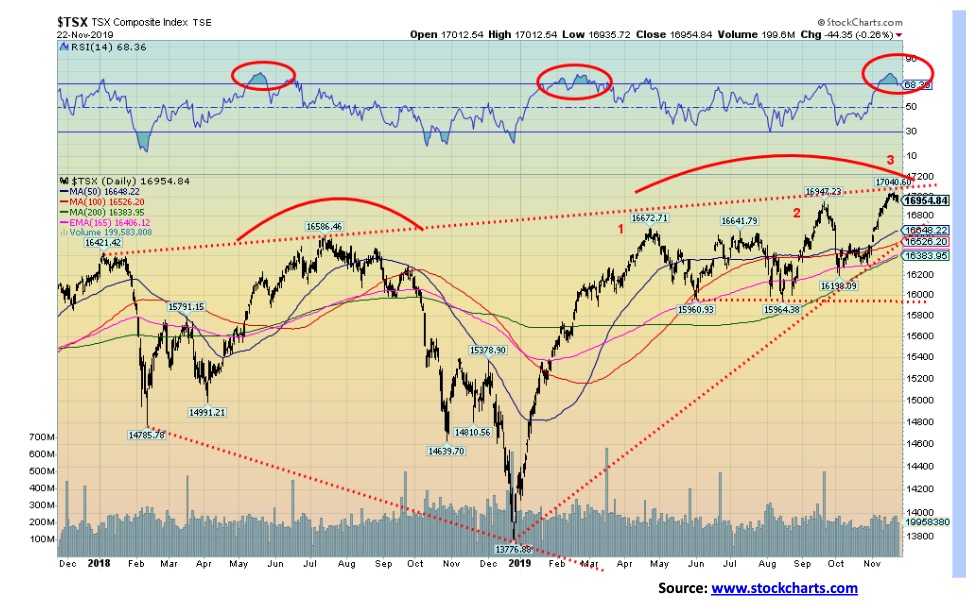
The TSX Composite is getting in on the act as well, by soaring to new all-time highs this past week. The TSX also reached a psychological high at 17,000. However, that high was barely above the high seen back September2019 (roughly 90 points higher). And that September high was only 300 points higher than the one seen in April 2019. Three consecutive highs, each slightly higher than the previous one. We call it three thrusts to a high (labeled 1, 2, 3). The TSX also hit the top of what still might be a broadening channel. Like the U.S. indices, the TSX turned down and closed lower on the week after making the new all-time high. The TSX starts to break down under 16,500 and the breakdown is confirmed under 16,400. The TSX also has what appears to be an ascending wedge pattern. And, like the other indices, the TSX is coming off overbought levels that saw the RSI rise above 70.
All signs are pointing to a possible temporary top. But will it be the killer top? The top that ends the bull market of 2009–2019? Probably not. There are just too many puts out there in the market. We have noted the Trump put; Trump does not want the stock market to go down under his watch. Then there’s the Fed put—three consecutive rate cuts and the ramp of a repo program that some are calling QE4 or Modern Monetary Theory (MMT). Ostensibly, the Fed’s repo program was to help keep interest rates down and also step in when it appeared there was reluctance on the part of the banks to lend to each other. Banks, it seems, no longer trust banks according to economist Martin Armstrong of Armstrong Economics.
The Fed has been doing roughly $60 billion every day and has stated their intentions to continue this into the New Year. The Fed balance sheet has ballooned $271 billion since the end of August when the Fed started the latest repo program. Recall the Fed did this in 2007 before the market topped in October 2007 and before the financial collapse of 2008.
So, is this QE4? Well, the stock market has gone up almost 9% since an October low or about 8% from the August low that was seen right around the time the Fed started its repo program. The proceeds of the repo program could be finding their way into the stock market. But one distinction between this repo program and earlier QE was that the Fed was buying longer dated bonds and even mortgage backed securities (MBS). Repos are a largely an overnight market. However, given that the add is ongoing then the funds do find their way into the banking system. Not all would be going into reserves. If any. Total reserve balances maintained with the Fed have been falling steadily since July 2014. Those funds ultimately find their way either into loans or into the stock market or other asset purchases.
If the funds are finding their way into the stock market, they are buying largely the large cap stocks of the DJI and the S&P 500. Many believe the Fed repo program is to stem a potential crisis in the European banking system. There are major problems in the European banking system, led by Deutsche Bank. But there are also major problems in the Chinese banking system, where the vast majority of loans over the past number of years were transacted in U.S. dollars even as the earnings are in yuan. The same phenomenon of U.S. dollar loans is being seen in emerging economies and others.
Given the U.S. dollar remains the world’s reserve currency, it falls on the Fed to try and smooth things out. One definitely would not want U.S. interest rates to rise as that could negatively impact all the U.S. dollar denominated debt out there. That includes both domestic and international debt. The high U.S. dollar also hurts international denominated U.S. dollar debt. As the U.S. dollar rises against other currencies the borrowers have to pay back their loans in U.S. dollars but their earnings are in the local currency that is devaluing.
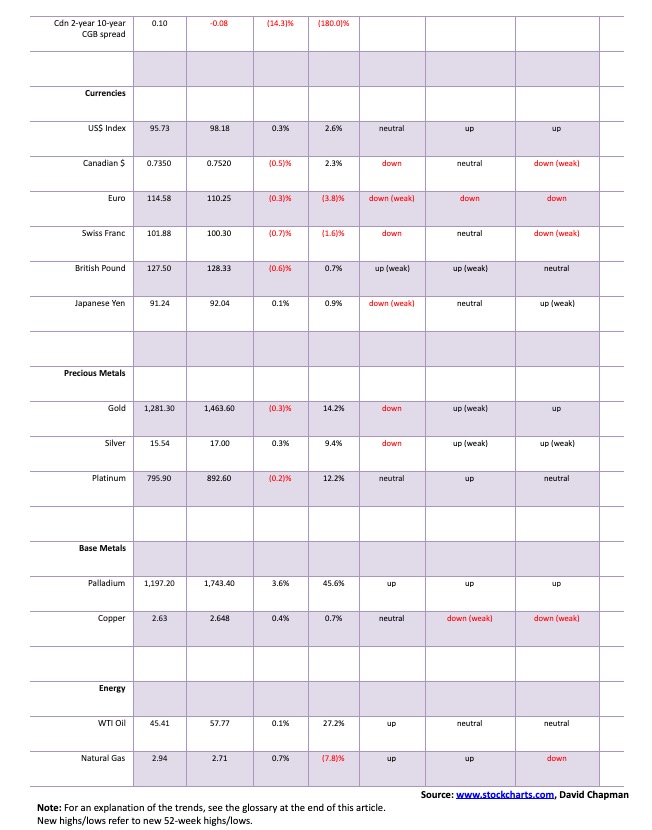
The Fed isn’t talking, and most people, including heads of state, aren’t aware of what’s going on with the repo program, so this leaves it up to the pundits to conjecture. If there is a crisis, it is being kept hush, hush. And the gold people are screaming that gold should be rising because the Fed is conducting QE4. Except that gold continues to waffle, actually falling 0.3% this past week. But silver rose 0.3% and the gold stocks, as represented by the Gold Bugs Index (HUI) and the TSX Gold Index (TGD), rose 0.3% and 0.6% respectively this past week. Are they leading?
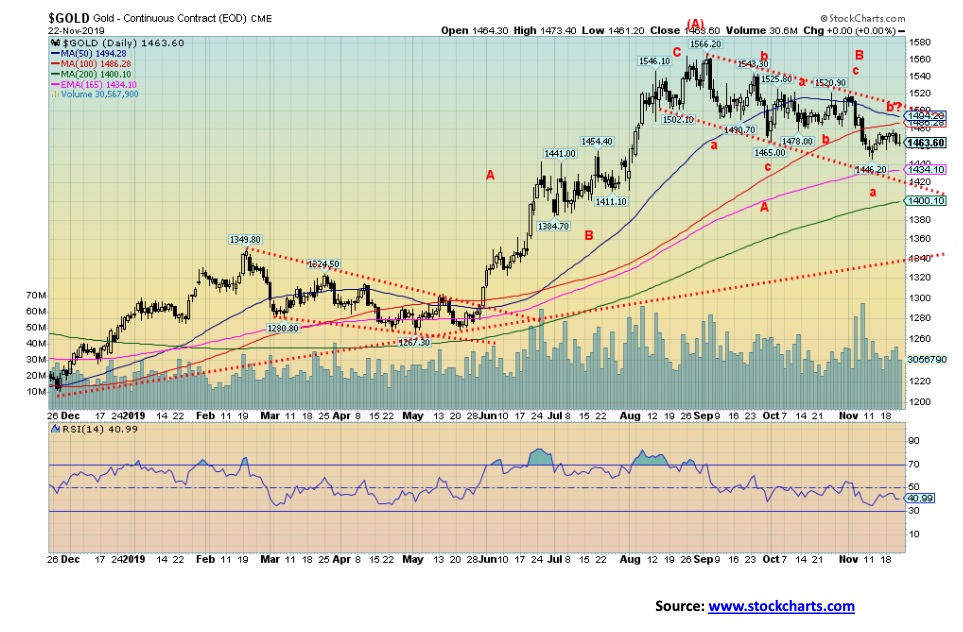
Gold has been in a steady downtrend since topping in early September. We believe that was only the first wave out of what should be at least three waves to the upside. We appear to working on the second wave. But it may not be complete. After breaking out of the barrier at $1,350 to $1,370, gold appears to be embarking on a major up move that could last some time. The breakout we have noted could have minimum targets of $1,725. The first wave up rose to $1,566.
It was inevitable that gold would test the breakout zone of $1,350/$1,370. Since gold does have a somewhat steady cycle of 11–13 months, a low was expected towards year-end (some have documented lows every 6 months). Over the past few years alone we saw important lows in December 2015, December 2016, and December 2017. The low in 2018 came in August with a higher low seen in November. Nonetheless, lows have been consistently higher since the December 2015 low, the definition of an uptrend.
Gold waffled this past week and the U.S. dollar has once again been rising as the US$ Index closed over 98 again this past week. Gold could be facing another decline that takes us below $1,446 the November low thus far. We note that the commercial COT slipped to 28% from 29% this past week as short open interest rose roughly 14,000 contracts and long open interest fell about 3,500 contracts. The silver commercial COT also slipped to 35% from 36% as long open interest slipped 3,000 contracts and short open interest rose about 2,000 contracts. The COTs aren’t too bearish but they are not bullish either so we wouldn’t be surprised at another thrust to the downside to complete this cycle. The low could be expected in December if it hasn’t happened here in November.
Gold has resistance up to $1,500 and then up to $1,520. Over $1,530, gold looks better and new highs could be seen once over $1,550. There is considerable support down to around $1,420 and below that $1,400. If gold is to remain in the down channel, then $1,420 is more likely than $1,400. But, as we note, this is a test of the breakout zone and that could, in theory, take us down to $1,370, although we would be surprised if it did. Any decline to $1,400 or lower could see the sentiment indicators plunge to under 10%. That would be a bullish sign.
Throughout 2012, gold found considerable support in the $1,525 to $1,550 zone. When it cracked that zone in 2013, the decline was swift and vicious. Gold fell $350 into June 2013 and by the time it bottomed in December 2015, gold was down roughly $875 from its all-time high seen in September 2011. Gold people have nightmares over that collapse. The junior mining market has never recovered as the TSX Venture Exchange (CDNX), dominated by junior mining exploration stocks, remains down 80% from its 2011 high. The TGD is still down 47% from its 2011 high and the HUI is still down 67% from its 2011 high. The sector remains unloved and under-owned. A breakout into 2020 could catch a lot of people by surprise and spark a sharper rally. It is a very small market so it doesn’t take much to push it higher quickly. The charts remain bullish but another low into December would not surprise us to wash out the weak longs.
The markets are sitting at important junctures. A pullback appears to be in the works. But is it the final top that the bears have been looking for? Or is it merely time for another pause before yet another run-up gets underway? We suspect the latter. There are too many who have a stake in seeing this market continue to do well or at least not fall into a collapse. We noted the Trump put and the Fed put. There is also the trade war put as the suspicion is some deal will be cobbled together that allows everyone to save face.
The election is still a year away and keeping interest rates low, resolving the U.S./China trade dispute, keeping the economy from falling into a recession and the stock market at least elevated is all in Trump’s interest to help him get re-elected, impeachment or no impeachment. The global economy is slowing but it is not falling out of bed. While the world is laden with debt and the risk of a debt implosion is real, we understand that is one reason the Fed wants to keep a lid on interest rates which they are doing, we suspect, through the repo program.
We will soon be moving into December and year-end. It has been a good year with the S&P 500 up 24% thus far, the TSX Composite up 18%, and the TSX Gold Index (TGD) up 29%. Gold is up 14% and silver up 9%. The TSX Venture Exchange (CDNX) has been the dog, down 4.9% on the year with a month to go. It is also U.S. Thanksgiving next Thursday Nov 28 and the markets will be closed. There won’t be much activity on the Friday either as that is what is known as Black Friday, launching the Christmas season. Cyber Monday follows.
Markets tend to hold up into Thanksgiving and then tumble after Black Friday. But, overall, with 2019 being a good year, money managers are going to want to protect their profits. For that reason alone, we wouldn’t expect a big sell-off into December, but we might instead experience some choppiness as some protect profits and others position for 2020.
In the interim, we’ll be curious as to how Ray Dalio makes out with his $1.5 billion bet. That’s serious dough.
—
(Featured image by Rick Tap on Unsplash)
DISCLAIMER: This article was written by a third party contributor and does not reflect the opinion of Born2Invest, its management, staff or its associates. Please review our disclaimer for more information.
This article may include forward-looking statements. These forward-looking statements generally are identified by the words “believe,” “project,” “estimate,” “become,” “plan,” “will,” and similar expressions. These forward-looking statements involve known and unknown risks as well as uncertainties, including those discussed in the following cautionary statements and elsewhere in this article and on this site. Although the Company may believe that its expectations are based on reasonable assumptions, the actual results that the Company may achieve may differ materially from any forward-looking statements, which reflect the opinions of the management of the Company only as of the date hereof. Additionally, please make sure to read these important disclosures.


Youth Cannabis Use in Colorado Is Falling — But the Full Story Is More Complex
The 2026 Colorado survey shows teen cannabis use fell to 10 percent in 2025, down from 21 percent in 2015....


Morocco’s Growth Holds at 4.6% as Agriculture Offsets Economic Pressures
Morocco’s economy grew 4.6% in Q1 2026, driven by a strong agricultural rebound offsetting declines in industry. Services expanded moderately...


Abivax Shares Surge as New Trial Data Eases Safety Concerns Over Ulcerative Colitis Drug
Abivax shares surged nearly 36% after positive updated trial results for its ulcerative colitis drug obefazimod reassured investors following earlier...


El Dorado Raises $9M to Expand Cross-Border Fintech Platform
El Dorado, a Latin American fintech improving cross-border financial services, raised a $9 million Series A led by Paradigm with...


Bitcoin Stalls Near $60K as Strategy Moves, ETFs Outflow, and EU MiCA Rules Take Effect
Bitcoin hovers near $60,000 with ETF outflows, while Strategy boosts reserves, sells BTC, and raises dividends to reassure investors. Ethereum...
 |
|
 |  |
 |
|
-

 Biotech1 week ago
Galicia Launches €805M Biotechnology Strategy to Drive Innovation and Competitiveness (2026–2030)
-

 Crypto2 weeks ago
Bitcoin and Ethereum Markets Steady as Strategy and Bitmine Expand Holdings Amid World Cup Crypto Activity
-

 Impact Investing5 days ago
ESG Gap Persists as Firms Struggle to Link Sustainability to Financial Value
-

 Crowdfunding2 weeks ago
Temotiva Launches Crowdfunding Campaign to Advance Preventive Mental Health