Featured
How will stock markets react in the face of a possible recession?
The suspense continues. US stock markets continue their record run but many market watchers fear we may be entering a bubble that’s about to burst. In reality the situation will likely be more nuanced. The data shows that we are most likely to enter a brief correction period before the market regroups and reaches new heights with yet more broken records.

Bull and bear. Yin and yang. Bull and bear markets are the yin and the yang of an investment cycle. They are complementary and necessary halves of the whole. Bear means down (yin) and bull means up (yang).
As night follows day, bear markets follow bull markets. Bear markets are usually defined as the S&P 500 and the Dow Jones Industrials (DJI) falling 20% or more from a high and remaining that way for at least two months. They usually define a bull market as the opposite; i.e., when the major indices rise more than 20% from a low and stay that way without falling more than 20% from a high. The last bear market was the October 2007 to March 2009 bear that saw the S&P 500 fall about 54%. By May 2009 the S&P 500 was up some 20% from the March low and the new bull market was on its way. There hasn’t been a bear market since, despite three corrections in 2011, 2015–2016, and 2018. The S&P 500 did fall 20% into the December 2018 low, but it was all over so quickly it was never termed an official bear market. By March 2019, the market was up more than 20% from the low and the bull resumed.
Another differentiation for bull and bear markets is the term secular bull and secular bear. A secular market is one that lasts generally 5 to 25 years and consists of a series of primary trends both bull and bear. A secular bear consists of smaller bull markets and larger bear markets. A secular bull is the opposite with smaller bear markets and larger bull markets. Since 2009, we have been in a secular bull market. As noted, the period was punctuated so far with three mini-bear markets of generally short duration. The period 2000–2009 was the most recent secular bear market. That secular bear consisted of two deep lengthy bear markets 2000-2002 and 2007-2009 and on bull market 2002-2007.
We may be in a secular bull market, but it is not been a particularly strong bull. Given that we are now 10 years into this bull market, it is not surprising to find numerous bear articles signaling that either a recession is just around the corner or, even worse, that another great depression will soon be upon us. It is also not surprising to find pundits predicting that the bull market will continue and the best is yet to come. They both may be right. Secular bears follow secular bulls. It becomes a question of timing.
By many measurements this has been a weak bull market. GDP growth has been falling steadily on average since the 1960s, even when taking into consideration the high growth areas of Asia. This is despite real improvement in GDP growth per capita on both a nominal and purchasing power parity basis (PPP).
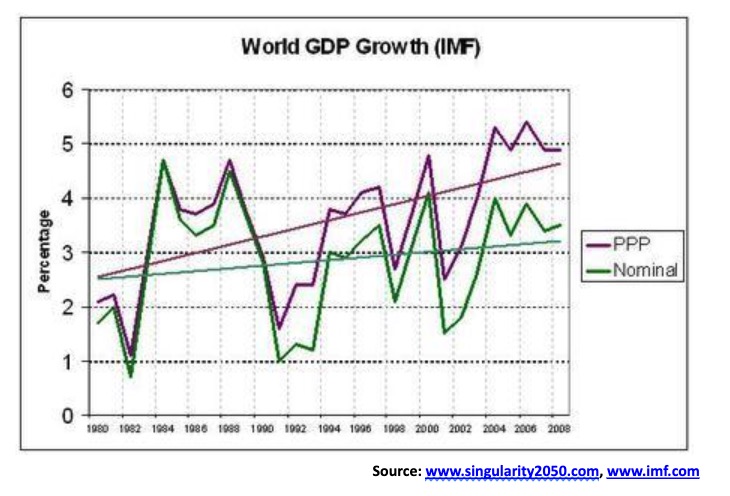
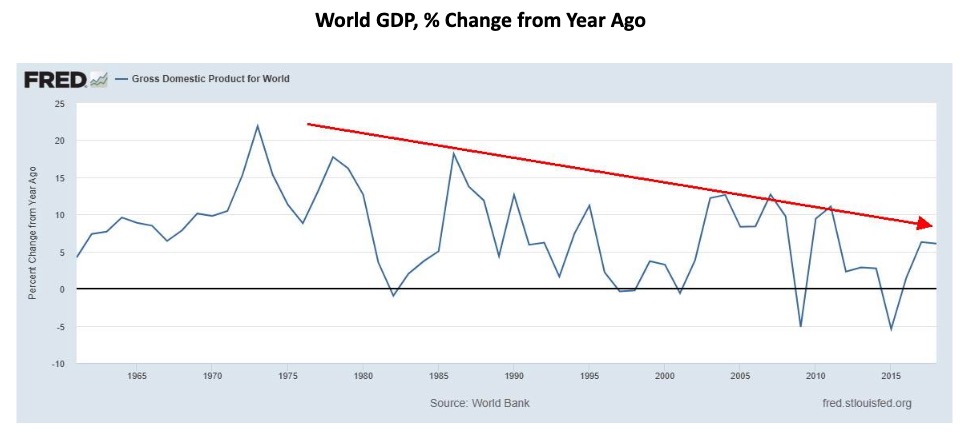
Since 1900, GDP growth has been exponential and accelerating. Even events such as the Great Depression have proven to be only temporary. GDP growth per capita has been doubling roughly every 30 years since 1900. The reality is that periods of high growth are usually followed by periods of low to negative growth as everything, as they say, reverts to the mean. The current period of growth has not been what one can say is high (China and other Asian countries excepted), so unless something hits us so hard that it causes a major economic crash and depression, any period of slowdowns is likely to be shallow. Globally world GDP has actually been slowing as the chart of world GDP as measured by the percentage change from a year ago shows.
What one has to keep in perspective is that the current secular bull market has been driven by record ultra-low interest rates, huge monetary stimulus (QE), and record amounts of debt. The Fed cut the prime rate to zero after the 2008 financial crisis and left it unchanged until December 2015. The Fed increased interest rates nine times between December 2015 and September 2018. Since then they have cut rates three times.
Cutting rates during a period of growth is not unprecedented. Former Fed Chair Alan Greenspan cut the Fed rate six times between 1995 to 1998 because of the fear of a slowdown. That period featured the Mexican financial crisis in 1994, the Asian financial crisis and contagion in 1997, and the Russian/Long Term Capital Management (LTCM) financial crisis in 1998. None of them resulted in a recession, or at least not a recession in the North American economies.
Given the recent Fed interest rate cuts it is probably not surprising to hear the Fed say that the economy is “in a good place.” The sentiment was echoed by Fed Chair Jerome Powell, NY Fed Chair John Williams, and Fed Vice Chair Richard Clarida. Naturally, when we hear that, all we can think of is “well, what did you expect them say? That the economy reeks?”
Well, no, it doesn’t reek, but it is not exactly gangbusters either. Take the Conference Board’s most recent release of the leading economic index (LEI). The Conference Board said that the LEI declined in September because of weakness in manufacturing and interest rate spreads, but that it was offset by rising stock prices and a positive contribution from the leading credit index. The economy is still growing, but more slowly through year-end and into 2020. Well, the LEI has been essentially flat now for 12 months. No, that is not the end of the world, but in previous peaks for the LEI it was on average eleven months before a recession hit. It is also noteworthy that the Fed started cutting rates in 1989, 2001, and 2007 before recessions hit in 1990, 2001–2002, and 2008. As economist David Rosenberg of Gluskin Sheff Associates points out, the Fed’s cutting rates then didn’t stop a recession and it probably won’t work this time, either.
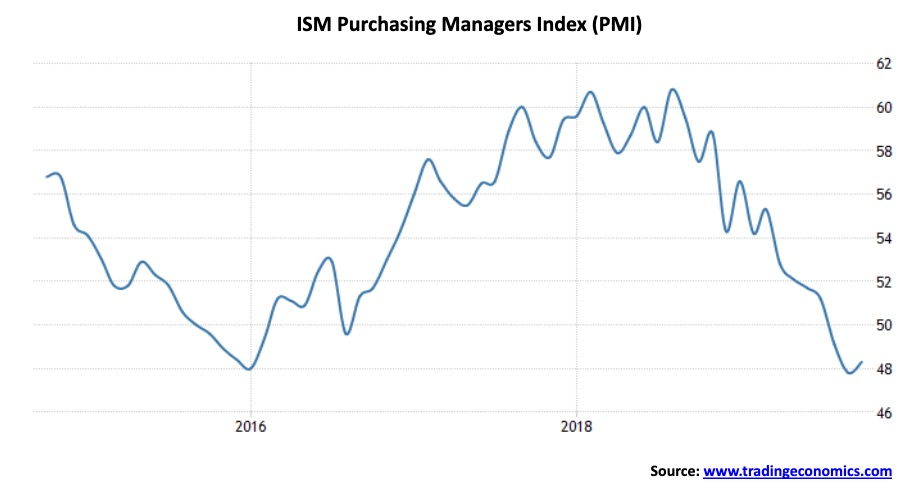
The consumer may be 70% of the economy, but it is also noteworthy that the other 30% of the economy has been sliding and is already technically in a recession. The ISM Purchasing Managers Index (PMI) peaked way back in July 2018 at 60.85. Today it sits at 48.30 and has been under the recession level limit of 50 now for three months. Consumer credit growth is beginning to slow and if the consumer decides or needs to “pull in the horns,” the economy could turn down. John Williams of Shadow Stats (www.shadowstats.com) figures it is all moot anyway as the U.S. economy has been in a rolling recession since 2000, except for a brief period in 2003–2004. Williams’ methodology reflects the inflation-adjusted or real, year-to-year GDP change, adjusted for distortions in government inflation usage and methodological changes that have resulted in a built-in upside bias to official reporting.
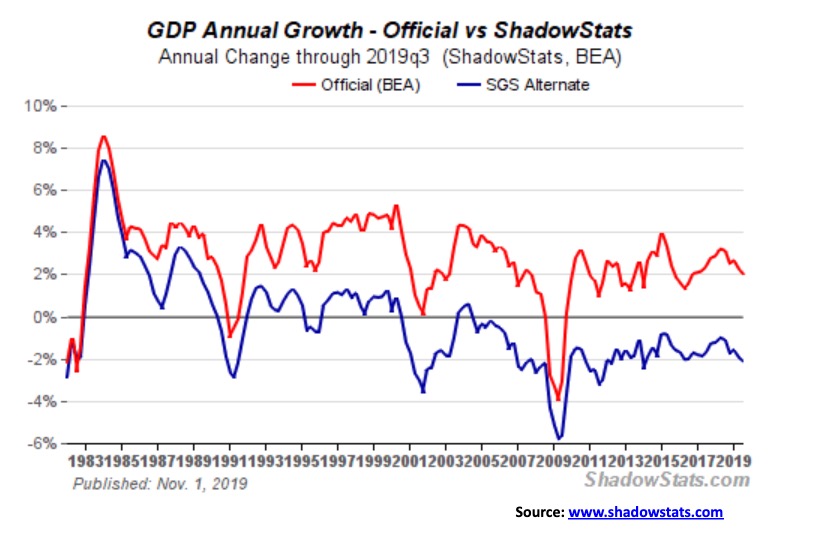
Williams doesn’t just report on GDP as Shadow Stats provides alternative data for inflation and unemployment as well. Both inflation and unemployment are underreported, according to Williams. The stock market now appears to be potentially launching another run to the upside. We await confirmation of a breakout. We don’t doubt that it can happen. But one has to consider that it is being encouraged by a president who is fighting impeachment and wants to be re-elected in 2020. His ace is the potential for a trade deal between the U.S. and China. China wants one as well so we have two motivated adversaries whose economies are dependent on them to reach a trade deal.
Then add in Trump’s constant harping against Fed Chair Jerome Powell for lower interest rates, even negative interest rates. Is it working? Well, the Fed did cut interest rates three times so far in 2019. Was it pushed by Trump? One can hope that the Fed was responding to slowdowns, particularly in the manufacturing sector, and not to Trump’s harping.
Consider, however, that the stock market could be taking off on another run against the backdrop of near record low unemployment, at least of the official kind U3, and stock valuations as measured by the Case Shiller P/E ratio at levels seen only three times in the past century—the late 1920s, the late 1990s, and now. Our chart is shown below.
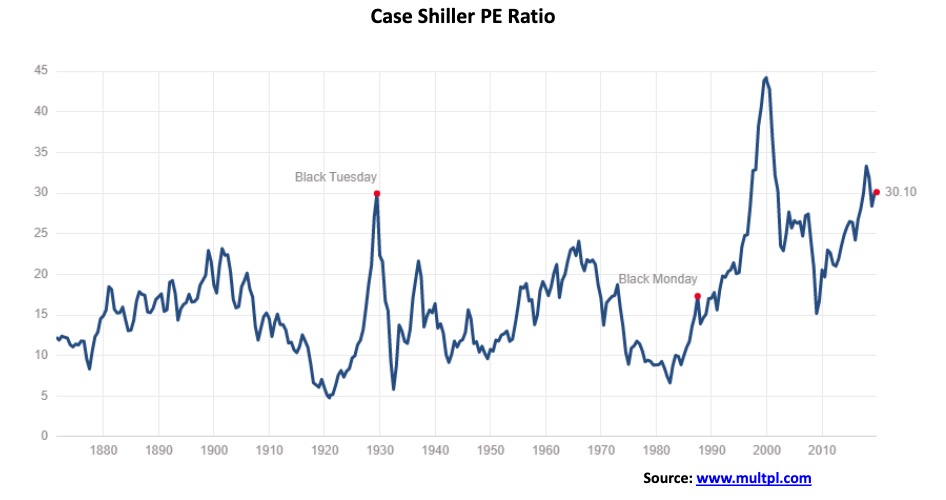
The Case Shiller P/E ratio is based on average inflation-adjusted earnings from the previous 10 years, known as the Cyclically Adjusted PE Ratio (CAPE Ratio), Shiller PE Ratio, or PE 10. The regular S&P 500 P/E ratio is calculated based on trailing 12 months of “as reported” earnings. It currently sits at 23.02, well above its historical mean of 15.77 and higher than at any time, except for the late 1990s and the aftermath of the 2008 financial crisis. No, none of this means that the stock market is about to fall. but it is a warning that valuations are lofty even if many will claim “this time is different.”
So, what we have are “puts” protecting the stock market and the economy. Eric Conley wrote on the subject in an article titled The Friction Between the Bulls and Bears.
We have the Trump put, in that Trump will not allow the stock market to crash or the economy to tip over until he gets re-elected in 2020 (assuming he survives the impeachment crisis). We have the Fed put, in that the belief is the Fed won’t allow a recession either, at least not while Trump appointee Jerome Powell is in charge. The Fed is effectively printing money through the repo market and what we and others have called QE4. We have asked the question—is there a problem somewhere? Except there is no answer.
We also have the trade war put with both the U.S. and China wanting a deal. To a lesser extent is the consumer put as long as the consumer keeps on spending and the consumer spending in turn helps the corporations. Finally, there is the question—is there an alternative to stocks? The answer is, probably not, what with inflation and interest rates being so low. The final push will take place if the market fears that it is about to miss a big run-up in stock markets. They call that “fear of missing out (FOMA).” We note that FOMA sounds like “foam,” as in the stock market becomes foamy.
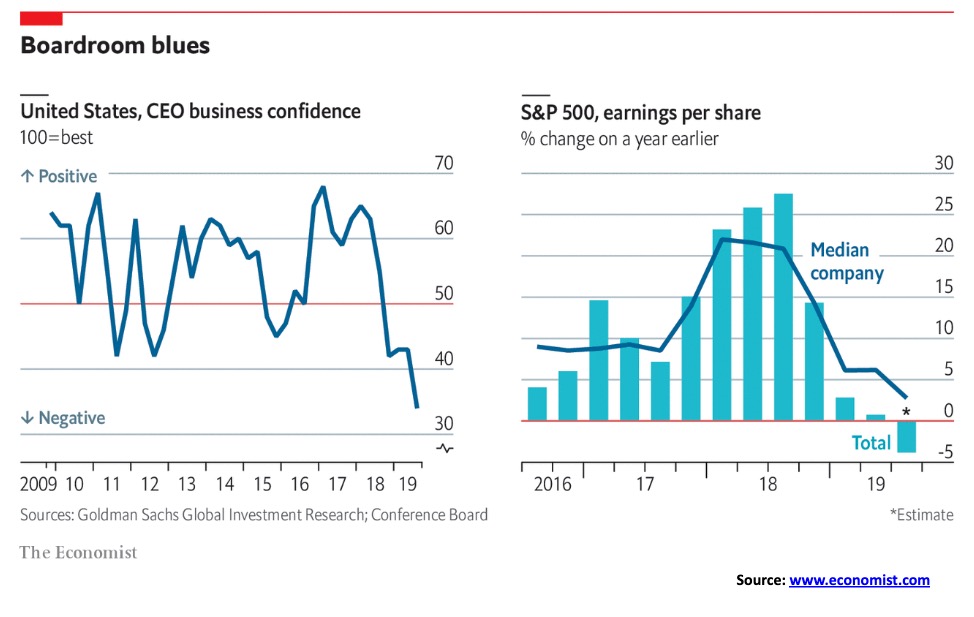
All this is coming against the backdrop of sliding business confidence and sliding earnings, as the above charts from The Economist show. It is also against the backdrop of the global debt bubble ($250 trillion and counting, but what happens if interest rates start rising?), uncertainty over Brexit, the continuing strife in Hong Kong where its economy has officially fallen into a recession, and rising interest rates against the backdrop of massive outstanding negative-yielding debt. That debt was last estimated at $17 trillion (but with rising interest rates is probably less now) and is heightened by shaky corporate debt in the U.S. and China and the very shaky European banking system. As well, down the road, what are the potential negative impacts of global warming? Australia’s fires and Venice’s sinking are the two most visible disasters today. There is also geopolitical uncertainty, given the tensions between the U.S. and China and Russia.
But stock markets climb a “wall of worry.” With the Fed and Trump behind it, the stock market may be poised to go on a record climb. Just don’t forget to get off the “elevator” before the crash that inevitably follows.
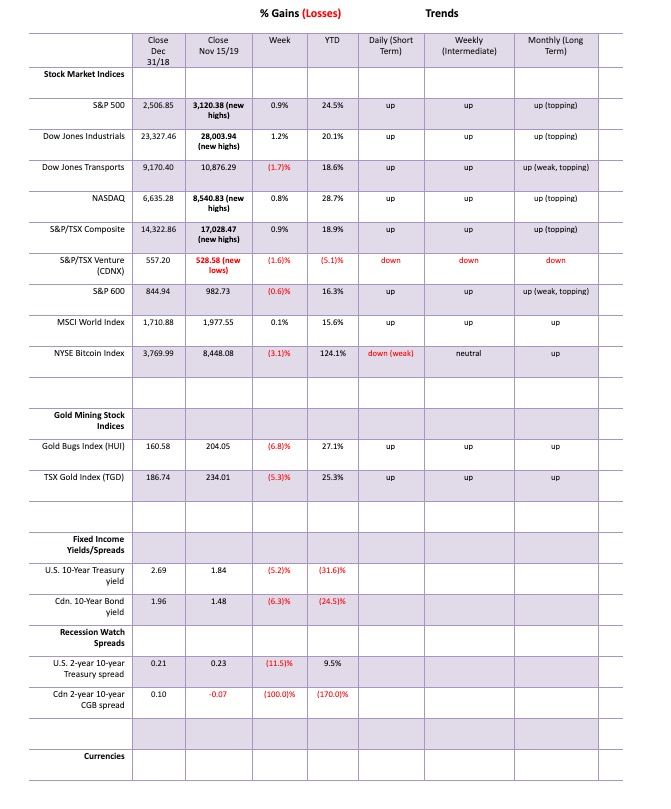
Another week, another record. It seems to have become an almost daily affair. The S&P 500 hit another all-time record this past week, gaining 0.9%. Joining the S&P 500 on its record run were the Dow Jones Industrials (DJI), up 1.2% and the NASDAQ, up 0.8%. Others making new all-time highs included the NYSE, the NASDAQ 100, the S&P 100 (OEX), the Dow Jones Composite (DJC), and the Wilshire 5000. Not making new all-time highs were the Dow Jones Transportations, down 1.7% on the week, and, the S&P 600 (small cap), down 0.6%. Others not making new all-time highs included the Dow Jones Utilities (DJU), the Value Line, the AMEX, and the S&P 400 (mid-cap). Of the FAANGs, Apple and Google both made new all-time highs this past week.
Elsewhere, the TSX Composite pushed to new all-time highs, up 0.9% on the week. Meanwhile, the small cap TSX Venture Exchange (CDNX) fell 1.6% making new 52-week lows in the process. Internationally, the MSCI World Index was up about 0.1%, the FTSE 100 fell about 1.0%, the Paris CAC 40 gained 0.8% and made new all-time highs while the German DAX also made new all-time highs, gaining 0.1%. In Asia, China’s Shanghai Index (SSEC) fell 2.5% (trade optimism?) while the Tokyo Nikkei Dow (TKN) was down 1.1%. Hong Kong’s beleaguered Hang Seng Index fell 4.8% as things deteriorated on the streets.
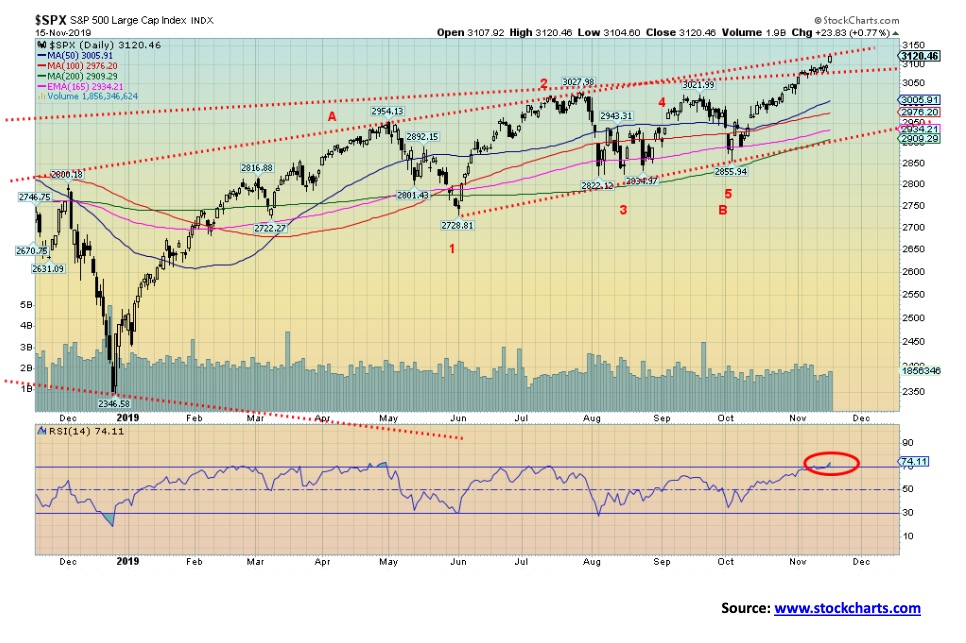
The question now is, “what next”? The S&P 500 has hit the top of the channels. Optimism is quite high (too high?). The RSI is over 70 and other indicators are stretched and overbought as well. The index could pause and pull back keeping us in suspense as to whether it will break out to the upside. Or it could burst right through. We’d prefer the former. That doesn’t mean the bull is finished as we could regroup and make another push to break through the top of the channel. We’d need consecutive closes over 3,125 and preferably over 3,150 to suggest that we will push higher to potential targets up near 3,300. We wouldn’t consider that a top is in until we break back under 3,000. There remains considerable support down to 2,900. Below 2,900, a bear correction could get under way. A major bear market is confirmed when the S&P 500 breaks its 2018 low of 2,346.
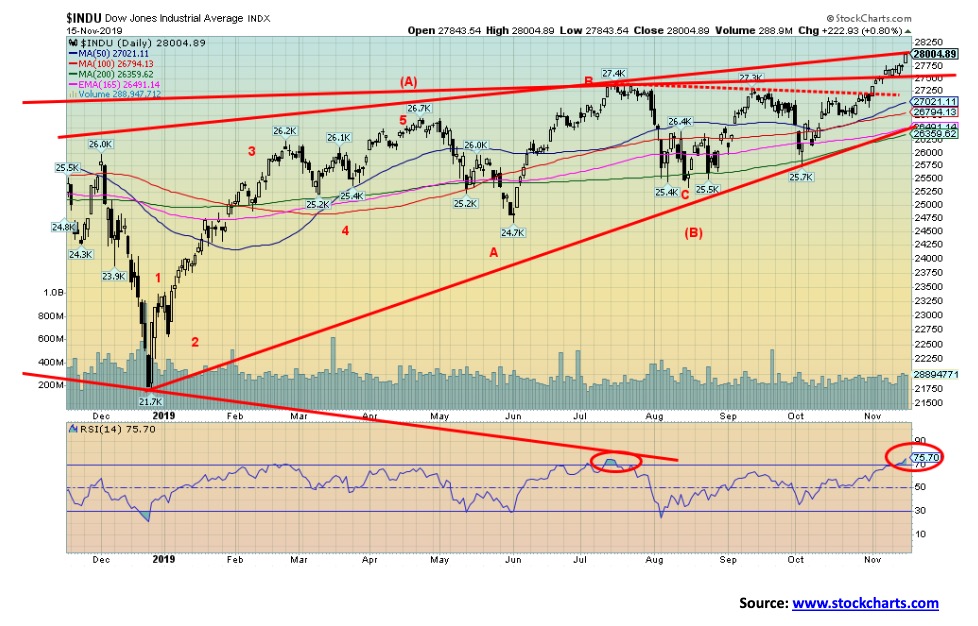
Like the S&P 500, the DJI hit new all-time highs this past week. And like the S&P 500 the DJI has an RSI over 70 (currently 75) and is hitting the top of the broadening channel. So, like the S&P 500, this could prove to be an important week. Granted, as we noted, we could pull back, ease some of the overbought conditions, and then push through to a major breakout and a bull run that could result in a blow-off. During the run to all-time highs from the lows of October 1998 to the final high in January 2000, the DJI had a few periods where the RSI rose over 70 and complacency was high. Each time, the market pulled back and regrouped before pushing to fresh highs. There was even a significant pullback from August 1999 to October 1999 that briefly broke under the 200-day MA, suggesting a top was in. During the final push to the highs there were numerous negative divergences across a number of time frames that were signaling a possible important top. Here we also had a low in October 2019 and since then we have pushed to new highs. So there still could be pullbacks before pushing once again to new highs. But keep in mind important breakdown points. For the DJI a break under 25,700 would be negative and could suggest a top is in.
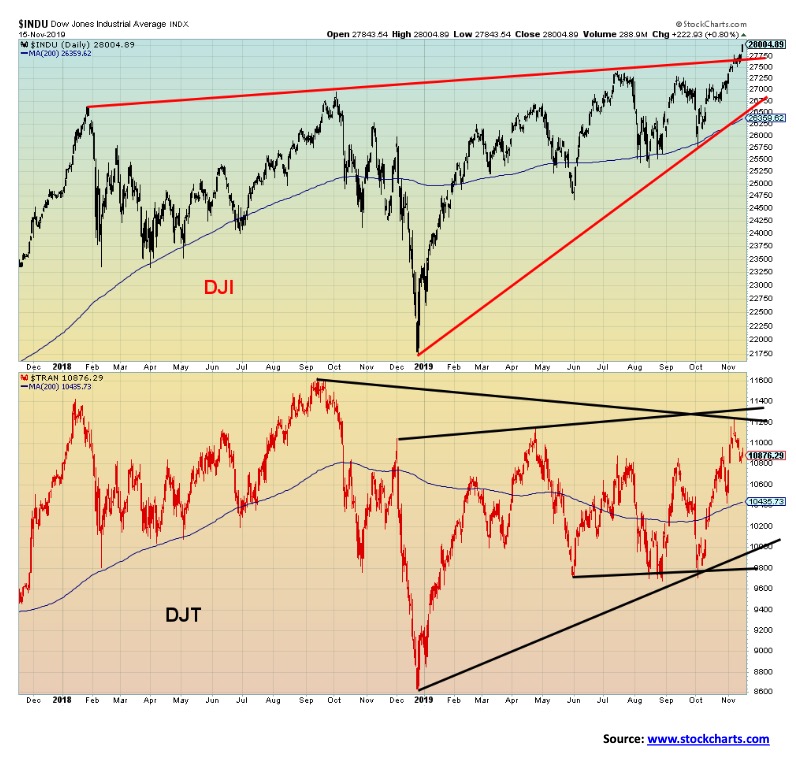
If the U.S. and China are kissing and making up in trying to come to a trade deal, then why is the DJT falling instead of rising like the DJI? And why is the DJT so far away from its all-time high while the DJI is making new all-time highs? The DJT fell 1.7% this past week while the DJI rose 1.2%. The DJT is down 6.4% from its all-time high seen in September 2018. The DJI is up almost 3% in the same period. Dow theory says that the indices must confirm each other. It is one of the basic tenets of Dow Theory. That the DJI and the DJT are diverging suggests to us that one of them is wrong and, in this case, it suggests it is the DJI that is out of line and should eventually join the DJT to the downside.
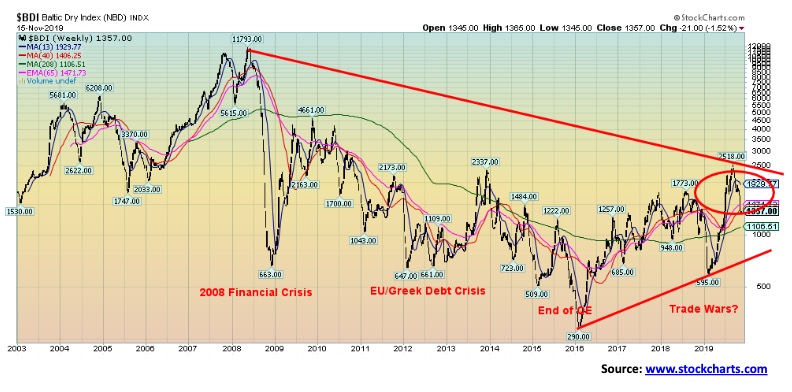
In keeping with the theme that if things are so good, why is global trade declining? If the U.S. and China are supposed to be kissing and making up, we would expect to see signs that global trade is improving. Instead, trade here, as measured by the Baltic Dry Index (BDI), has been falling, down 46% from a recent high. The Baltic Dry Index is a proxy for dry dock shipping stocks and, in general, a shipping market bellwether. Note that the BDI has made important lows during the 2008 financial crisis, the 2011 EU/Greek debt crisis, and the end of QE in 2015–2016. It also made a spike low at the height of the trade wars between the U.S. and China. But if the U.S. and China are making up, the BDI is not reflecting the potential.
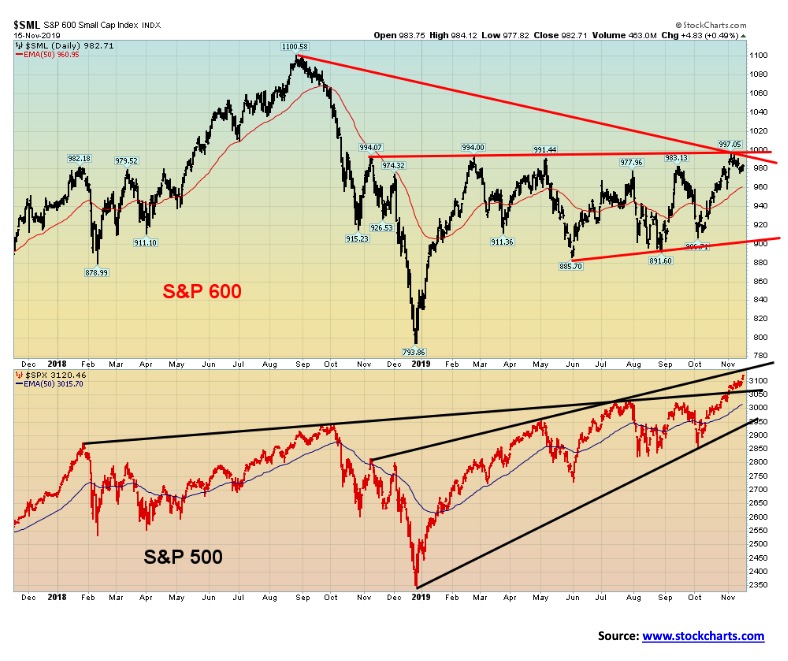
Here is another significant divergence: this one is between the S&P 500 (large cap) and the S&P 600 (small cap) indices. The S&P 600 is nowhere near its all-time high set back in August 2018. It remains down 10.7% from that high. Meanwhile, the S&P 500 is setting record highs almost daily. In a strong bull market, the small cap stocks should be leading, not lagging way behind. What’s worse, the S&P 600 fell this past week even as the S&P 500 rose once again to new all-time highs. The S&P 600 appears to have a wall of resistance just below 1,000. Six times over the past year the S&P 600 has faltered below 1,000. It is fast running out of chances.
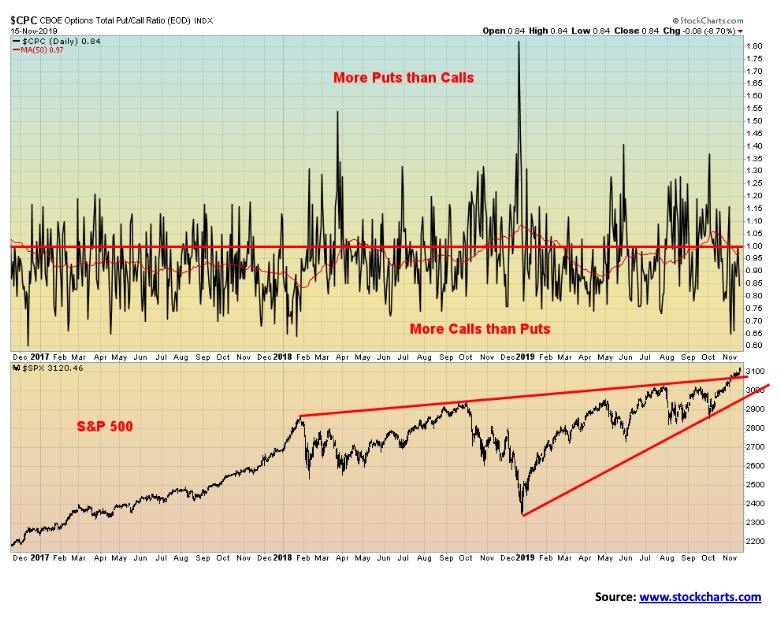
The equity put/call ratio remains in favour of calls. The put/call ratio hit a low of 0.65 this week (one publication said it hit 0.45). This tells us that there are almost two calls being bought for every put. It is the most extreme we have seen since January 2018 when the market made an important top. The put/call ratio, along with the VIX that has fallen to its lowest levels since August/September 2018, suggests a very high level of optimism and complacency in the market. Other indicators are showing the highest level of optimism and complacency since January 2018. Something to think about as we head into next week with indices at the top of channels.
While the put/call ratio and the VIX are suggesting a high level of complacency breadth, indicators such as the NYSE advance-decline line and the McLellan Summation Index (ratio-adjusted) are still bullish. So, we have breadth indicators staying positive for markets but sentiment indicators suggesting complacency that should make us cautious going forward.
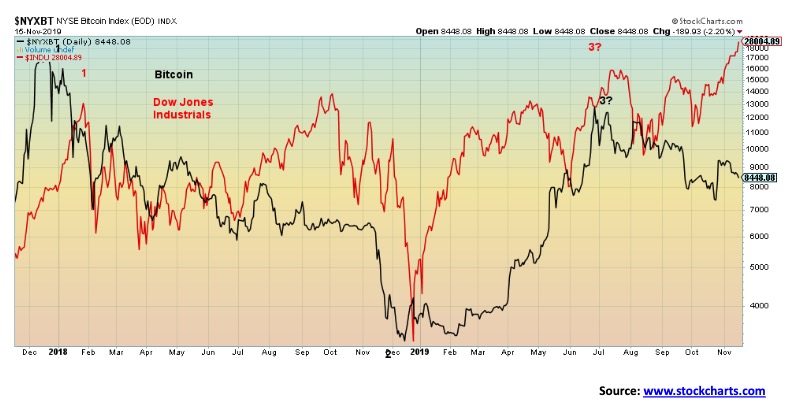
Are the DJI and Bitcoin diverging? This past week the DJI rose once again to another record close while Bitcoin actually fell, losing 3.1%. However, Bitcoin remains up 124% on the year. The last time the DJI and Bitcoin diverged was July through September 2018. At that time the DJI also rose while Bitcoin was faltering. By October/November the DJI joined Bitcoin in a steep decline. So, it is possible that once again this divergence will play itself out with an eventual decline in the DJI. Meanwhile, little has changed with the cryptos. There are now a mind-boggling 4,798 cryptos listed at Coin Market Cap (www.coinmarketcap.com). The market cap has barely changed, currently at $234 billion. Bitcoin with a market cap of $154.4 billion represents almost 66% of the total cap. Along with Ethereum and XRP, they make up almost 80% of the market. Not much left for the other 4,795 cryptos. There are 14 listed with market caps over $1 billion.
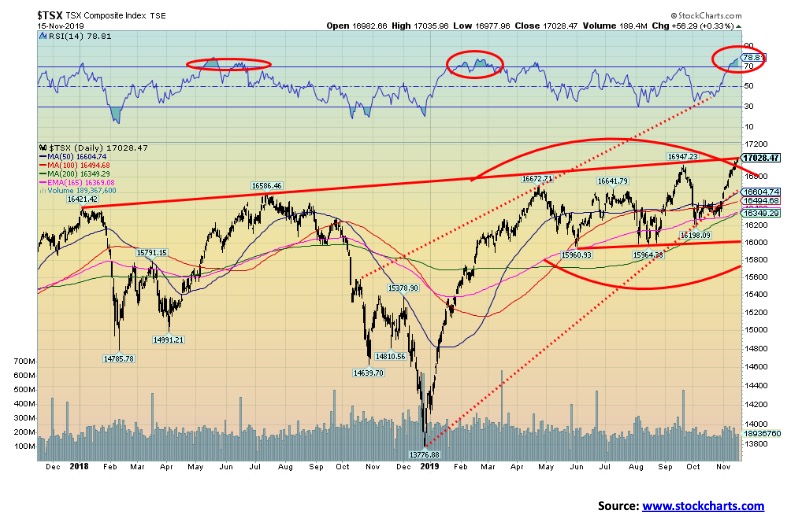
Has the TSX Composite hit its zenith? The TSX Composite rose 0.9% this past week, making and closing at record highs. However, it also hit the top of the channel with the RSI over 70. When the RSI rises to over 70, it suggests the market is overbought and could be due for a pullback. Of the 14 sub-indices, only two were down on the week. Leading the way down was Health Care off 10.3%. Health Care has been the worst performing sector in 2019. Energy was down 0.9%. Leading the way to the upside was Information Technology, up 3.6%, followed by Golds which was up 2.4%, and Telecommunications and Utilities, both gaining 2.2%. The question now is, can the TSX Composite burst through the top of the channel and go on a longer run? Two consecutive closes over 17,030 would help that cause, but with an RSI at 78 we’d say the odds of that happening right away without at least a pullback are slim to none. There is good support down to 16,400 to 16,600. But, below 16,400, a more serious decline could get underway. Major support is seen at 16,000.
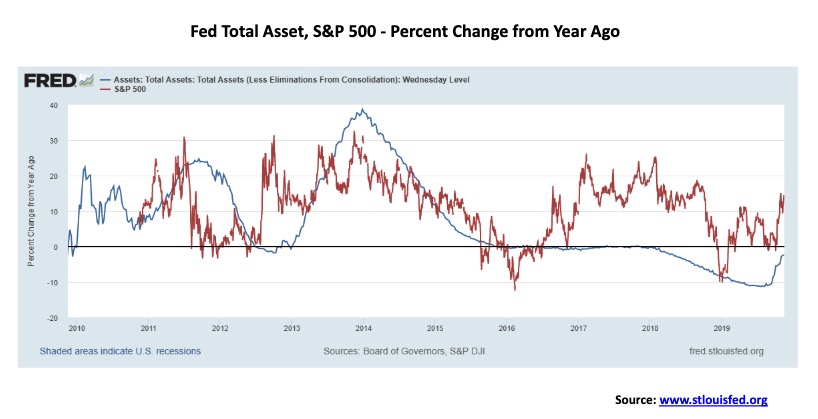
Here is a picture of the S&P 500 and the Fed’s total assets percentage change from a year earlier. Note how when the Fed’s asset change slows or the change declines the rate of change in the stock market also slows and declines. When the rate of change of Fed’s assets rises the stock market also rises. No surprise then that with the Fed boosting its assets through the current repo program (QE4?) that the stock market is also rising. It would appear that Fed liquidity injections are influencing the rise and fall of the stock market. Maybe that should come as no surprise.
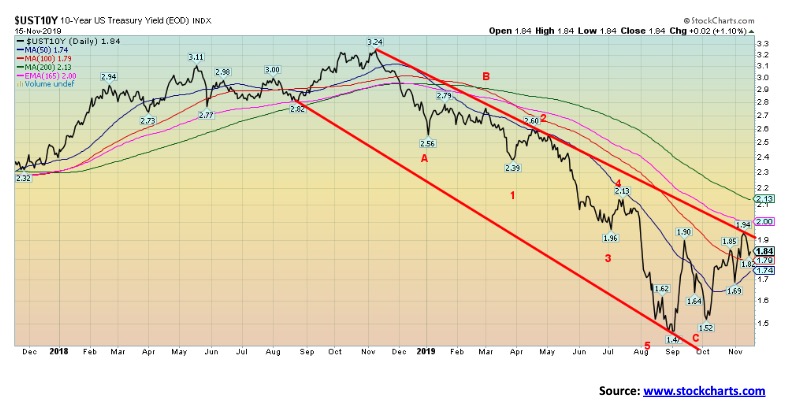
The 10-year U.S. Treasury note fell to 1.84% this past week, down from 1.94% the previous week. The Canadian 10-year Government of Canada bond (CGB) was down to 1.48% from 1.58%. Bond yields remain just above record lows. The Fed has indicated that they are probably done for the year in cutting interest rates. However, that could change. But with only one month left in the year, the last chance for cutting rates would be at the December 10–11 meeting. There is no November meeting. The December meeting will summarize economic projections. The first meeting in 2020 is January 28–29. Altogether, there are eight meetings in 2020. The Fed has described the economy as being in a “good place” and, unless things change materially between now and year-end, the Fed is done for the year. Unemployment is low although job growth has slowed. Wage growth is picking up a bit, albeit at a subdued pace and corporate earnings, while down from peaks, remain good. Profit margins are narrowing so that might be cause for concern if companies stop hiring or cut costs through layoffs. Inflation remains low. Thus, the odds for a real break to the upside in bond yields are probably low. Still, resistance is above at 2.00% to 2.15%. Above 2.15% bond yields could rise further.
The biggest concern remains in the repo market where the Fed says things are under control. However, one has to wonder why the Fed is doing this in the first place. While it’s ostensibly to keep the repo rate down to levels closer to the Fed rate, the market believes there is a liquidity problem. Rates for year-end are being quoted at 3.25% to 3.50% which is 1.50% higher than today’s levels. This coming week the FOMC releases the minutes of the October meeting. We are sure it will be closely watched.
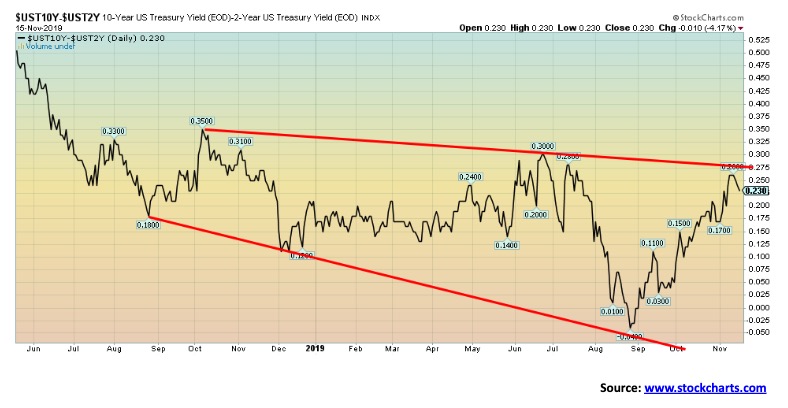
The 2-year—10-year spread fell to 23 bp this past week, down from 26 bp the previous week. The Canadian 2–10 spread fell to negative 7 bp, down from 0 the previous week. The 2–10 spread ran into resistance near 27.5 bp. It was an expected zone of resistance. The 2–10 spread was only briefly negative back in August and very quickly turned positive again. It is open as to whether the 2–10 spread would turn negative once again.
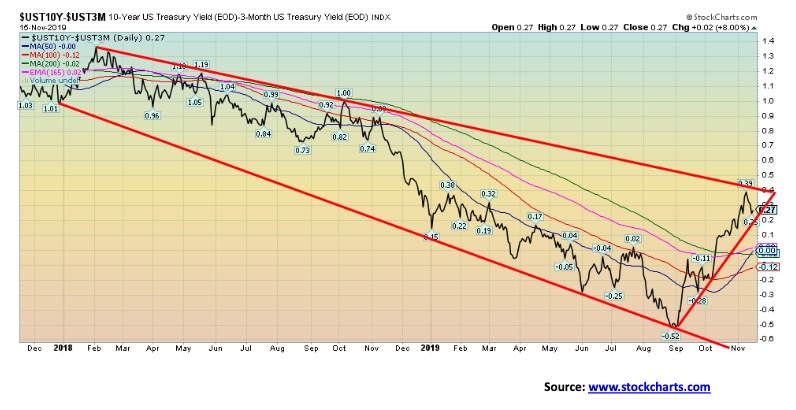
The 3-month–10-year spread fell to 27 bp this past week, down from 39 bp the previous week. The spread is still positive. The 3m–10 spread was negative from roughly mid-July through to mid-October. We have often noted that, while a negative spread is a potential recession warning, we believe we are closer to a recession once the spread turns positive again. A breakout over 40 bp would send the 3m–10 spread into new territory and suggest higher prices. There is support down to zero.
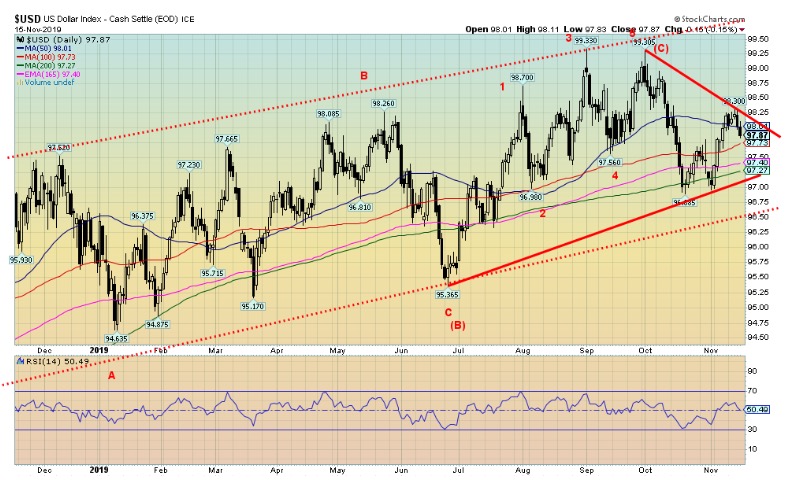
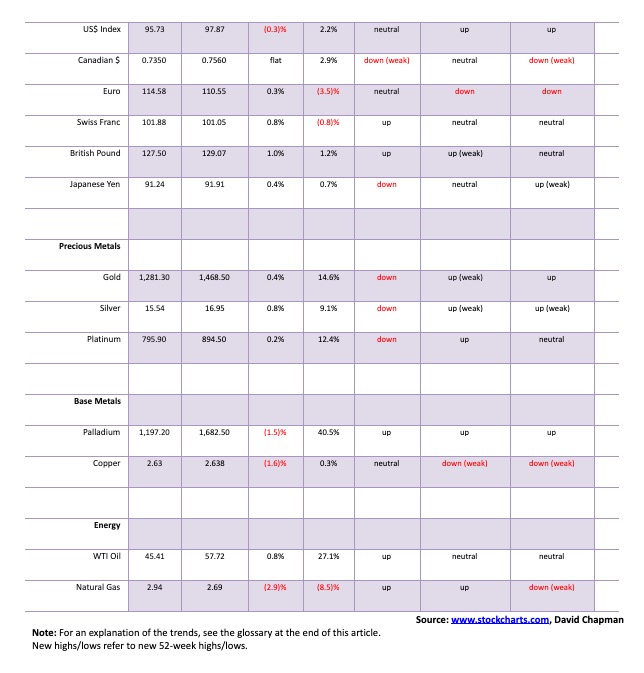
The US$ Index fell 0.3% this past week. The euro gained 0.3% while the pound sterling was up almost 1%. The Swiss franc gained 0.8%, the Japanese yen was up 0.4% while the Canadian dollar was flat on the week. The US$ Index failed just above the 50-day MA, closing back under that level by the week’s end. While a week ago the US$ Index was appearing bullish again, this past week’s drop has changed the tone once again. Resistance appears to have developed at 98.25/98.30 while any thoughts of support at 98 faded with the close back under that level. There is considerable support for the US$ Index down to 97, but if we break under that level then the next support would be down to 96.50 and even 96. Under 96, the US$ Index could start a more serious breakdown with targets down to 94. Regaining above 98.30 would be positive, but the index needs to regain above 99 to suggest new highs above 99.30. If the US$ Index had managed to stay above 98 this past week we would view it much more favourably. But the failure to hold that level suggests potential for lower prices. The euro has potential to rise to 114.
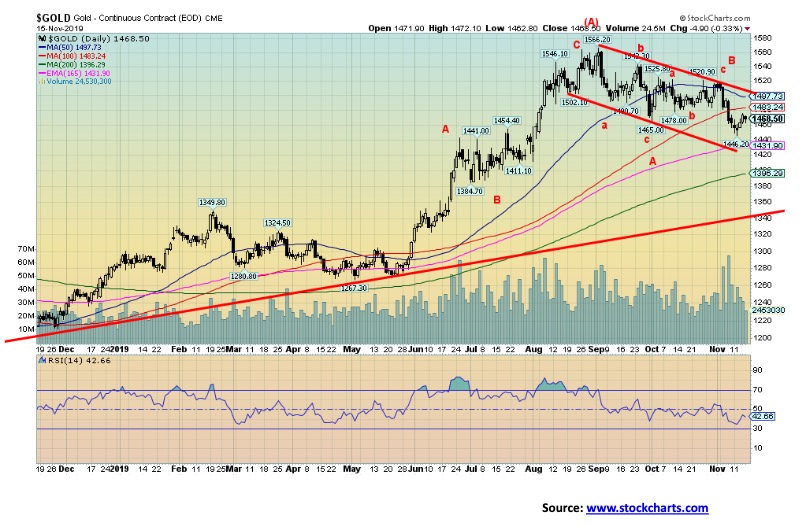
Gold was up a small 0.4% this past week while silver rose about 0.8%. Platinum gained a small 0.2% while palladium’s winning streak appears stalled for the moment as it fell 1.5%. Copper prices, that are more reflective of the state of the economy, fell 1.6%. The high volume that accompanied gold’s recent fall appears to have dissipated as volume has once again contracted. Sentiment indicators for gold and silver are neither bearish or bullish at this point. At this point we cannot say gold is finished its recent decline. We continue to fall in what appears to be a bull flag or pennant formation rather than a more bearish descending triangle. A bearish descending triangle is characterised by declining highs and relatively flat lows. This pattern has both declining highs and lows that are more typical of flag or pennant formation following a sharp run-up. A breakdown through $1,430 would, however, be somewhat bearish. Under $1,395, the market could fall to test down to $1,340. It is not unusual in a major breakout to retrace back and test the breakout zone. In this case the breakout zone was seen at $1,350/$1,370. It doesn’t have to test back that far to satisfy any retest. The $1,500 to $1,525 zone remains important to the upside. Once we break above that level, then the next key breakout zone would be seen at $1,540. Above that level, new highs above $1,565 are possible. We remain positive towards gold but recognize the current corrective period may not be over. We are also wary of some bearish analysts towards gold who believe gold be in the early stages of a major breakdown. Given that gold spent 2011 to 2015 in a long-term decline and another three years forming its base we find it unlikely that gold’s current bull run is over. With the U.S. dollar appearing poised to break down gold usually follows the U.S. dollar in the opposite direction. As well, the entire junior mining sector remains buried in bearish sentiment. That alone we believe is a positive sign as the sector can’t get much worse than it already is without shutting down completely.
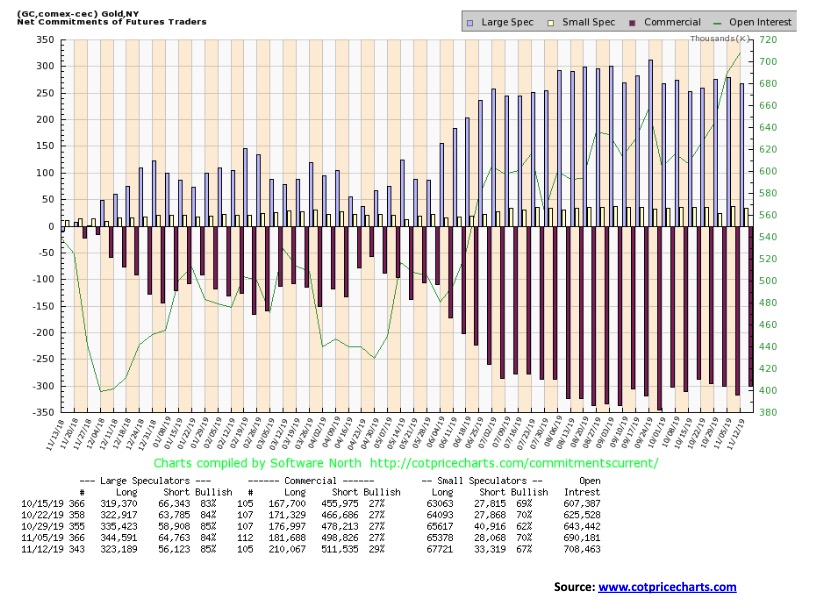
The gold commercial COT improved this past week to 29% from 27%. Long open interest rose over 28,000 contracts while short open interest was also up but only by about 13,000 contracts. The large speculators (hedge funds, managed futures, etc.) COT also rose to 85% from 84%. However, there long open interest fell by roughly 21,000 contracts and short open interest was down over 8,000 contracts. The improvement is welcome; however, the gold commercial COT is not yet at levels we would consider bullish. We’d prefer to see the COT closer to 40% and even over 40%. At this stage we consider the commercial COT neutral with still some leaning towards bearish.
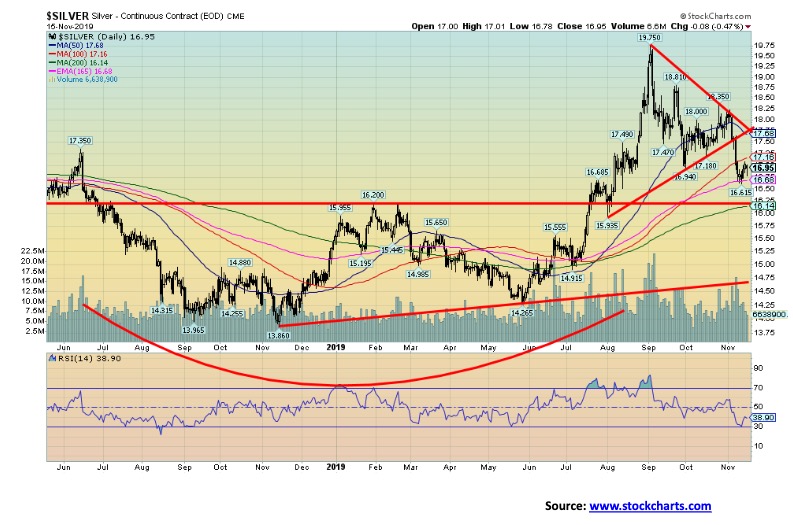
Silver prices appear to have found support near the 165-day exponential MA. Silver prices gained about 0.8% on the week. There is further support for silver down to $16.15, but a break under that level and especially under $16 could send silver prices even lower. Silver broke down out of what appears as a large symmetrical triangle with potential targets down to $13.70. Minimum objectives were down to $16.60 which was largely achieved with the low thus far at $16.615. Silver needs to regain $17.70 to suggest that the current corrective period might be over. Regaining above $18.80 would suggest that new highs above $19.75 are possible.
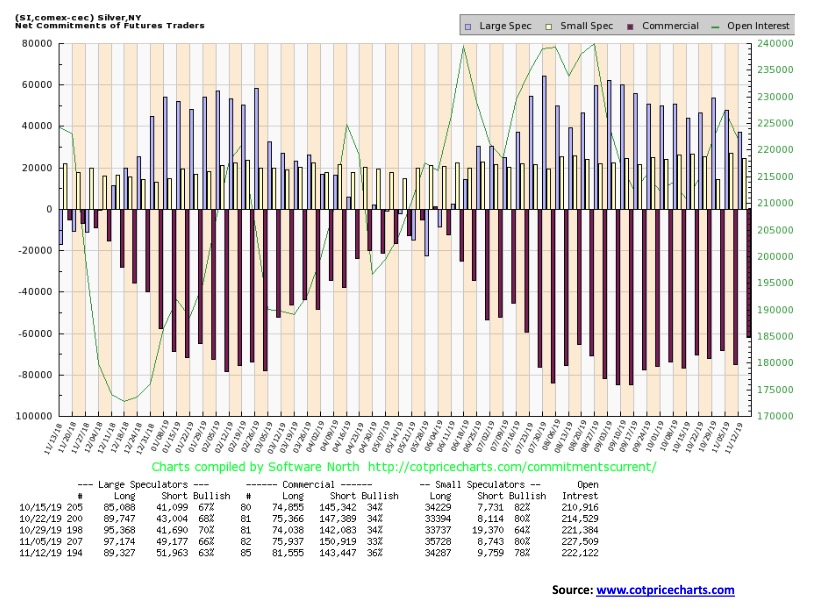
The silver commercial COT improved to 36% this past week from 33%. Long open interest rose about 5,500 contracts while short open interest fell over 7,000 contracts. The large speculators COT fell to 63% from 66% as long open interest fell and short open interest rose. The silver commercial COT is at its best level since July. Our preference would be for the silver commercial COT to rise above 40% and preferably towards 50% to become bullish.
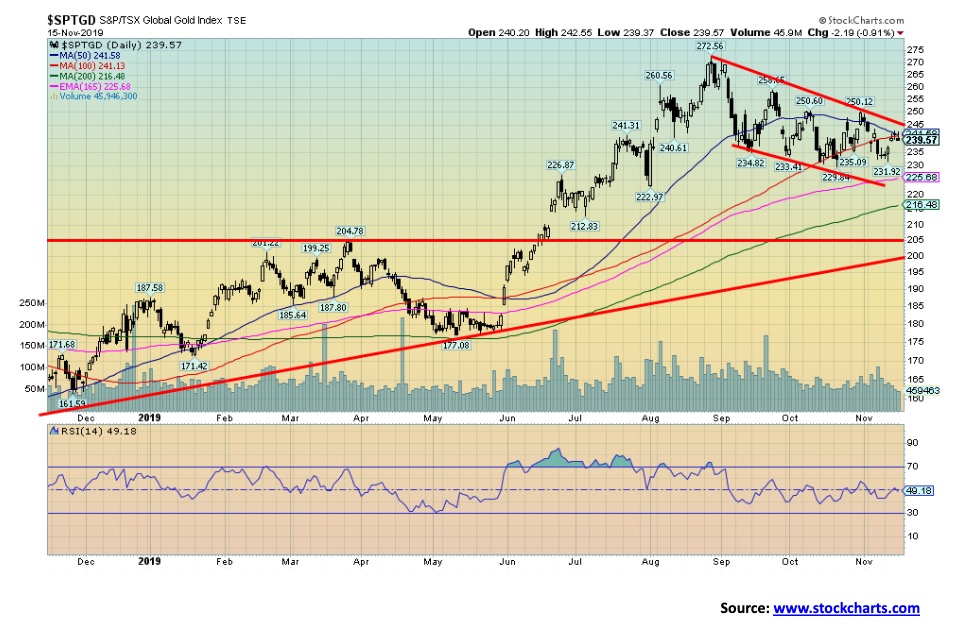
While both gold and silver both made small gains this past week, the gold stock indices performed reasonably well. The TSX Gold Index (TGD) gained 2.4% while the Gold Bugs Index (HUI) was up almost 3.0%. Both indices remain below potential breakout points. The upside breakout point for the TGD is at 245. Both indices appear to be forming what we would call bull flags or bull pennant formations. Indicators are relatively neutral here and sentiment towards the gold stocks is also relatively neutral. The TGD breaks down under 225 and especially under 215. A major breakdown and longer-term bear market would get underway with a break under 200. Regaining 260 would be positive and suggest that new highs above 272 are possible. Volume has tailed off during this corrective period. Both indices remain well up in 2019 with the HUI up 30.8% and the TGD up 28.3%. The pattern that has formed on both the HUI and the TGD appears to be bull corrections and not the start of a new bear market. Our expectation is that both should break to the upside once this period is complete. The current pattern for the TGD suggests a potential move to 285–290 once the TGD breaks firmly above 245.
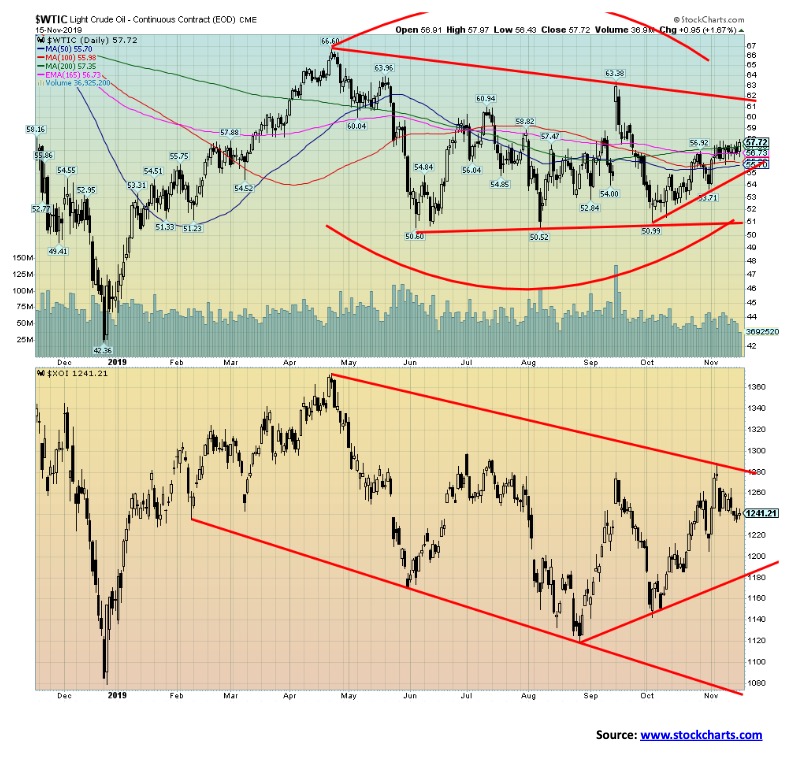
Oil prices continue to respond to the trade conflict between the U.S. and China. If a trade deal appears to be happening, oil prices firm. If a trade deal appears to be further away, oil prices soften. Other than that, there is not much that is moving the needle for oil prices unless war suddenly breaks out in the Middle East involving Saudi Arabia and Iran. There was a surprise crude oil draw this past week and that helped firm prices at the end of the week. WTI oil rose 0.8% on the week. The energy indices did not respond as the Arca Oil Index (XOI) fell 1.4% while the TSX Energy Index (TEN) was off about 0.9%. It probably didn’t help that natural gas prices were down 2.9% on the week. The only other event this past week that could have any potential effect on oil and gas prices was the ousting of former President Evo Morales in Bolivia. Bolivia is a producer of both oil and gas and, more importantly, is a major source of lithium and some other rare earths. Bolivia is ranked sixth in oil reserves in South America and second in natural gas reserves. Bolivia is the second poorest country in South America, generally ruled by a powerful oligarchy, and the country has huge wealth inequality. Morales was ousted by the military, allegedly over election fraud, effectively turning this into a potential military coup as the military backed a senate leader as the interim president. Morales was indigenous and has strong support amongst the indigenous people of Bolivia. The country is over 80% Mestizo (mixed) and indigenous. Over half the population is considered indigenous and even those who consider themselves Mestizo identify primarily with the indigenous population. Morales fled to asylum in Mexico.
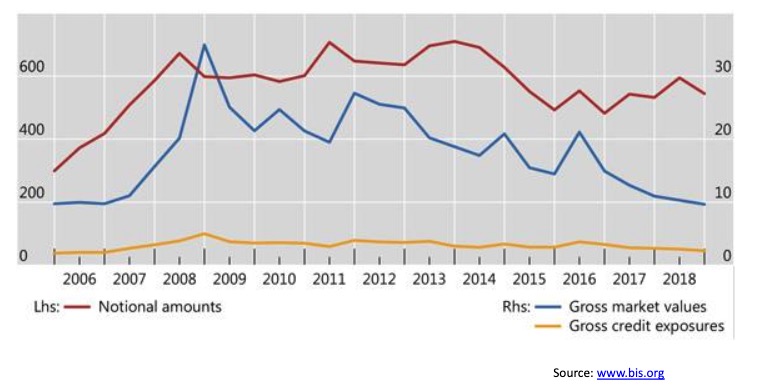
We have rarely (if ever) featured a chart on outstanding derivatives. This chart is from what is known as the BIS (The Bank for International Settlements), also known as the central bank for the central banks. The BIS was founded in 1930 and is headquartered in Basel, Switzerland. It is the oldest global financial institution and it operates under international law.
According to the BIS, the notional amount of OTC derivatives stood at $544 trillion at the end of December 2018. That declined from $595 trillion outstanding at the end of June 2018. Estimates for the first quarter of 2019 put the amount at around $640 trillion. The BIS reports only on OTC derivatives so this does not include derivatives traded on exchanges such as the Chicago Mercantile Exchange (CME). Total global derivatives are estimated at over $1.2 quadrillion.
Remember, these amounts are notional. The market value of the derivatives is $9.7 trillion. Based on that, the notional value of Deutsche Bank’s derivatives is estimated at $49 trillion but its market value is only $0.9 trillion. All of this is actually down from what was outstanding and at risk in 2008 at the time of the financial crisis. Finally, the actual credit exposure of derivatives is even less. According to the BIS, credit exposure is only $2.3 trillion at the end of 2018 or 0.4% of the notional amount. Much of that is offset by netting agreements between financial institutions.
So, what are the kinds of derivatives? Derivatives are foreign exchange contracts, currency swaps, interest rate swaps, future rate agreements (FRAs), options, and other products such as credit default swaps. Other products make up less than 7% of total OTC derivatives outstanding. Derivatives trading takes place in equities, interest rate instruments, commodities, foreign exchange, and credit. The dominant currency is U.S. dollars, but there are also outstanding derivatives in euros, Japanese yen, pound sterling, Canadian dollars, Swiss francs, Swedish krona, and also other currencies. By instrument, the dominant contracts are for interest rate swaps. The dominant financial institutions include J.P. Morgan Chase, Citibank, Goldman Sachs, Bank of America, Morgan Stanley, Credit Suisse, and, of course, Deutsche Bank. All major global banks are active in derivatives, including Canada’s banks: CIBC, BMO, TD, RBC, BNS, and NBC.
Much has gone on globally to lower the risk in derivatives. Calls that the global derivatives will blow up and cause the financial system to collapse are just not warranted. There is definitely risk and losses could be substantial, but not in the trillions of dollars often cited by some pundits.
—
(Feature image by Markus Spiske via Unsplash)
David Chapman is not a registered advisory service and is not an exempt market dealer (EMD) nor a licensed financial advisor. We do not and cannot give individualised market advice. David Chapman has worked in the financial industry for over 40 years including large financial corporations, banks, and investment dealers. The information in this newsletter is intended only for informational and educational purposes. It should not be considered a solicitation of an offer or sale of any security. The reader assumes all risk when trading in securities and David Chapman advises consulting a licensed professional financial advisor before proceeding with any trade or idea presented in this newsletter. David Chapman may own shares in companies mentioned in this newsletter. We share our ideas and opinions for informational and educational purposes only and expect the reader to perform due diligence before considering a position in any security. That includes consulting with your own licensed professional financial advisor.
DISCLAIMER: This article was written by a third party contributor and does not reflect the opinion of Born2Invest, its management, staff or its associates. Please review our disclaimer for more information.
This article may include forward-looking statements. These forward-looking statements generally are identified by the words “believe,” “project,” “estimate,” “become,” “plan,” “will,” and similar expressions. These forward-looking statements involve known and unknown risks as well as uncertainties, including those discussed in the following cautionary statements and elsewhere in this article and on this site. Although the Company may believe that its expectations are based on reasonable assumptions, the actual results that the Company may achieve may differ materially from any forward-looking statements, which reflect the opinions of the management of the Company only as of the date hereof. Additionally, please make sure to read these important disclosures.


Graph Therapeutics Secures $5M to Advance AI-Driven Precision Therapies
Biotechnology company Graph Therapeutics raised 5 million dollars in a funding round led by Daphni, with support from existing investors....


DEA Hearing Signals Historic Turning Point for U.S. Cannabis Policy
The DEA has begun a key hearing on reclassifying cannabis from Schedule I to Schedule III, following a recommendation from...


Italy Leads Europe in Digital Sustainability Reporting for SMEs, EFRAG Finds
Italy leads Europe in digital sustainability reporting tools for SMEs, according to EFRAG’s second mapping of VSME platforms. The ecosystem...


RLUSD Launch in Japan Amid XRP Price Decline and Uncertain Outlook
Ripple and SBI launched the RLUSD stablecoin in Japan after JFSA approval, signaling strong progress in tokenization. However, XRP fell...


Youth Cannabis Use in Colorado Is Falling — But the Full Story Is More Complex
The 2026 Colorado survey shows teen cannabis use fell to 10 percent in 2025, down from 21 percent in 2015....
 |
|
 |  |
 |
|
-
 Cannabis6 days ago
Tilray (TLRY) Falls as Bearish Momentum Persists Despite Marketing Push
-

 Biotech1 week ago
New Gene Therapies Transform Rare Disease Care, but Gaps Remain
-

 Biotech1 day ago
Abivax Shares Surge as New Trial Data Eases Safety Concerns Over Ulcerative Colitis Drug
-

 Crowdfunding1 week ago
Ithaca: Climate Road Trip RPG on Climate Resistance