Business
How COVID-19 plunged the world into an unprecedented economic and social crisis
A health crisis has morphed into an economic, social and political crisis. We are now bearing witness to its devastating consequences. When will we come out of this? We don’t know nor it seems does anyone else even as many try to end the lockdown. Negative yield curves have once again proven their predictive powers. The stock market has rebounded but now it has reached a crucial point.

If the business of America is business, then it is not doing too much business these days. A health crisis has become a social, economic crisis and, a political crisis. Never, or maybe we should say, never in our more recent history have we faced a crisis of this magnitude with so many conflicting interests.
For the biomedical community, the priority is health. The biomedical community is driven by data, not by public opinion. Their desire is to minimize casualties and deaths. In the absence of a vaccine or proven medications (setting aside the debate about chloroquine), and in the absence of the ability to provide testing and track patients, the biomedical community has chosen the path of least resistance— social distancing and shelter in place. Stay with your family and don’t venture out unless it is necessary.
While this is supported by most people on moral grounds at least, many do not take social distancing seriously. Many are used to greetings that include shaking hands, hugging, and kissing. Staying in one place is very difficult for Western society at least, where people are used to moving about relatively freely. Staying with your family is great, but not necessarily great for families that were already dysfunctional. And staying in place may not be so great for those living alone or for those living with unrelated people.
To implement the recommendations of the medical community, we have created a social and economic crisis. First, the social. The family unit is the core with one or both parents working and kids in school. Except that the traditional family unit is not necessarily the norm today. In 1970, the traditional nuclear family made up roughly 40% of family units. Today it is closer to 20%. Being married without children has remained relatively steady, between 25%–30%. Singles who made up only 15% in 1970 are now at least 25%–30%. While other types of family units make up the rest. Some 70%–80% of units are made up of non-traditional nuclear families.
But the medical crisis has changed everything. Many people have lost their jobs. Those that have jobs have been sent home to work, in some cases, at the kitchen table with inadequate equipment. Schools are shut and kids are either doing e-learning, being home schooled, or, in many cases, doing no schooling at all. Those that are working because they are either essential or because their business has been allowed to remain open are under mounting stress. Going out, meeting friends, shopping, going to restaurants, a movie, a concert, playing sports, going to the gym, meeting your friends to shoot some hoops, taking classes. and more—all gone. The result is economic: unemployment has soared, supply chains are broken, and sales of goods and services have collapsed. Add that to the social aspect that people are stuck at home and when they do go out, they are supposed to social distance. That’s something that might be easy in a leafy, affluent suburban setting but more difficult in an urban setting of crowded apartments where the playground is the balcony, if you have one.
And the loss of all of that creates tensions. Dysfunctional families become more dysfunctional. Domestic violence is on the rise. While many singles can cope, some don’t or can’t and depression is rising. Many singles live in units with unrelated people. This becomes a problem for social distancing and can even create tensions in the unit where none existed before. The political part is trying to mitigate the crisis with programs costing billions of dollars to help individuals and business, hopefully to ease unemployment and to prevent mass bankruptcies and potentially rising homelessness.
But despite committing upwards of 10% of GDP or more, tens of thousands of people are poised to fall through the cracks, which could result in rising bankruptcies, rising homelessness, rising depression, rising suicides, rising domestic violence, rising civil disobedience, and, even rising crime, although initially at least crime has fallen. Some countries have used the crisis to crack down on dissent and reporters. Without an economy that is working for everyone, saving lives from COVID-19 won’t matter if the health of society as a whole deteriorates as the deficits soar. Was closing off all parks—provincial, conservation, state, and national—really such a good idea? And now we learn that the lockdowns could have a negative impact on food supplies, power grids, and telecommunications due to labour shortages.
The easy answer to this is that this ends quickly. And that a vaccine is found quickly. A solution is needed. This has already gone on for over a month and things are already beginning to fray. Drag this on for months and the situation darkens. So why are we in this mess? There was a lack of proper stockpiles of medical equipment and a shortage of ICUs and even beds; we lacked good data with the ability to properly test and track; we were slow off the mark despite watching China’s difficulties through February. Western societies, meaning primarily North America and the EU, have built themselves a trap that is difficult to escape from.
Some Asian countries—through good planning, agility, and general luck? —are already able to function fairly normally. Think Taiwan and South Korea, especially Taiwan where there are fewer casualties, considerably less economic damage, and people go about as usual. China used brutal measures to enforce lockdowns that effectively meant: obey or else. That they delayed advising the world community about the disease is moot. Even if they had warned us earlier, the unpreparedness of the West would still be evident. Would the brutal enforcement used by the Chinese work in North America and the EU? Probably not.
The IMF is already forecasting that the global economy is in deep trouble. The question begs: will what could be a steep recession turn into an economic depression? Some believe it will, calling it the “Greater Depression.” Others think this will pass quickly, a V-shaped recovery. The IMF suggests this will be the deepest decline since the Great Depression although they don’t, at this stage, believe it will last as long. The recovery will be quick. The advanced economies are expected to decline by 6.1%, emerging economies by at least 1% and global GDP to fall at least 3%. It is the first time the IMF has stated there will be a fall in global GDP.
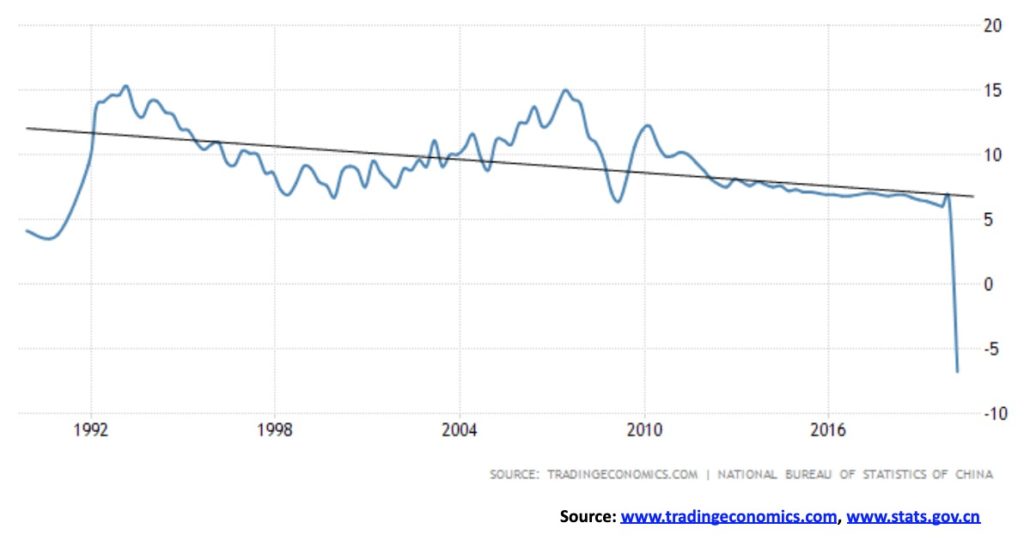
The IMF is looking at the U.S. falling 5.9%, the U.K. 6.5%, the eurozone 7.5% (Italy 9.1%). And while China and India are expected to fall but remain in the black, there was a bit of a shock when China’s GDP fell 6.8% year-on-year in March 2020. India is expected to report Q1 year-over-year GDP at around 1.9%. These numbers do considerable damage to their economies, damage they can ill afford as social tensions rise. China may have re-opened but the consumer is sitting on his hands. They are fearful that this isn’t over and the worst is yet to come. As to the world’s poorest countries, the IMF has pledged to cancel $214 million in debt to the 25 of the world’s poorest countries, mostly in sub-Sahara Africa. Cancel millions when billions are needed.
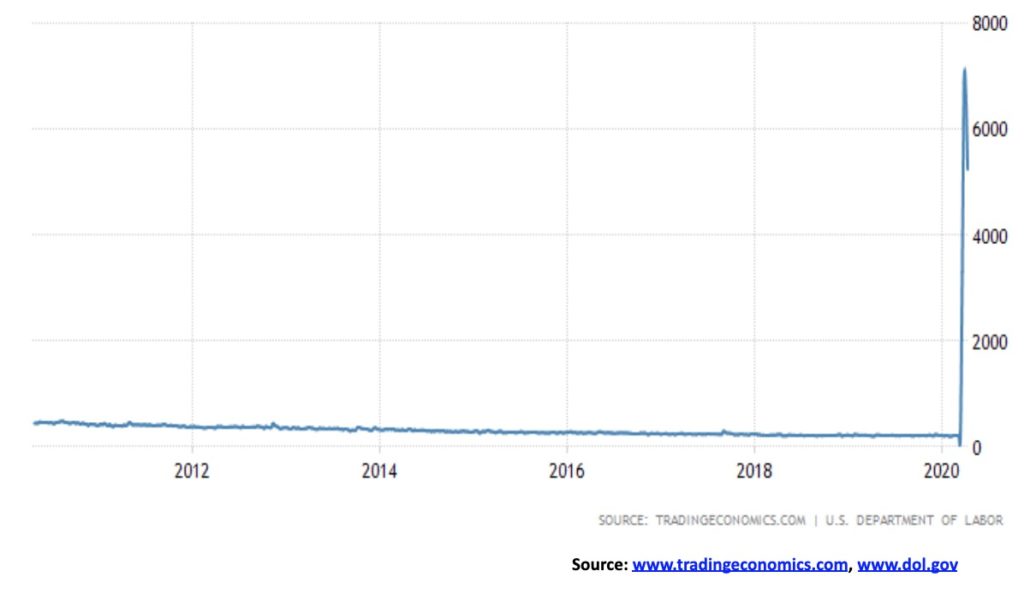
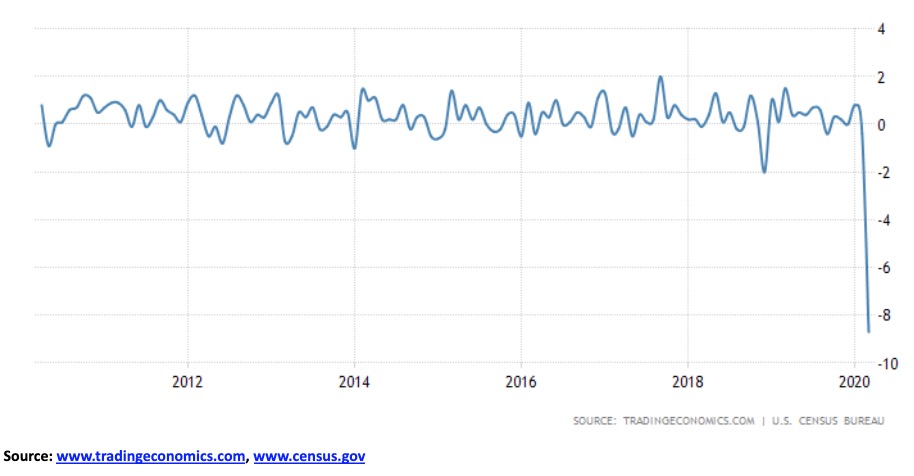
The U.S. reported that this past week’s initial jobless claims were 5.25 million. The market expectations consensus was for 5.1 million although it ranged as high as 8 million. Taken together with the past three weeks, job losses total some 22 million, effectively wiping out more than 10 years of job gains. We can’t even fathom that on a chart as all it shows is years of a straight line, then this massive spike. To put the job losses of 22 million in some perspective, the population of Taiwan is 23.8 million. Never in a 4-week period have that many jobs been lost in the U.S.
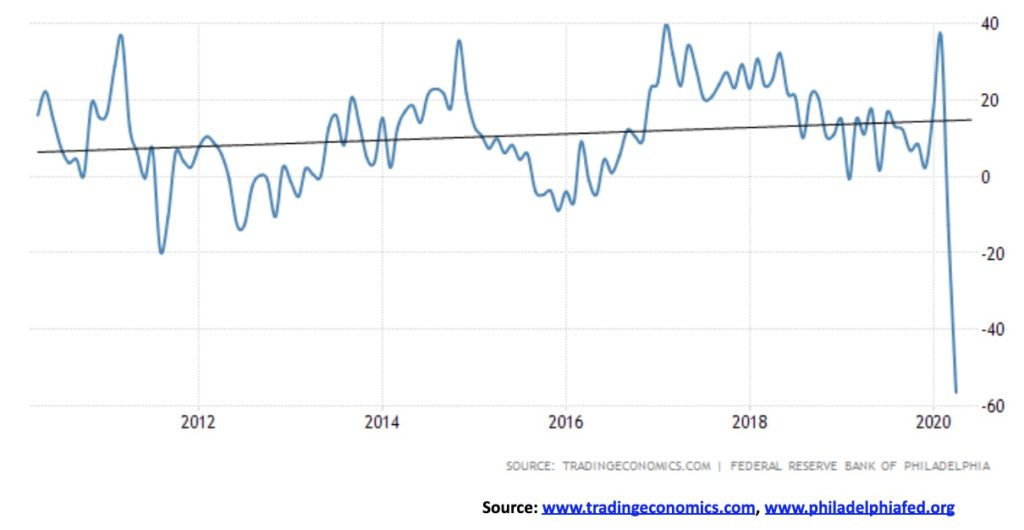
Some analysts are now expecting the U.S. unemployment rate to leap to 20%. An estimated 1 in every 5 workers would be out of work. Even if, as Trump wishes, the U.S. to re-open tomorrow it would take months or longer for any kind of normalcy to reappear. The U.S. also reported that the April Philadelphia Fed Manufacturing Index was -56.6, far below the expectations of -12.7 in February and well below the -30 expectations. It was the lowest recorded number since 1980.
The Bank of Canada (BofC) and StatsCan showed that the March GDP plunged by about 9% annually, the sharpest decline on record dating back to 1961. This is a preliminary number. First quarter GDP is expected to show a decline of 2.6% which would translate to 10.4% annually. The BofC also noted that trying to forecast right now was extremely difficult and that it can’t be done “with any degree of confidence.” Tens of thousands of small Canadian businesses are desperate for assistance. Many are too small to be eligible for the loans, etc. that are currently being offered as they don’t meet the $50,000/annual payroll. Expectations are growing for widespread bankruptcies and permanent closings. Cities are being placed on the brink of bankruptcy, transit systems dependent on ridership are verging on the edge of collapse, and charities are threatened with permanent closure due to a lack of funds. There is also been a steep drop in home listings, although at this time house/condo prices are not yet showing signs of falling. That could change and a housing market crash could follow. Oil and gas companies are preparing for possible cuts to their dividends, especially with WTI oil falling to the $20 level and Western Canada Select under $5.
And what about the debt? The U.S. budget deficit has now surpassed $2 trillion and is rising. That’s over 10% of GDP. Some believe it will hit $4 trillion. Canada’s budget deficit could hit as high as $180/$200 billion. Save the economy now. Who cares about debt. Interest rates have been slashed to zero and we expect it will remain that way for years. “QE to infinity followed by gold balancing the balance sheets of the sovereign balance sheet disasters” – Jim Sinclair. Deal with the debt hangover and pain later. We’ve been pushing the can down the road for upwards of 50 years now. At some point the piper must be paid.
The U.S. government debt to GDP is now over 113% and rising. Look out Greece; here comes the U.S. Both Canada and the U.S. are resorting to direct payments and massive monetary stimulus through quantitative easing (QE4). Both the Fed and the BofC are purchasing not only U.S. treasuries and Government of Canada securities but also investment grade corporate bonds, mortgage-backed securities (MBS), and here in Canada provincial bonds. It is an unprecedented move to help save the economy. For the BofC it is the first real foray into the world of QE. The BofC did not employ QE during the 2008 financial crisis.
But it is the corporate debt that has always concerned many. No, not top ranked corporate bonds that would most likely survive anyway but the massive amount of BBB-rated (lowest investment grade bonds) and lower corporate bonds (i.e., junk bonds). A number of BBB-rated bonds have already been downgraded to junk and junk bonds have been downgraded further. That hasn’t stopped the Fed from buying junk bonds like Ford Motor (F-NYSE). The probability of default category has grown with S&P. They have released a list of the industries most and least impacted by the COVID-19. The five industries listed below were the most negatively impacted.
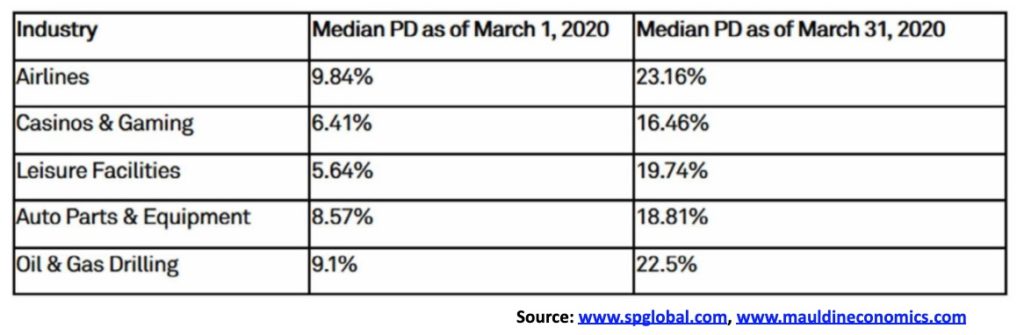
The least impacted were: Property & Casualty Insurance, Health Care REITS, Multi-Line Insurance, Life & Health Insurance, and Industrial REITS. The negatively impacted sectors should probably be avoided.
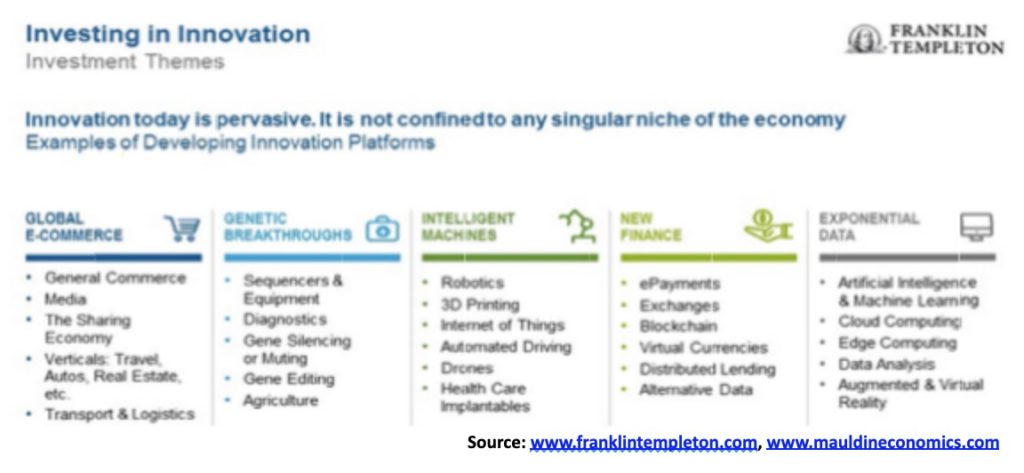
One area analysts are touting as relatively secure from the scourge of recession is innovation. We find that interesting as innovation is not something that is going to go away, no matter how deep the recession.
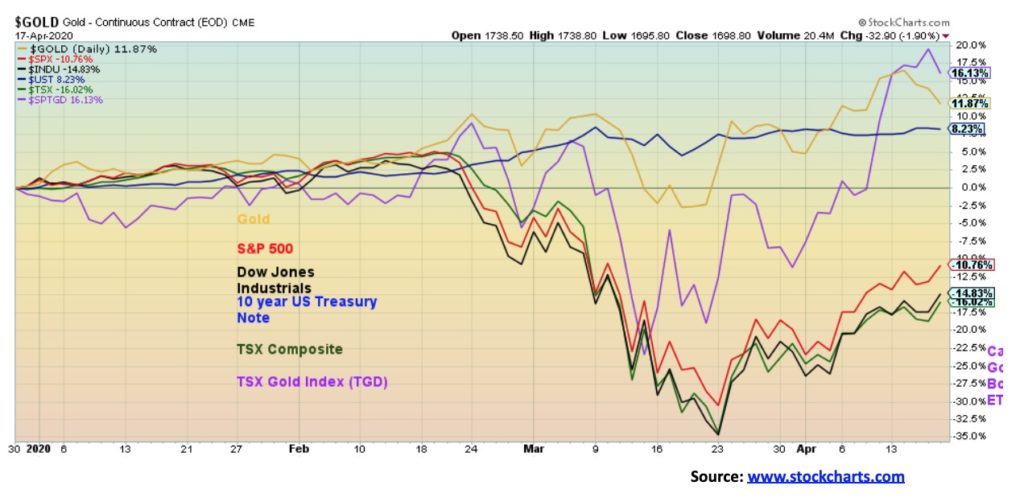
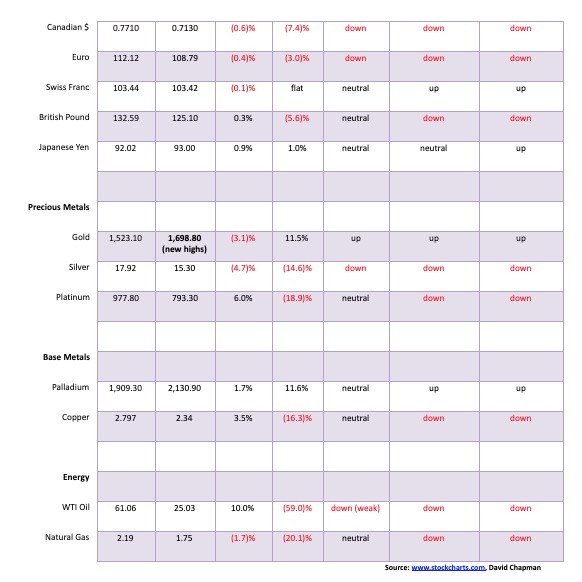
One area that has been shining throughout the stock market crash and COVID-19 has been gold. To date in 2020, gold is up 11.9% vs. a decline for the S&P 500 of 10.8% and the TSX Composite of 16.0%. Gold stocks, as represented here by the TSX Gold Index (TGD), are up about 18.0% so far. Bonds have also done well, with the U.S. 10-year treasury note up 8.2%. Comparable returns are seen in Canada as well.
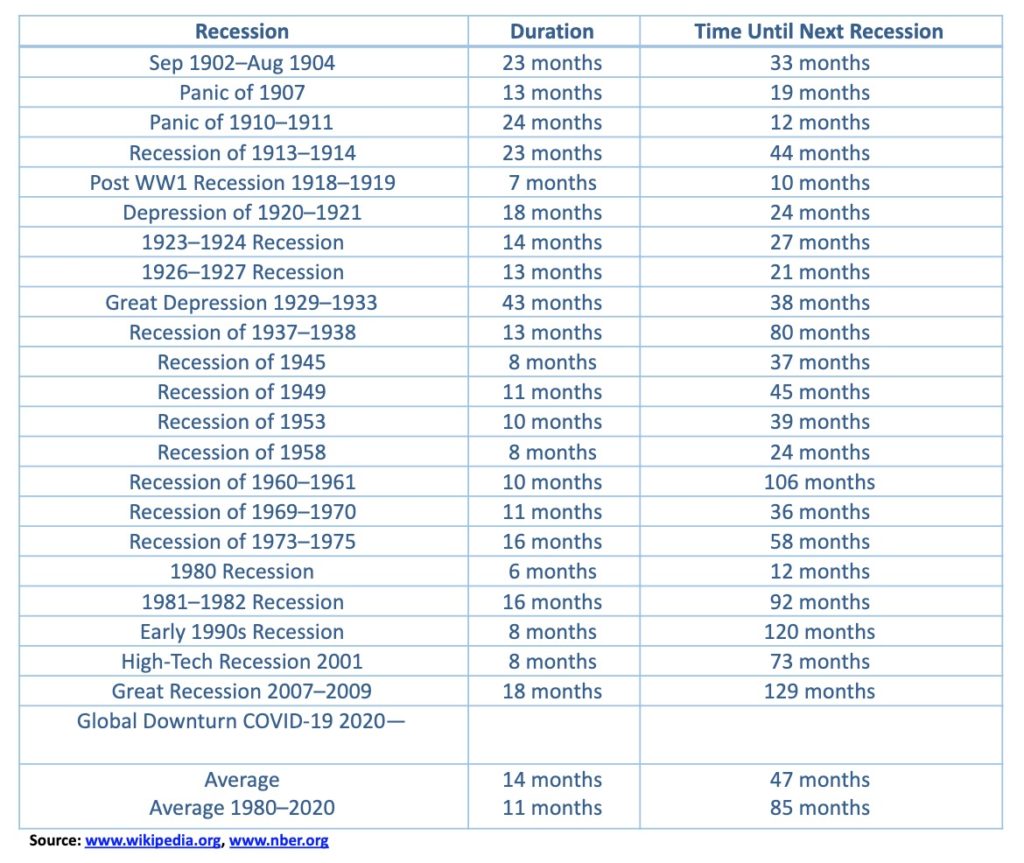
It has been a long time since the last recession, the longest since 1900. Our table below compares the economic recessions of the U.S. since 1900. In the Great Depression, unemployment peaked in 1933 at 24.9% and the decline in GDP was 26.7%. The Great Recession saw unemployment peak at 10% in 2009, the highest since the 1981–1982 recession while the decline in GDP was only 5.1%, the steepest since the Recession of 1945. What will this one bring?
Is the U.S. headed for bankruptcy? Seems like a foolish question. After all, the Fed has almost unlimited ability to effectively “print money.” But in looking at the U.S. Debt Clock (www.usdebtclock.org), we note the following:
- U.S. total debt is $77.0 trillion, representing roughly 30% of all global debt of $255 trillion. Consumer debt totals $20.5 trillion, Federal debt $24.3 trillion, State and Muni debt $3.3 trillion and corporate and financial debt $28.9 trillion.
- The U.S. total debt to GDP is 358% and rising.
- Listed assets total $144.9 trillion, most of which household assets totals $114.7 trillion.
- Unfunded liabilities that include social security and Medicare total $144.5 trillion.
The COVID-19 health crisis is triggering an unprecedented economic, social, and political crisis. Any thoughts that we’ll come out of this relatively unscathed is wishful thinking at best, delusional at worst.
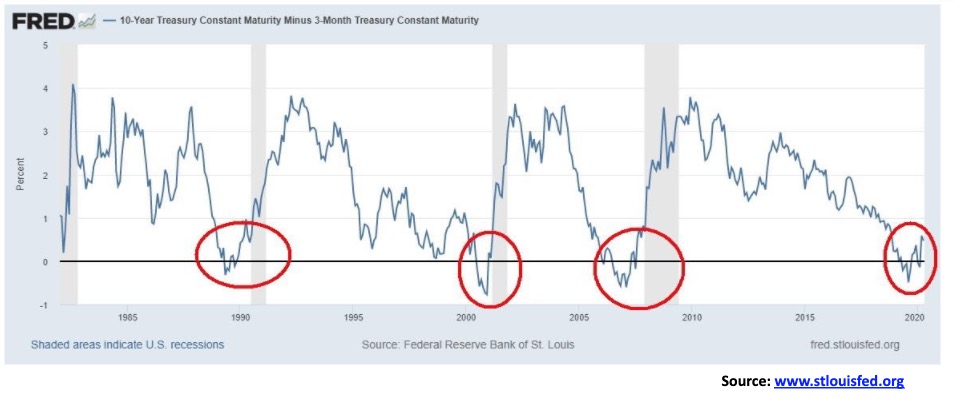
Has the negative yield curve done its job again as a predictor of a recession? One thing that has been consistent in the past is that the yield curve turns negative roughly 6–7 months before the start of a recession. By the time the recession hits, the yield curve has normally turned positive once again and then often peaks shortly after the recession ends. The snapshot above is not all-conclusive as it only goes back to the past three recessions. We also looked at the 2-year—10-year spread that took us back into the 1970s and the same phenomenon was present for both the 1980 and the 1981–1982 recessions, although it wasn’t as clear as the inflationary period distorted the yield curve considerably during that period.
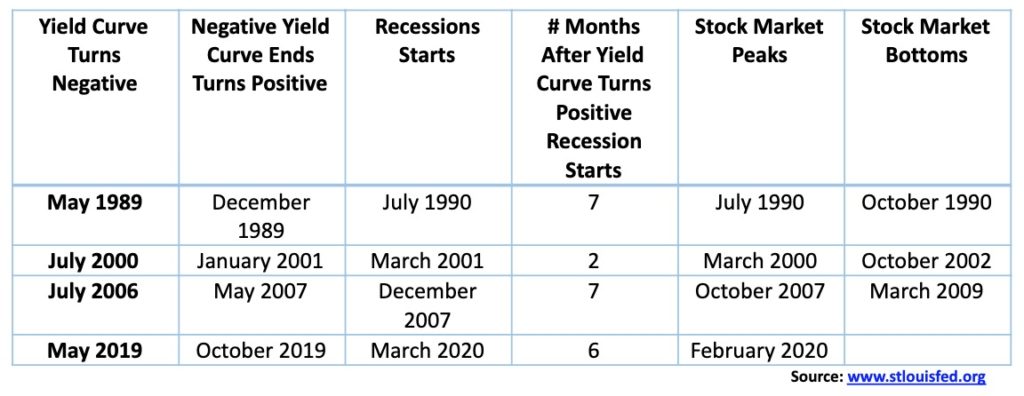
Except for the 2001 recession where the negative yield curve ended only two months before the start of the recession, generally it was seven months, although this time it appears it was only six months. The 2001 recession was odd as it didn’t actually get underway until March 2001, even though the stock market made its final top a year earlier (S&P 500). Even as the yield curve turned negative the stock market usually kept moving higher and, as with the recession, the yield curve had turned positive again when the stock market topped. The yield curve turning negative is merely a warning sign that a recession may be imminent. A negative yield curve also does not stop the stock market from moving higher. Both the recession getting underway and the stock market top occurs upwards of six, seven months after the yield curve turns positive again. Many mistakenly believe that once the yield curve turns positive again the risk of a recession recedes and that the stock market would now continue onward and upward forever. Just these few observations seem to put that theory to rest. A recession is getting underway and the stock market has most likely seen its final top for some time.
What a rally! Throw gobs of money at the market and lo, following an historic 35% collapse in the space of a mere 33 days we have now rebounded 31%. Let’s party. The depression is over. Long live the new bull market.
Okay, we have retraced so far, a rather classic 50% to 61.8% of the entire drop. But is it safe to say the bear is over? The markets have been rallying because of thoughts that the economy will soon open up and on some positive news about a possible treatment for the coronavirus. Gilead Sciences (GILD-NASDAQ) leaped 8% on Friday after it saw rapid recovery from fever and respiratory symptoms in patients being treated with its remdesivir anti-viral drug treatment. China got into the game with plans to boost its economy with further stimulus measures.
All of this is against the backdrop of the number of cases at least plateauing at an elevated level and despite the sniping and accusations between the U.S. and China as to who is at fault for the coronavirus. It’s the classic “he said/he said” type of stuff. Except it is the two most powerful nations in the world who have been at each other’s throats for the past few years over trade and a host of other complaints leveled against each other. A reminder that, in the past, this type of sniping eventually led to real wars—the most famous being WW1, only replace China and the U.S. with Germany and Britain. History is replete with economic power struggles between two major powers that eventually led to wars.
The Fed threw some damper on the party on Friday with comments that they see heavy downside risk into year-end. Some U.S. governors said they will decide when to lift lockdowns, not Trump. Civil disobedience is growing, egged on by Trump as armed protestors showed up on the steps of the Michigan capital building. As well, armed protestors were present in Kentucky and North Carolina. They were egged on by right-wing media pundits and waving Confederate flags as well as openly carrying AR15s and other weapons. We mention this as we have noted civil disobedience will grow the longer this lockdown continues.
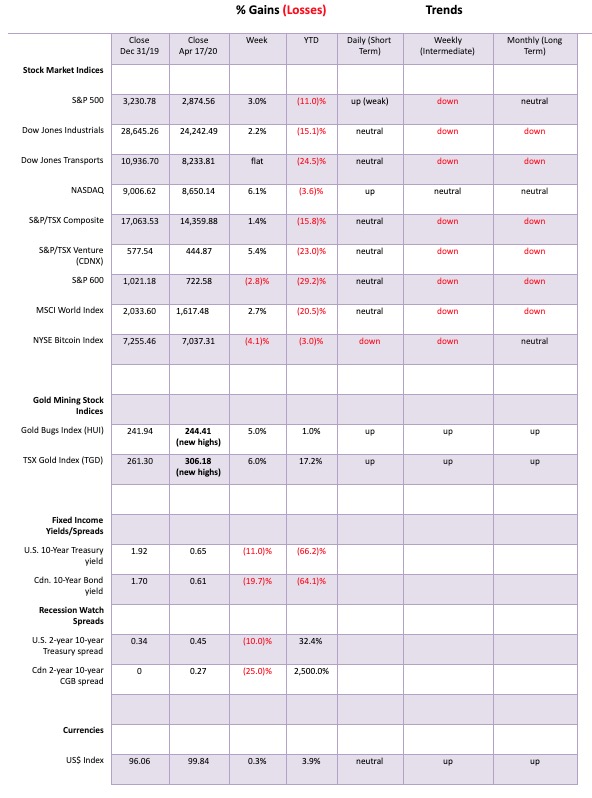
The stock market so far is ignoring it. The S&P 500 gained 3.0% this past week, the Dow Jones Industrials (DJI) was up 2.2%, and the NASDAQ jumped 6.1%. However, the Dow Jones Transportations (DJT) was actually down a small 0.04% or essentially flat. The S&P 600 (small cap) diverged, losing 2.8%. In a major rally you want the small cap stocks leading. The S&P 600 is still down over 29% on the year. Here in Canada the TSX Composite was up 1.4% and the TSX Venture Index (CDNX) gained 5.4%. Bitcoin fell 4.1%.
Overseas, the MSCI World Index was up 2.7%, the London FTSE lost 1.6%, the Paris CAC 40 was up 1.3%, the German DAX up 2.7%, the Shanghai Index (SSEC) rose 0.8%, but the Tokyo Nikkei Dow (TKN) lost 0.3%.
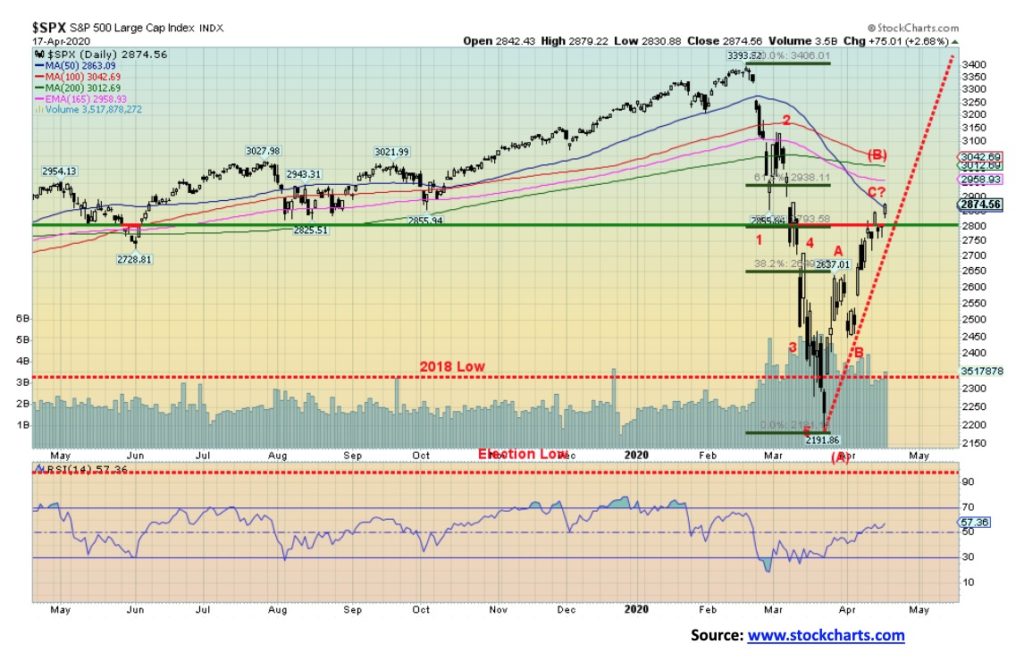
The S&P 500 has rallied into the 50-day MA. We count five wave downs from the February top to the March low. We label that the (A) wave down. The rebound so far appears as an ABC corrective wave which, when complete, should be the (B) wave up. To follow should be the (C) wave down. That would complete what we believe will be ((A)) wave of what could be a larger ((A)), ((B)), ((C)) multi-year correction. The steep upward correction breaks its trendline at 2,760 on Monday. Under 2700 would most likely start to confirm a top but we really need to wait for a break under 2,450 to absolutely confirm the top. Resistance on the S&P 500 is up to 3,000 and, over 3,110, odds favour new highs. The DJI over 26,900 could see new highs. We have to get over 24,700 to suggest to us that we could make an attempt to reach 26,900. There is a possibility of seeing new highs in the markets but we don’t believe that will happen until the ((B)) wave we note above. The NASDAQ rallied right up to its 100-day MA but left a hanging man candlestick on the chart on Friday, signaling a possible top. The hanging man candlestick pattern is a type of bearish reversal pattern. If we are correct on this, we should start to see the markets pull back this coming week.
U.S. retail sales plunged 8.7% month-over-month in March. It was a record. It followed a downwardly revised 0.4% drop in February. The market had expected an 8% drop. The expectation now is that April will be even worse. Year-over-year retail sales are now down 6.2%.
Few were spared. Clothing was the biggest loser, down 50.5%. But others also took big hits. Furniture was down 26.8%, food services and drinking (i.e., bars and restaurants) down 26.5%, motor vehicles down 25.6%, sporting goods, hobby, musical instruments, book stores, down 23.3%, gasoline stations down 17.2%, electronics and appliances down 15.1% and miscellaneous (whatever that is) down 14.3%. To close this on a positive note, food and beverages (i.e., grocery stores) was up 25.6%. Health and personal care also gained up 4.3% which was the best on record.
This was for the U.S. We expect Canada’s numbers to be just as dismal, although we won’t see the March numbers until May as Canada is usually a month behind.
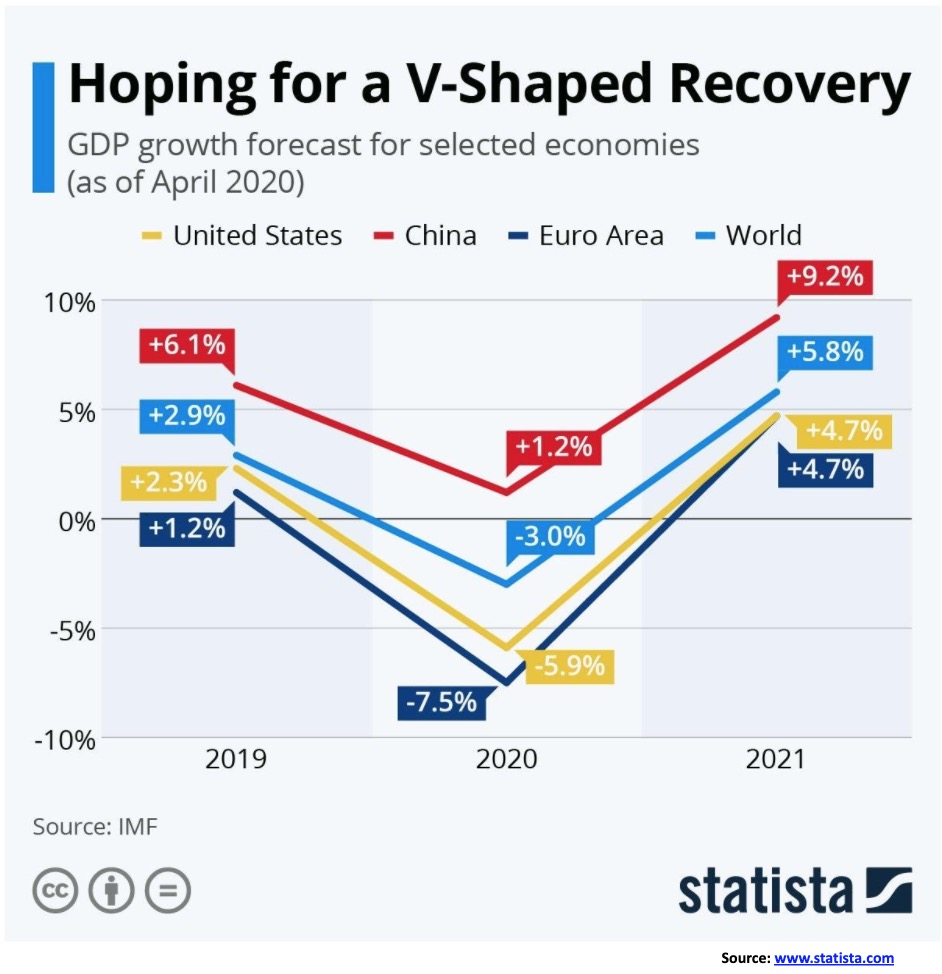
The IMF is clearly hoping for a V-shaped recovery. Suffering now for a joy later. These are annual drops. The assumption is that Q1 will be bad, Q2 really bad but once the lockdowns are lifted then things start to improve quickly as businesses re-open, and people are hired back. Or, better still, that a vaccine is found. But will it? And, in the interim, how many businesses will just shut their doors for good? Obviously, that is an unknown or is it an unknown, unknown. And, if lockdowns are lifted but the number of cases and deaths continues even at the current pace, will they lock down once again? Again, we don’t know.
As China is already discovering, people are not just rushing out to resume everything as it was before. Rather than spend they are sitting on their cash. Supply chains are broken. Even in North America with supply chains broken or seriously frayed, restarting the supply chain locally is not just a simple case of popping up a tent. What if they discover that demand doesn’t come back the way it was? Or that people got used to not buying? Many retail stores may well disappear leaving a big hole in malls, especially if people turn inward and get used to ordering everything online or take out at the restaurant.
Obviously, a V-shaped recovery is better than the worst case—an L-shaped recovery. Or it could be the U-shaped or a W-shaped recovery, meaning a quick recovery followed by another plunge. During the 1918–1920 Spanish flu, things initially continued somewhat normally. The flu seemed to fade but then came back with a vengeance. Workers didn’t have the protections they have today and companies viewed workers as just so many widgets, disposable widgets. Initially there was a recession, then a rebound followed by a deep depression that lasted until mid-1921. The depression was steep but short-lived. It was followed by the “Roaring Twenties” that, oddly, saw a couple of mild recessions along the way. It ended abruptly in 1929 with the start of the Great Depression.
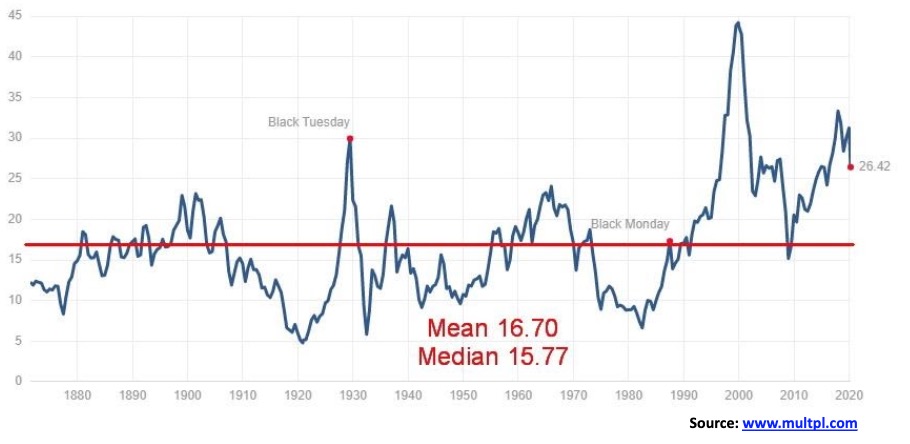
Despite the recent fall in the market, the Shiller PE ratio remains at elevated levels. The long-term mean is at 16.70 while the median is at 15.77. At 26.42 it remains well above both but it is off the high. Even during the 2008 financial crisis, the PE ratio pulled back to the mean before rising again. This PE ratio actually peaked way back in 1999 at the height of the high-tech bubble. It was considerably lower by the time of the 2008 financial collapse. It eventually pulled back to the mean in 2009. This time the PE ratio reached higher levels than it did during the housing bubble. So, it has much further to fall to get back to the mean. Of course, the bulls will tell you we are in a new era and high PEs are the now the norm. Maybe they are right. But historically they have been proven wrong. The current PE mean is a result of the high levels seen during the 1990s and what has persisted since. With the world and especially the U.S. experiencing years of easy money, QE and unprecedented debt accumulation the stock markets have been pushed into the stratosphere. Have high PE valuations become the norm?
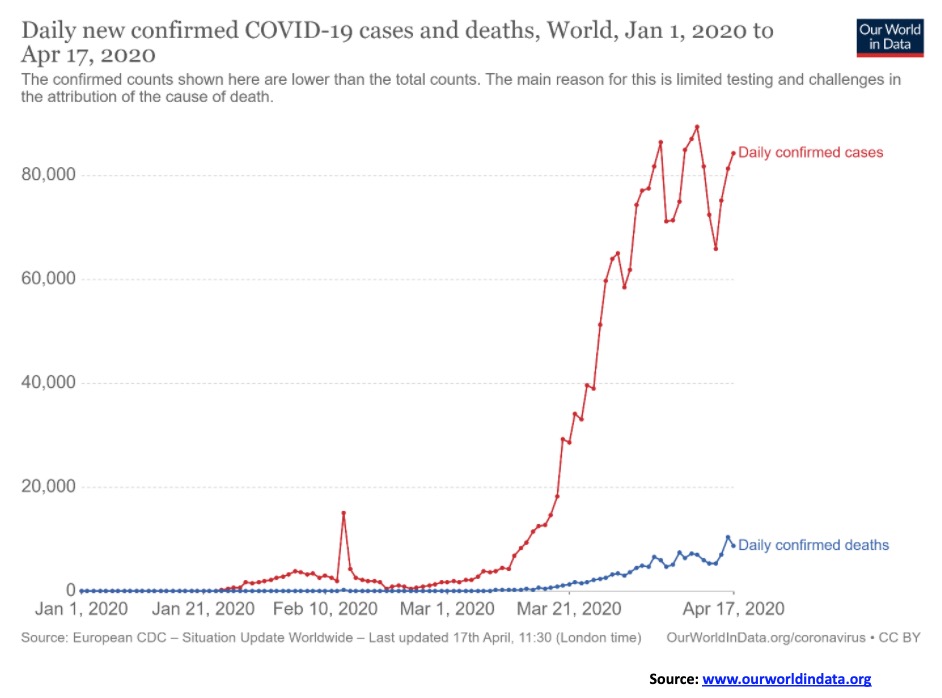
Here is a chart of the worldwide confirmed cases of COVID-19. The first cases were reported on January 3 from Wuhan, China. But things didn’t begin to accelerate until late January and into February. There was a blip on February 13 and then it seemed to settle down again. But as the rest of the world caught the bug things started to rise in March. It hit an initial peak on April 5 at 86,479 cases. Then what we are calling a corrective ABC-type wave set in with a higher peak (B wave?) on April 11 with 89,849 cases. We pulled back but now we are rising again. Is this a new wave to the upside? Well, we don’t know. This chart is being used as evidence that we are flattening. Flattening maybe, but at an elevated level. The death count peaked on April 16 at 10,355. Even during the 1918–1920 Spanish flu there was an initial surge followed by a period when it appeared to be abating, only to return with a vengeance.
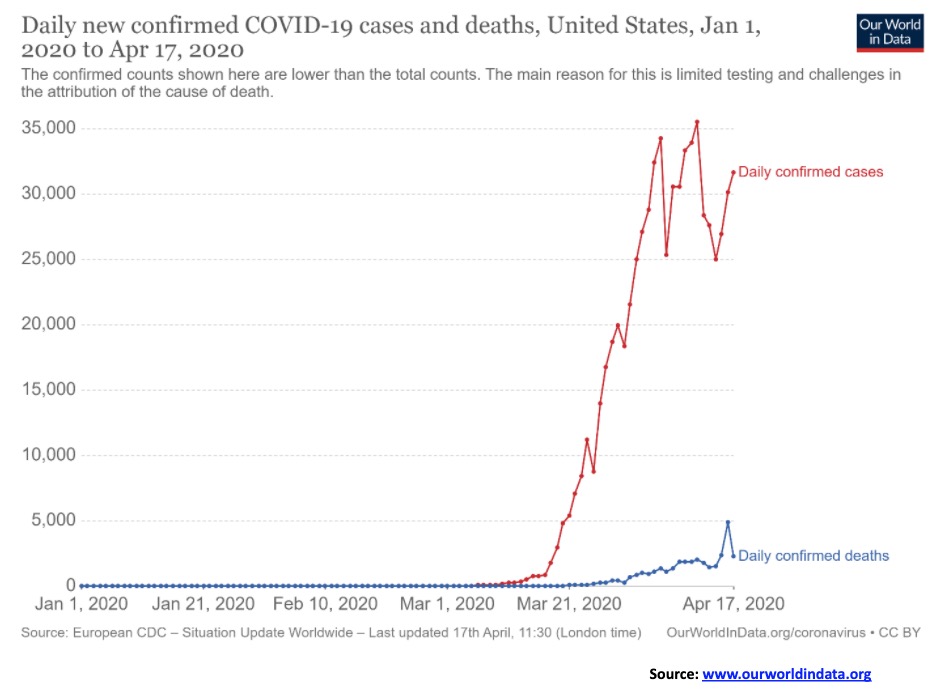
Has the U.S. curve flattened? Well, who knows? It has certainly bounced around over the past few weeks after rising from almost nothing in January and February to an initial peak of 34,272 on April 5. Putting on our Elliot wave hat, we see five waves up to that April 5 peak followed by what may be an ABC-type correction. The daily cases have started to rise again but have not yet taken out the absolute peak (B wave) seen on April 11 of 35,527 cases. Deaths didn’t peak until April 16 at 4,928. Yet, based on this chart, Trump wants the economy opened again. And what happens when the number of cases takes out that April 11 high? Okay, we can’t answer that question. But the U.S. has become number 1 in cases and number 1 in deaths. No one else is even close.
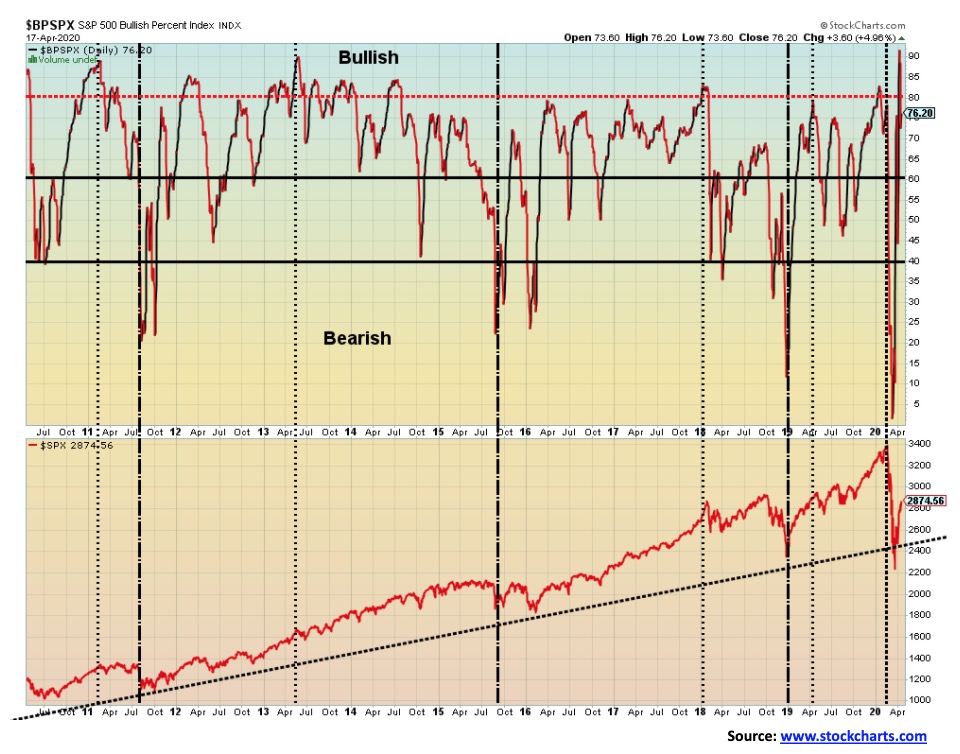
If we were truly entering a bull market, then we would not want to see the S&P 500 Bullish Percent Index (BPSPX) trading at 76.20. Indeed, on April 9 it hit an unheard of high at 91.60. What does all of this tell us? That the market has become too bullish too fast. To climb that proverbial “wall of worry,” we’d prefer to see the indicator stay under 80, preferably between 60 to 80. Note that as we came out of the 2018 drop into December the BPSPX bounced back and forth between 45 and 80 but never once did it climb over 80, not until January 2020 when it hit 82. But this one shot right up to 91 from the deep after it hit a depressed level of 3 on March 17. From super-bearish to super-bullish in a heartbeat. Of course, the Fed flooding the system with money from heaven played a big role in that. That didn’t occur after the December 2018 low.
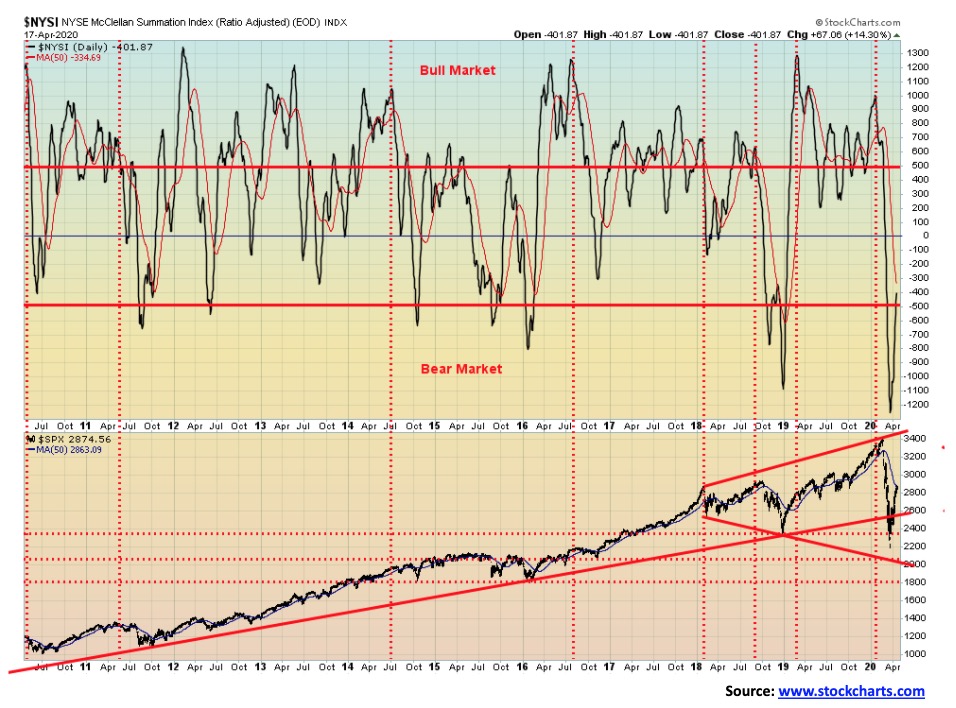
Here is another reason we are not so convinced that we are about to embark on a significant bull market. The McClellan Summation Index Ratio Adjusted (RASI is barely up to -400. While that is slightly above our cut-off point for a bear market at -500 it is nowhere near bull market territory above +500. If anything, we are probably at a point where this market could once again turn down. To even get this market back to neutral, the RASI needs to be at zero or better.
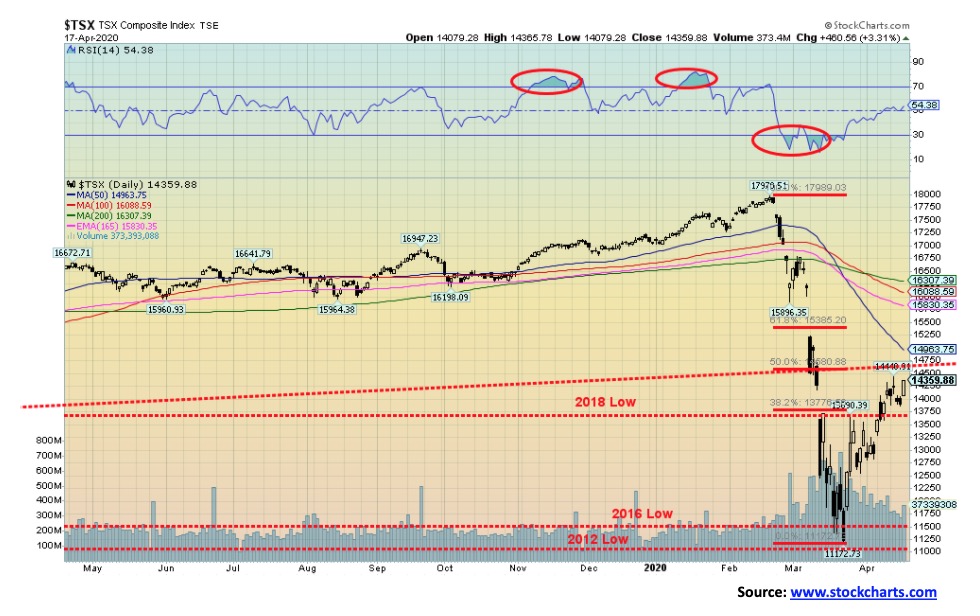
The TSX Composite rose this past week, but it was a struggle compared to the U.S. indices. Not all boats were pulling their weight. The TSX Composite was up 1.4% on the week but the sub-indices saw a mixture of gains and losses. Six of the fourteen sub-indices suffered losses during the week, led by Energy (TEN) down 4.1%. Financials (TFS) which are the largest component of the TSX fell 3.6%. Banks are increasing their loan loss provisions as the economy tips into recession or worse. Other losers included Income Trusts (TCM) down 1.8%, Health Care (THC) down 1.8%, Real Estate (TRE) down 3.2% (that should be no surprise given that companies are defaulting on their rent, the malls are empty, and the housing market could crash) and Utilities (TUT) off 0.6%. Leading the way to the upside were Golds (TGD) +6.0%, while Consumer Discretionary (TCD) +4.3%, Consumer Staples (TCS) +5.3%, Industrials (TIN) +1.0%, Materials (TMT) +5.1%, Telecommunications (TTS) +1.6%, Metals & Mining (TGM) +3.8% and the really big winner Information Technology (TIT) jumped at big 16.7% all helped keep the TSX in the black. We believe Golds, Materials, Metals, Info Tech and Consumer Staples should be beneficiaries in this market.
The TSX is hitting into a zone of resistance up to 14,700. The 50-day MA is up at 14,960. The TSX Is approaching the 50% retracement level for the entire collapse. A move back below 13,750 would suggest to us that a top may be in. Below 12,500 new lows are possible.
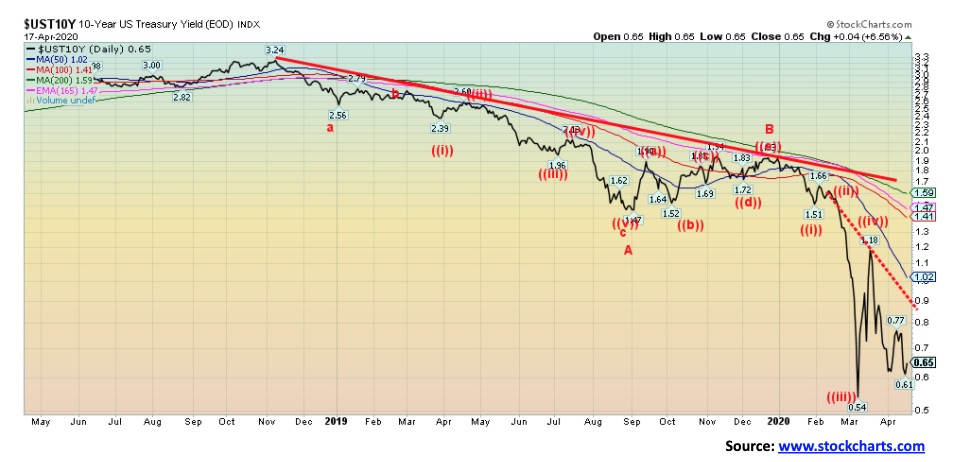
U.S. treasuries benefitted from the dovish comments of Fed officials who continue to see risks for the economy into year-end. Helping steady rates was the Fed announcing that systemic risks have eased and they will reduce their bond purchases from $30 billion/day to $15 billion/day. We are not sure we are going to see new lows for the 10-year U.S. treasury note. Upward pressure could be seen because of the huge budget deficits that currently look to be around $2 trillion (10% of GDP) but some believe could rise to $4 trillion (40% of GDP and an unheard-of amount). April leading indicators were dismal, falling 6.0% year over year while China’s industrial production fell 1.1% year over year along with the contraction in its GDP of 6.8% year over year. Chinese retail sales were also down 15.8% y/y while U.S. retail sales were down 6.2% y/y. All of these things were dovish for U.S. treasuries. The closely watched 2–10 spread also fell this past week to 45 bp. However, now that a recession is underway, we don’t need to follow that as closely because the spread did its job earlier of predicting the recession. The Canadian 10-year Government of Canada bond (CGBs) fell to 0.61% this past week, down from 0.76% the previous week. The Canadian economy, like everyone else, is going into economic meltdown and the BofC has taken the unprecedented tactic of starting their own QE program, something they had never done before.
A break above 1% could send the 10-year up to major resistance near 1.40% to 1.60%. At this time, we doubt we will see new lows below 0.54%. There is too much pressure with the need for bond issues, irrespective of how much the Fed will buy.
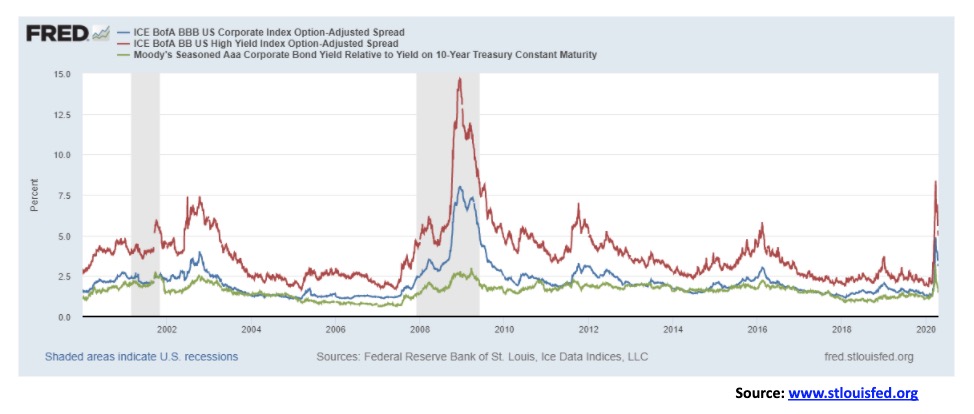
Spreads on corporate bonds to the U.S. 10-year treasury note continued to ease this past week as the stock market rallied and fears of systemic defaults eased. As well, with the Fed buying all sorts of corporate bonds it also eased things a bit. The Aaa-rated bonds have slipped to 1.74% over vs. 3.20% at the recent high, BBB-rated bonds, the lowest investment grade, slipped to 3.10% over vs. 4.88% over and finally BB corporate bonds, the highest ranked junk bond status, slipped to 5.24% from 8.37%. None of this takes the pressure off the corporate bond market that remains a potential disaster zone. But nothing goes straight up. We note that, even during the 2008 financial crisis, there was a period when the spreads pulled back before soaring once again.
None of that means the pressure on the U.S. corporate bond market is over. The vast majority of bonds outstanding are ranked BBB and lower. The reality is that with the economy slowing (crashing?), corporations are burning through cash in an attempt to stay alive and even taking on new debt. Not a good recipe. Any loans they are getting through the government to stay alive are loans, not grants.
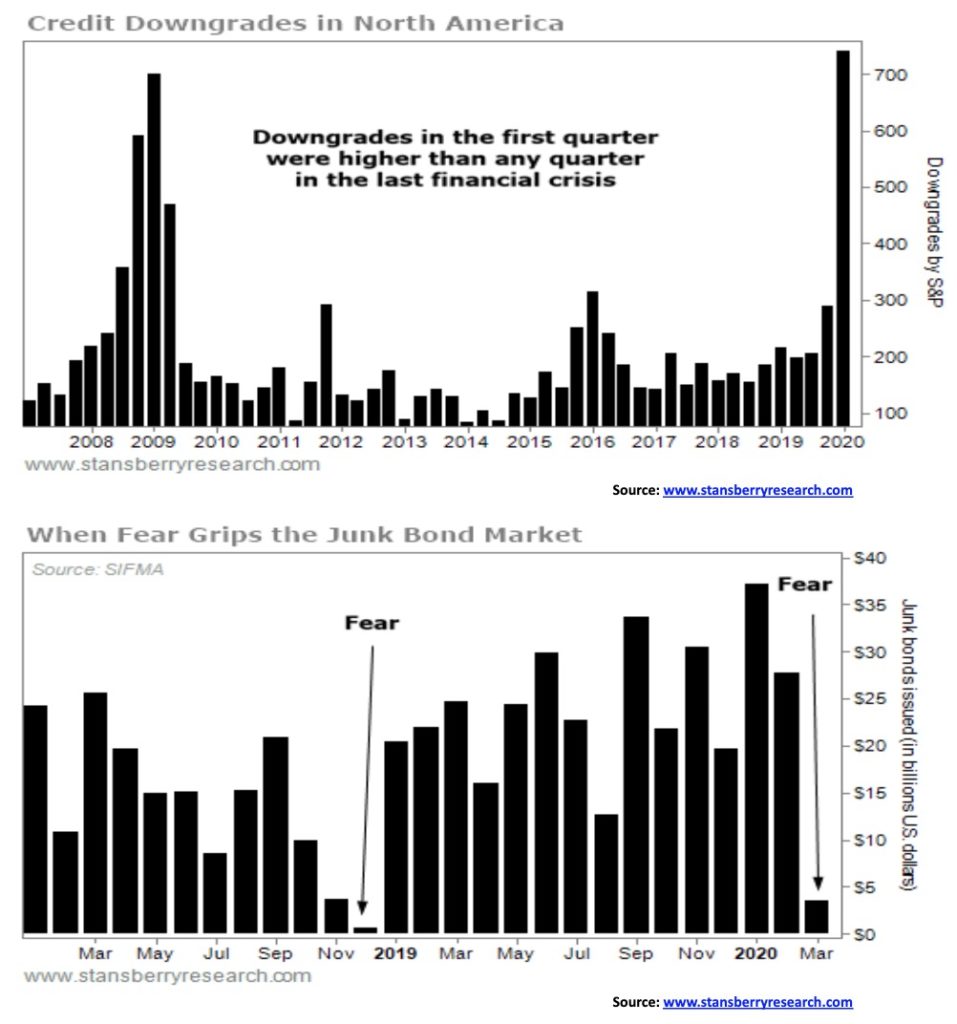
Our chart on the next page shows that corporate downgrades are as high as they have ever been. In the first quarter, S&P downgraded 739 companies. That was actually more than during any quarter of the 2008 financial crisis. In April alone, S&P downgraded 387 companies. That makes 1,126 so far this year. At the peak during the 2008 financial crisis they downgraded only 1,500 companies. If the current pace is maintained, one could see 3,700 this year. Downgrades lead to defaults and the Fed can’t bail out everybody. Does anyone in their right mind want to buy Carnival (cruise lines) debt? The second chart below shows what Stansberry Research is calling the Fear Index. It shows the number of junk bonds issued each month. The lower the number shows fewer buyers of junk bonds. Even the Fed has indicated they can’t bail out junk companies.
At the peak in 2008 the BB-rated bonds reached 13.96% and the really high-yield junk reached 22.00%.
There is a similar problem in Canada and, no, the BofC will not bail them all out.
The US$ Index rose 0.3% this past week but faded by week’s end as the U.S. stock market rallied. U.S. stocks were buoyed by thoughts of progress for a vaccine and a re-opening of the U.S. economy. But the Fed is putting some damper on that as they continue to see weakness into year end for the U.S. and global economy. The sharp rally in U.S. stocks has helped ease concerns about a liquidity problem for U.S. dollars. The result: a fade in the US$ Index by end of week. Still, the performance against other currencies was mixed as the euro fell 0.4%, the Swiss franc was off 0.1%, and the Canadian dollar dropped 0.6%. Gaining were the pound sterling, up about 0.4%, and the Japanese yen, up 0.9%. The euro continues to have problems as Brussels wants serious help for beleaguered economies such as Italy and Spain; however, there is considerable unwillingness of Germany and the Netherlands to finance it. The eurozone remains in a mess as the members squabble amongst themselves. The rise of right-wing parties threatens stability and may even lead to exits from the EU. The EU banks remain zombies. EU global trade has plummeted by at least 10% and car registrations have collapsed by roughly 55%. The pound sterling rose because of thoughts that the U.K. might soon re-open its economy.
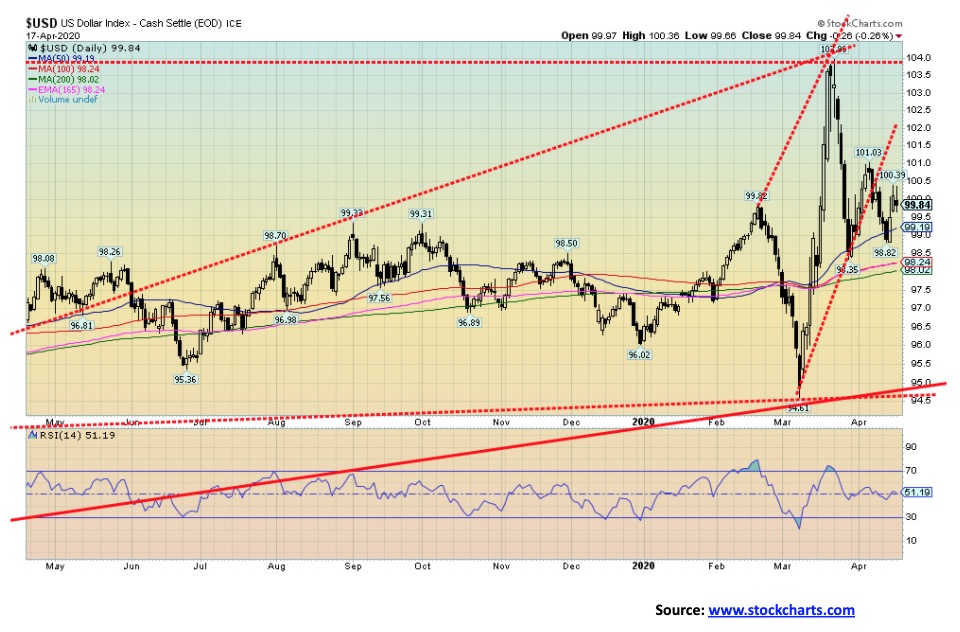
The US$ Index remains below recent highs and once again it raises the spectre that the top may have been seen near 104. This week’s rebound remains below the recent high at 101. The breakdown zone remains at 98 with the major breakdown zone at 94.50.
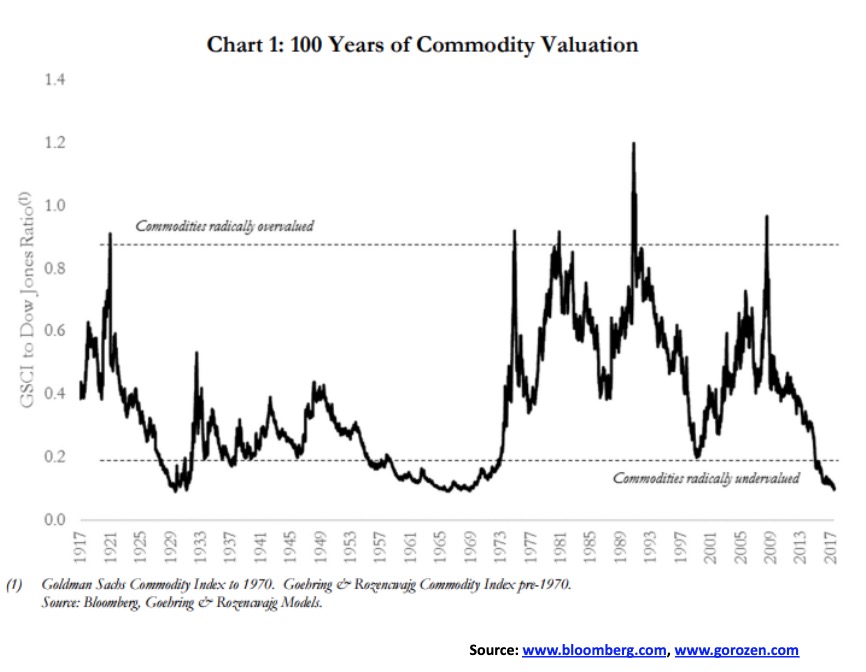
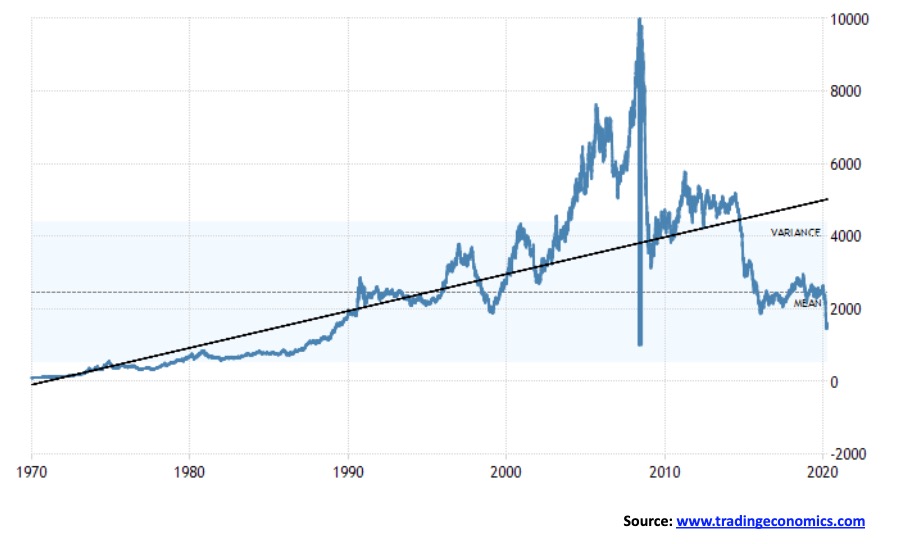
The above chart actually dates from 2017 but the conclusion is still the same. Commodities are grossly undervalued when measured against the stock market. According to this chart and actually confirmed by the one shown on the next page, commodity prices are acting like they were in the Great Depression. The simple fact is, when commodities are this cheap relative to stocks, the patient investor is going to enjoy a “ride” as the tide shifts in favour of commodities. For the most part, investors are ignoring commodities. No wonder three of the worst performers on the TSX have been Materials, Metals & Mining, and Golds. When the tide turns, investors will be unprepared. Even at the depths of the Great Depression, commodities outperformed as the chart above shows with the ratio rising into the mid-1930s, suggesting that as the stock market collapsed commodities were rising. It was mostly because shortages developed. The long slump of the 1950s and 1960s was followed by the commodity boom of the 1970s. The final top came with the peaks in 2008–2011. After that it has been a long fall and once again commodities are grossly undervalued. We can recall coming into this market in the late 1990s when the go-to place was high tech. However, we confess we didn’t know much about high tech so we were a little reluctant to get involved. Instead, we noted the huge undervaluation in the commodity sector. So, we bought Teck Resources and Barrick Gold and ignored Nortel. Commodities boomed from roughly 2000 to 2011. Once again, they are grossly undervalued.
And finally, here is a way to play the potential trade.
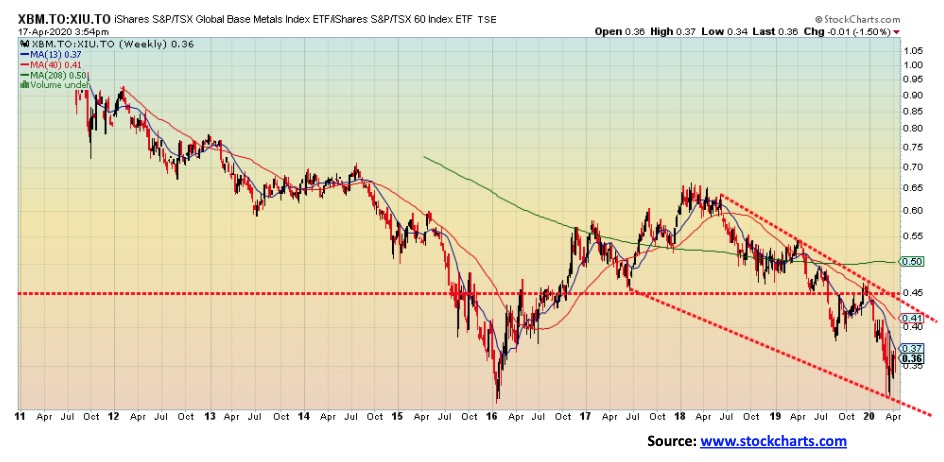
The chart is the ratio between the iShares Global Base Metals Index ETF (XBM) and the iShares TSX 60 Index ETF (XIU). A falling ratio means XIU is outperforming while a rising ratio tells us the XBM is outperforming. A possible multi-year double bottom with a neckline up around 0.60. A break of the peak at 0.66 could suggest a rise to 1.00. A comparable U.S. one is using the SPDR S&P Metals & Mining ETF (XME) and the SPDR S&P 500 ETF (SPY). These plays are merely a suggestion as to how the coming commodity boom could be played.
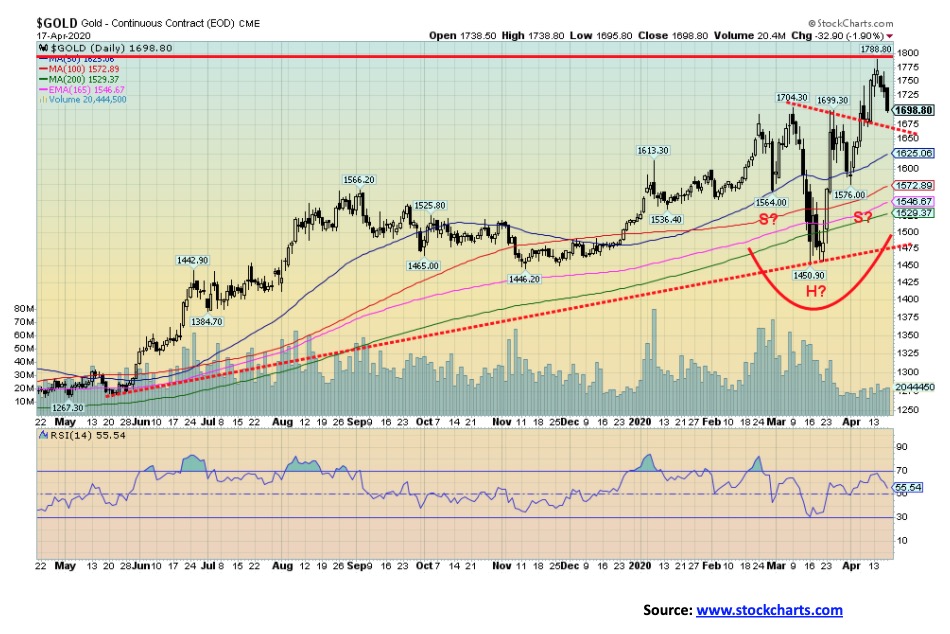
Gold fell this past week as investors pivoted back to stocks on hopes for a reopening of the economy and a vaccine that might work. It curbed the safe haven aspect of gold. As was expected, gold also ran into resistance up near $1,800. The 2012 high was seen at $1,798 and it was highly suspected that the zone could act as initial resistance. Gold made new 52-week highs at $1,788, then reversed and closed lower, down 3.1% on the week. A reversal week after making new 52-week highs signals that we are most likely in for a period of consolidation that could carry us into May and even into July. Typically, gold has been seasonally weak during that period. Even during the sharp run-up from December 2015 to the high in July 2016, gold initially topped in March, fell into the end of March, and then rose again to higher highs in May before falling back once again for a low in early June. Then the market made its final run into July that proved to be the high for the year. Seasonal patterns show gold making its first low in March, rise into April, pullback into June, rise again into July then fall back once again into August before making a strong run into September/October, and then declining into year-end before starting the up cycle once again.
Key areas below are seen first at a test of the neckline of what may be a head and shoulders bottom at $1,670. The head and shoulders pattern busts if gold falls back below $1,575. Otherwise, the head and shoulders pattern remains intact with potential targets up to $1,950. We could still see that happen as long as gold holds above $1,575 and preferably holds above $1,625. As noted, the shift this past week into risk assets in the stock market hurt gold. And that is despite unprecedented demand for coins and bars, mints being shut, and even mines being shut in some production because of the COVID-19. Premiums seen at Silver Gold Bull for coins are US$220 and Cdn$310 to spot or roughly 13%.
Gold should continue to benefit from the very dovish central banks providing trillions to the economies with direct injections and massive QE. Low bond yields also help gold along with low inflation and ongoing fund buying with long positions for ETFs in both gold and silver. Geopolitical tensions also continue to play a role, given the ongoing sabre-rattling with Iran and North Korea and the ongoing tensions between the U.S. and China on trade, particularly their blame game for the COVID-19 crisis. There have been record flows into precious metals ETFs, including the SPDR Gold Shares (GLD) and the iShares Silver (SLV). Silver continues to suffer with its association as an industrial metal.
On a positive note, platinum prices rose this past week, gaining almost 6%, and palladium was up 1.7%. Copper prices were also slightly firmer, up 3.5%.
Given the still-negative gold commercial COT, we wonder whether the bullion banks helped push gold lower this past week to set up another round of them covering shorts. We’ll see if there is follow-through to the downside in next week’s COT report. But we may have seen a high for the next little while as gold consolidates its recent gains. Gold is up 17% from its March low, although at the recent high it was up 23%. Gold remains up 11.5% on the year, leading the way as stocks represented by the S&P 500 remain down on the year by 11.0%.
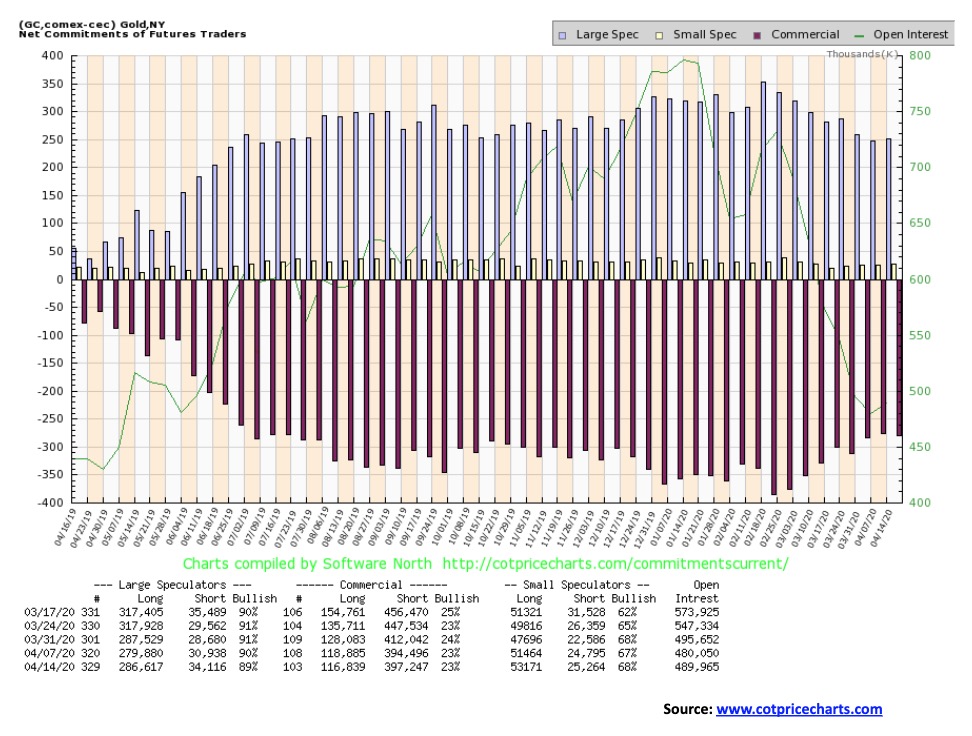
The gold commercial COT was largely unchanged this past week at 23%. Long open interest fell about 2,000 contracts while short open interest rose about 3,000 contracts. The large speculators COT (hedge funds, managed futures, etc.) slipped slightly to 89% from 90%. Long open interest jumped almost 7,000 contracts while short open interest rose over 3,000 contracts. The rise in open interest was the first in more than a few weeks. We still view the COT as bearish.
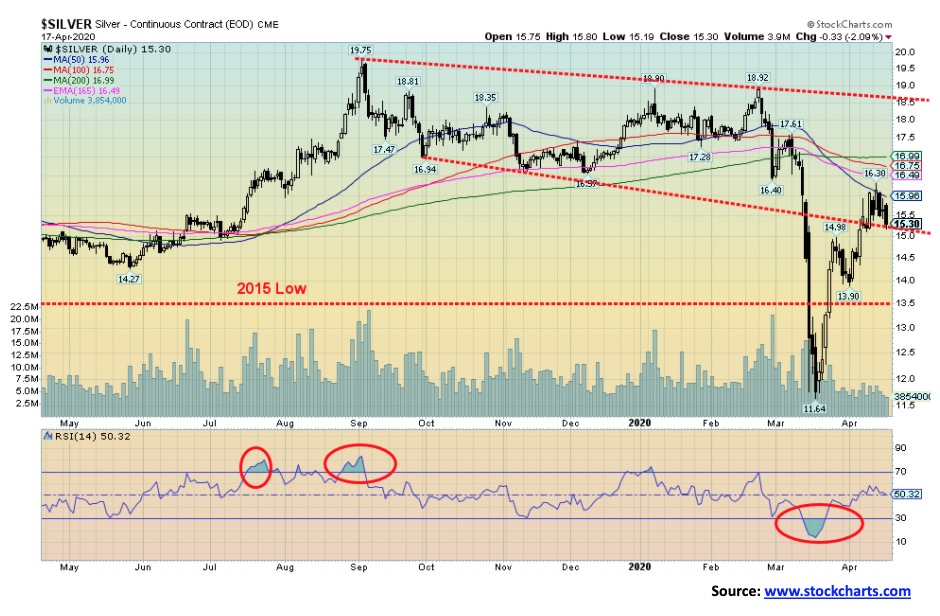
Silver, like gold, slipped this past week, falling back below $16, losing 4.7%. Silver continues to get lumped in as an industrial metal rather than as gold’s junior partner. The gold/silver ratio remains elevated at almost 111. Historically, when the gold/silver ratio is very high, it usually turns out to be good for both gold and silver and they rally. So far, so good, but the ratio hasn’t fallen much yet. To get it down to a more reasonable level, even at a 70-ratio silver would have to be $24. Silver ran into a band of resistance starting at around $16 up to $16.50. At the recent high of $16.30 silver was actually up 40% from its March low of $11.64. Silver is being driven higher by the unprecedented demand for coins and bars and the fact that many mints have stopped production, some mines are shut in due to the COVID-19, and there appear to be problems on the COMEX for deliveries. But sharply higher margins are hurting silver along with its treatment as an industrial metal. We note that silver coins at Silver Gold Bull are trading at a premium of US$9 and Cdn$13 to spot respectively. The high premiums are making some hesitate in buying. Silver was also hurt this week with the risk-on trade as investors flipped back into stocks. As we noted with gold, even if the stock market should start to tumble once again, both gold and silver may also take a tumble as anything is sold to get cash. Because of the sharp rise we note that silver could trade back towards $14 and still not break anything, even as it has broken the steep uptrend line from the March low. Below $13.90, however, silver could fall further to test the March low. Most likely, like gold, silver could go through a consolidation period that could last into May or even as late as July before resuming the uptrend.
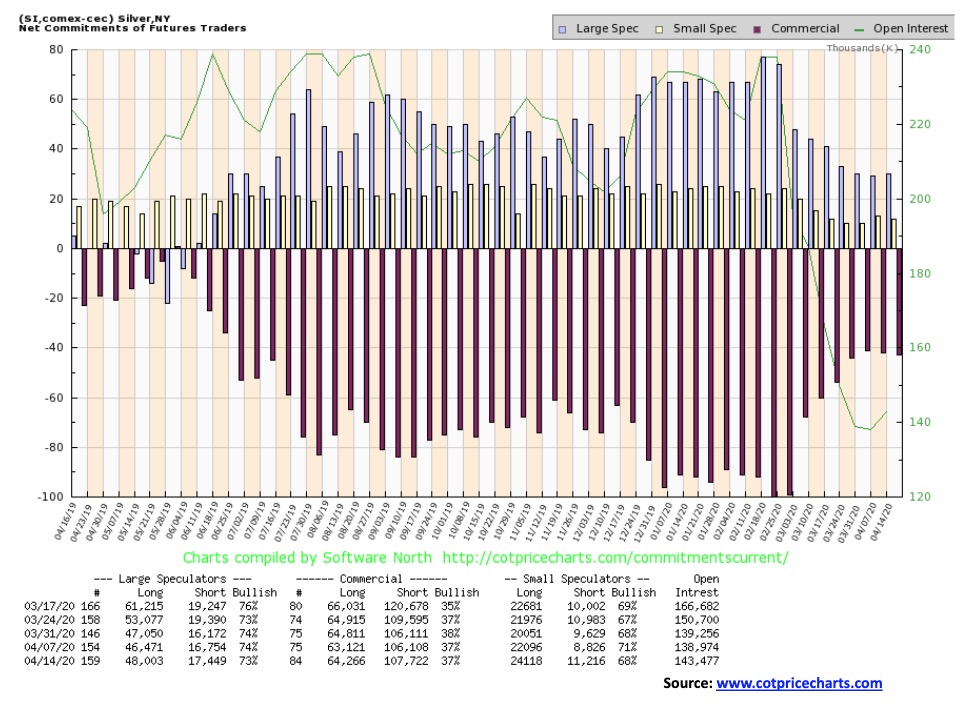
Like the gold commercial COT, the silver commercial COT was unchanged on the week at 37%. There was little movement in open interest as both long and short open interest rose roughly 1,000 contracts with short open interest up a bit more. There is not much to read into this week’s silver COT. At 37% it is kind of neutral. Not high enough to be outright bullish but not low enough to be outright bearish.
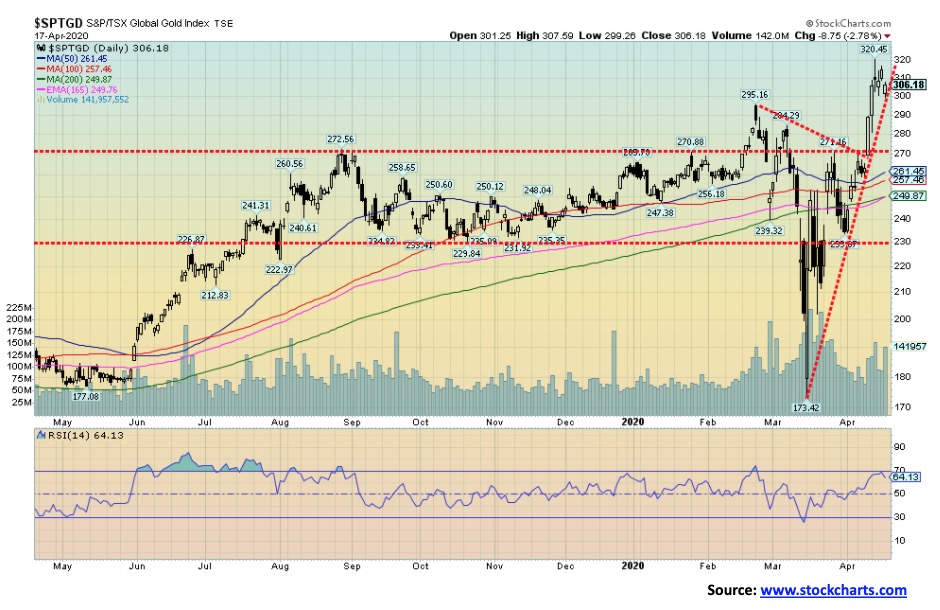
The gold stocks, as represented by the TSX Gold Index (TGD) and the Gold Bugs Index (HUI), made new 52-week highs this past week. The TGD gained 6.0% while the HUI was up 5.0%. This was against the backdrop of both gold and silver falling on the week. A divergence. The TGD appears poised to break the sharp uptrend line from the March low. A break of 300 could send the index tumbling to test the breakout line near 270. That would be a 15% correction from the high. Corrections of that magnitude are not unusual for the gold stocks. The TGD is up almost 77% from the spike March 2020 low. The breakout above 270 suggested that the TGD might have targets up to 390. A pullback now doesn’t mean that the target is now invalid. Pullbacks, sometimes sharp ones, are not unusual for the gold stocks. It’s a small market, so buys and sells can move the market around quite rapidly. A breakdown under 250 we would view as quite negative and suggest this up move is over. Under 230 would seal it. So as long as we can hold above 270, we believe the market should regroup. RSI reached just under 70 on this move so it was not at a level that would have sent warning signs to us suggesting a top was imminent. Regaining above 315 would suggest new highs. The rise has been quite steep, so a pause here would not break the uptrend, just delay it.
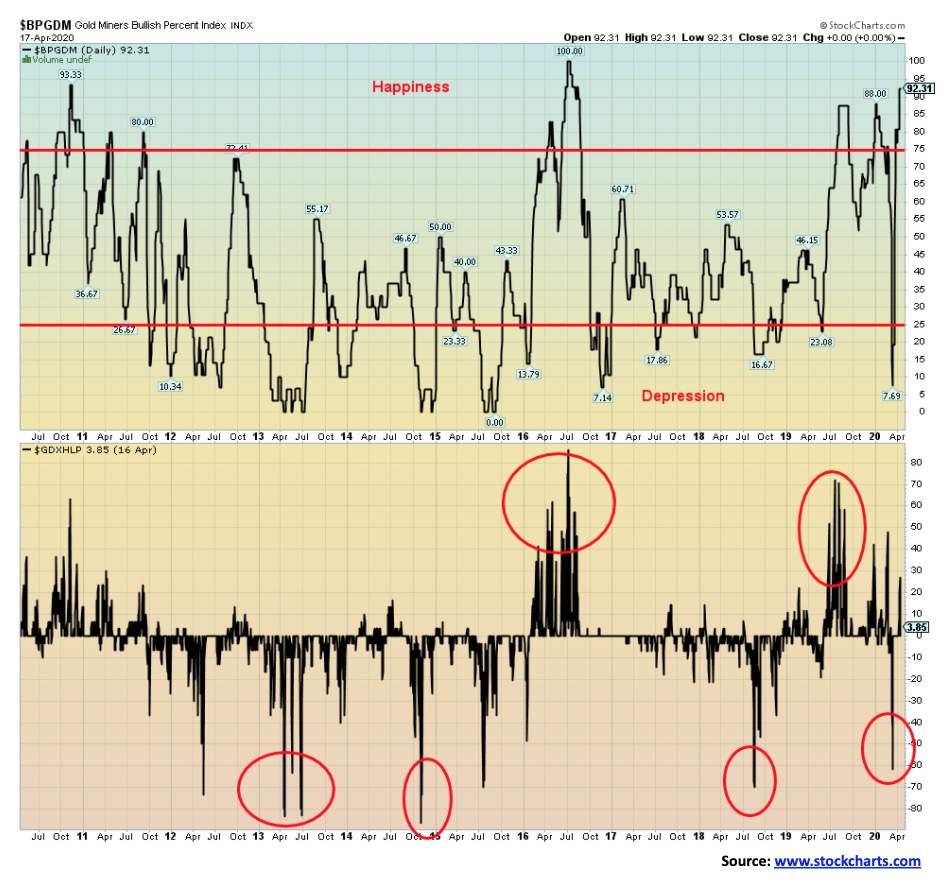
Are the gold stocks making a short-term top? The Gold Miners Bullish Percent Index (BPGDM) hit 92.31 this past week as both the HUI and the TGD made new 52-week highs. This is the highest level seen since the index hit 100 back in July 2016. That proved to be the top for the next few years. In a divergence the Gold Miners New Highs – New Lows Index (GDXHLP) is nowhere near its previous highs. Usually the two make tops and bottoms together. Nonetheless, the BPGDM is suggesting that investors might want to exercise some caution and look at some profit-taking, especially given that gold and silver both sold off this past week, even as the gold stocks made new highs and put in another positive week.
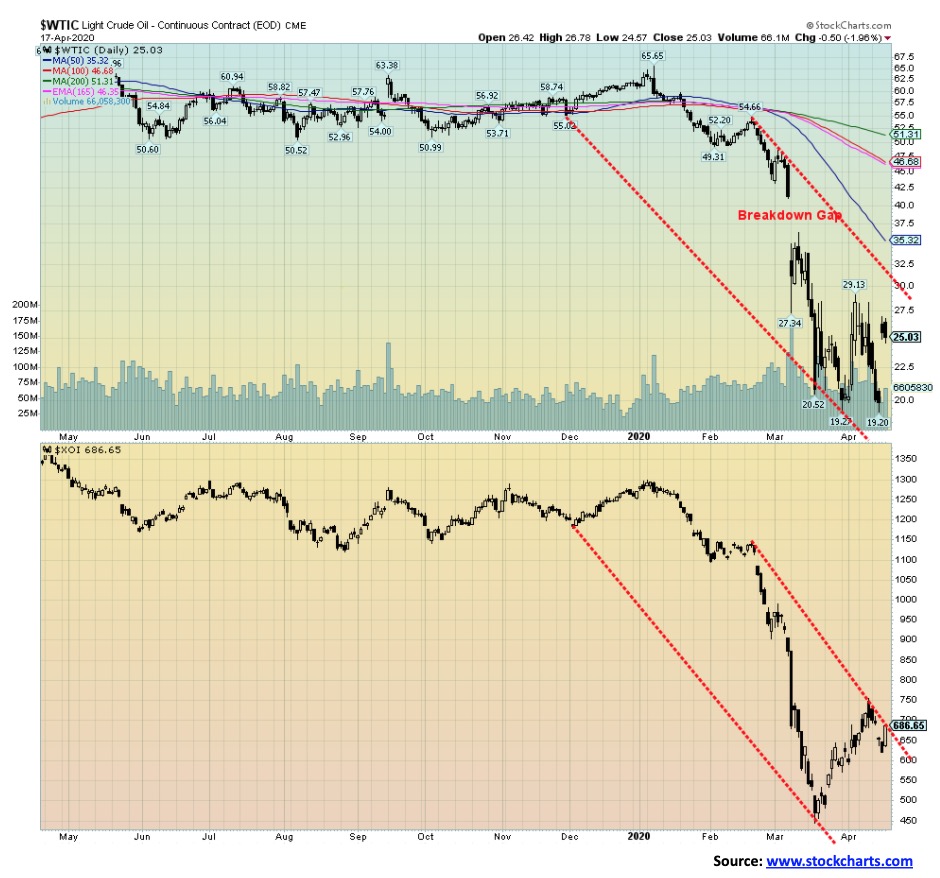
A huge gap has opened between cash WTI Oil and what is now front month June futures. Shown above is front month June futures. It closed at $25.03 on Friday. Cash WTI oil closed at $18.15 and the May futures closed slightly higher at $18.27. Why the huge difference? Cash oil, and the May oil are both reflecting the huge glut of oil with growing inventories, dwindling demand, and dwindling storage capacity. June futures are $7 higher because of the expectations being built into the possible opening of the economy. If that should fail or at the least appear delayed, June futures could crash right back down again.
Demand destruction is killing oil. A cut of 9.7 million bpd doesn’t cut it when demand has fallen 30 million bpd. China alone is seeing demand drop by upwards of 250,000 bpd. It also doesn’t help that China’s GDP crashed 6.8% year over year in March, the first drop since 1967. Other economic data was also not helpful for crude demand.
Layoffs are hitting the oil sector like a ton of bricks. Others continue to shut in wells. Banks are now setting aside billions for expected loan losses in the sector, both here in Canada and in the U.S., especially for the U.S. shale sector. Adding to the misery are signs that a megadrought is worsening across the U.S. west, raising the spectre of the 1930s dustbowls. Car sales are in sharp decline here in North America and the EU. Saudi Arabia apparently raised $7 billion in a debt issue. Not sure why anyone would lend it. The IEA said oil demand was down 29 million bpd in April. Even clean energy is being hit with job losses some 106 thousand in the U.S. alone.
While WTI crude is at $18.27 (May futures) we can’t help but note that Western Canada select is trading at negative $4.17. Yes, we did a double-take when we saw that. They are paying to have it taken away because they have nowhere to store it. North Sea Oil is $6 and Bakken oil are under $10. 4,600 Bakken wells are idle, shutting in 260,000 bpd. The Keystone pipeline is once again being blocked by environmentalists and Nigeria is reported to have 50 million barrels just floating around in the ocean because nobody wants it.
On a positive note the Government of Canada has committed $1.7 billion to employ workers to clean up orphan wells out west. That is something that should have been done by the companies but clearly that is not going to happen now.
Such is the state of the oil industry today.
—
(Featured image by Lorenzo from Pexels)
DISCLAIMER: This article was written by a third party contributor and does not reflect the opinion of Born2Invest, its management, staff or its associates. Please review our disclaimer for more information.
This article may include forward-looking statements. These forward-looking statements generally are identified by the words “believe,” “project,” “estimate,” “become,” “plan,” “will,” and similar expressions. These forward-looking statements involve known and unknown risks as well as uncertainties, including those discussed in the following cautionary statements and elsewhere in this article and on this site. Although the Company may believe that its expectations are based on reasonable assumptions, the actual results that the Company may achieve may differ materially from any forward-looking statements, which reflect the opinions of the management of the Company only as of the date hereof. Additionally, please make sure to read these important disclosures.


Abivax Shares Surge as New Trial Data Eases Safety Concerns Over Ulcerative Colitis Drug
Abivax shares surged nearly 36% after positive updated trial results for its ulcerative colitis drug obefazimod reassured investors following earlier...


El Dorado Raises $9M to Expand Cross-Border Fintech Platform
El Dorado, a Latin American fintech improving cross-border financial services, raised a $9 million Series A led by Paradigm with...


Bitcoin Stalls Near $60K as Strategy Moves, ETFs Outflow, and EU MiCA Rules Take Effect
Bitcoin hovers near $60,000 with ETF outflows, while Strategy boosts reserves, sells BTC, and raises dividends to reassure investors. Ethereum...


Cannabis Dominates Global Drug Use: Trends, Risks, and Shifting Markets
Cannabis remains the world’s most widely used illicit drug, with 256 million users in 2024, surpassing all others combined. Growth...


Italy Approves First Hydrogen-Powered Train for National Rail Network
ANSFISA has approved Italy’s first hydrogen-powered train, the Alstom HMU214, for use on the Brescia–Iseo–Edolo line. Capable of 140 km/h,...
 |
|
 |  |
 |
|
-

 Crowdfunding7 days ago
Ithaca: Climate Road Trip RPG on Climate Resistance
-

 Fintech2 weeks ago
Fintech and AI: Adoption Grows, but Profits Favor Agile Innovators
-

 Fintech5 days ago
PayPal’s Slowdown: From Fintech Leader to Low-Growth Dividend Stock
-

 Impact Investing1 week ago
Edison Accelerates Renewable Growth and ESG Impact in 2025