Markets
February 2024 CPI Rose by 0.4% and 3.2% from a Year Earlier
Are the stock markets topping? We had another big reversal day on March 8 and despite the market bouncing back it appears to be failing the March 8 high. Inflation numbers for the U.S. were out this past week and both the CPI and PPI were marginally higher than expected. Result fear of interest rates staying higher for longer creeped into the market.

First inflation was transitory. But it wasn’t. Then war broke out. Inflation leaped. Led by the Fed, the central banks started to jack up interest rates to contend with the rising inflation. The goal was to bring it back down again, to its target levels of around 2%. Except now inflation is proving to be stickier than they thought.
The February 2024 CPI rose by 0.4% and 3.2% from a year earlier. The CPI was mildly higher than expected. The core inflation rate (less food and energy) also rose by 0.4% and was 3.8% higher than a year earlier. Generally, gas prices rose and shelter (house prices and rent) also rose. All this despite higher mortgage rates.
CPI, Core CPI, Fed Funds, Real 10-Year Rate – 2000–2024
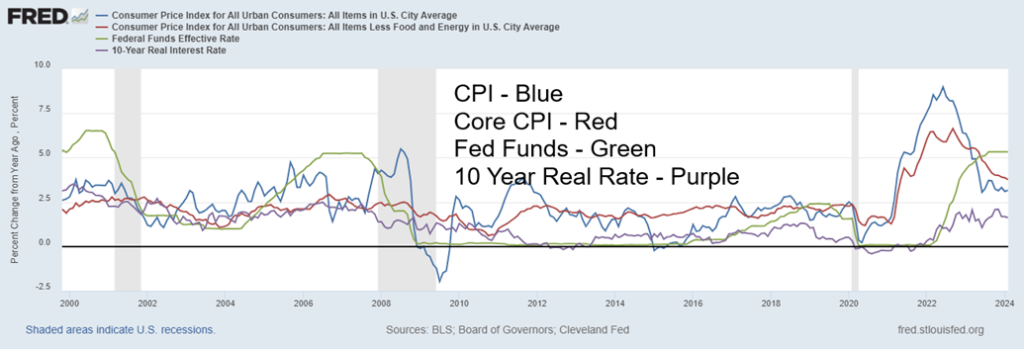
To add to the inflation woes, the Producer Price Index (PPI) came in above expectations. The expectation was a gain of 0.3% and 1.1% year-over-year (y-o-y). Instead, it was 0.6% and 1.6%. Core PPI was expected at 0.2% and y-o-y 1.9%. Instead, it was up 0.3% and 2.0%. Retail sales for February came in up 0.6% vs. the expected 0.5% and y-o-y retail sales were up 1.5% vs. the expected 1.0%. But if you strip out autos, it was up only 0.3% vs. the expected 0.4%.
It has already been agreed that the Fed won’t be lowering interest rates in March FOMC this coming week. Now the odds of a rate cut by June are also falling. All this despite Fed Chair Jerome Powell indicating he might be ready to cut by June. 2% is not 3.2%, even if that is down from the peak of almost 9% seen in June 2022. The Fed rate is above the rate of inflation as is the U.S. 10-year treasury note (last at 4.16%). The 10-year real rate is 1.61%.
As we and others have pointed out, the Fed is caught between a rock and a hard place. That is because of the federal debt, which now totals $34.5 trillion. Add in state and municipal debt and U.S. government debt soars to $38.2 trillion. That translates into a federal debt/GDP ratio of 123.5% or 129%, depending on who is calculating it, potentially adding upwards of $1.4 trillion in debt servicing costs every year at 4%.
The U.S. budgetary deficit, depending on how it’s calculated, is already at $1.7 trillion to $1.9 trillion. No, that is not the highest ever. That record belongs to 2020, the pandemic year, when it soared over $3 trillion.
Whether the U.S. is in recession or not may be moot. The concern is the debt and the U.S. has a lot of it. As we have noted, the U.S., with $97.9 trillion of debt when one adds in corporate and household debt, is the highest in the world, representing some 31% of all global debt. Is it sustainable? To the extent that the U.S. dollar remains the world’s reserve currency, the U.S. can effectively export its debt to others.
Central banks of the world are obligated to hold U.S. securities as a part of their reserves. Foreign holders of U.S. securities have $8.1 trillion up, from $7.3 trillion a year ago. Notably, China holds only $816 billion, down from $857 billion a year ago (as of December 31, 2023). High inflation also helps monetize the U.S. debt.
Intragovernmental departments (i.e. Social Security) hold some $7.8 trillion of U.S. securities. The Fed also holds U.S. securities and can act as lender of last resort. Nonetheless, the growing size is a significant concern. However, unless the Congress fails to pass spending or debt ceiling levels, the odds of a U.S. default are slim to none.
The current U.S. debt ceiling is $31.4 trillion. It is set to expire January 1, 2025, but Congress has consistently of late extended the time period it runs without actually raising the debt ceiling. It usually comes down to a game of chicken between Republicans and Democrats; however, they usually agree to extend it without actually doing anything in order to avoid a potentially catastrophic default that would have global implications.
But with the thought of a trillion dollar a year interest rate payment hanging over their heads, the pressure could be on the Fed to do something. And, by extension, the Bank of Canada, although Canada’s federal debt is nowhere near the levels of the U.S. While Canada is regularly listed as having a debt to GDP level of currently around 107%, that includes both federal and provincial debt. Canada’s federal debt to GDP stands, at around 54.3% according to Statistics Canada (www.statcan.gc.ca), the lowest in the G7.
None of this has stopped the stock market from soaring almost continually to new all-time highs. The stock market seemingly has little regard for interest rates, valuation, P/E ratios, domestic politics, or geopolitics. While the Magnificent Seven led the way up, even the recent faltering of some of the seven (Tesla, Apple) seems to have had little effect. As we saw with the dot.com/high-tech rally of the late 1990s, the dream of great things from AI overrides everything else, even profits. The market goes higher on thoughts of rate cuts that may never come.
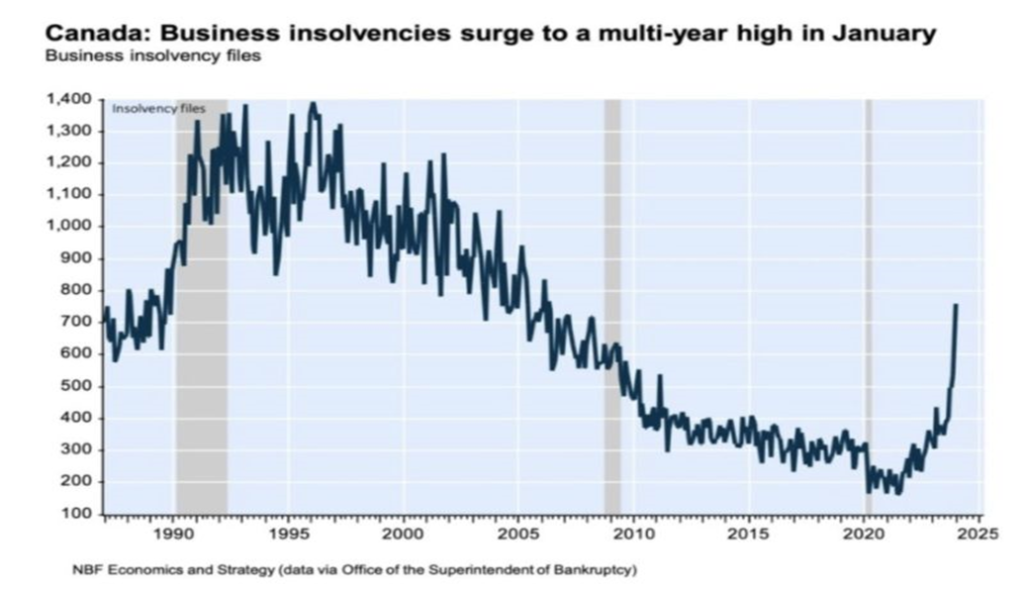
But we know bankruptcies are rising. In the U.S., the number of bankruptcies surged 18% in 2023 because of higher interest rates, tighter lending criteria, and the run-off of pandemic backups. The story is the same in Canada. We picked up this chart on the surge of business bankruptcies in Canada in January 2024, courtesy of economist Todd Hirsch. Mortgage delinquencies are also rising. The BofC has a growing dilemma on its hands just like the Fed. If inflation doesn’t moderate, rates are more likely to stay higher for longer. And that risks a major accident.
The big gold rally this past week caught most observers by surprise. The Wall Street Journal got into the act.
What You Need to Know About Gold’s Curious Rally
—The Wall Street Journal, March 11, 2024
www.wsj.com/finance/commodities-futures/what-you-need-to-know-about-golds-curious-rally-feb05e56
They said Wall Street was caught off guard. Gold is a safe haven. Not Bitcoin, even as it also surged to all-time highs, primarily because of approvals of the ETFs and an upcoming “halving” to Bitcoin’s price. Gold is fearing monetary debasement and the potential for a big financial accident; i.e. a black swan event. And that threatens the stability of the U.S. dollar.
Gold is an alternative currency with no liability. Stocks, bonds, and more have liability. All fiat currencies are mere I.O.U.s with nothing behind them but promises. No wonder China and Russia are making moves to back their currencies with gold. While gold hits all-time highs, silver and the gold stocks lag. However, eventually they could catch up and when that happens, they could rise rapidly. Gold is a wealth preserver. And as the U.S. debt rises, so does gold.
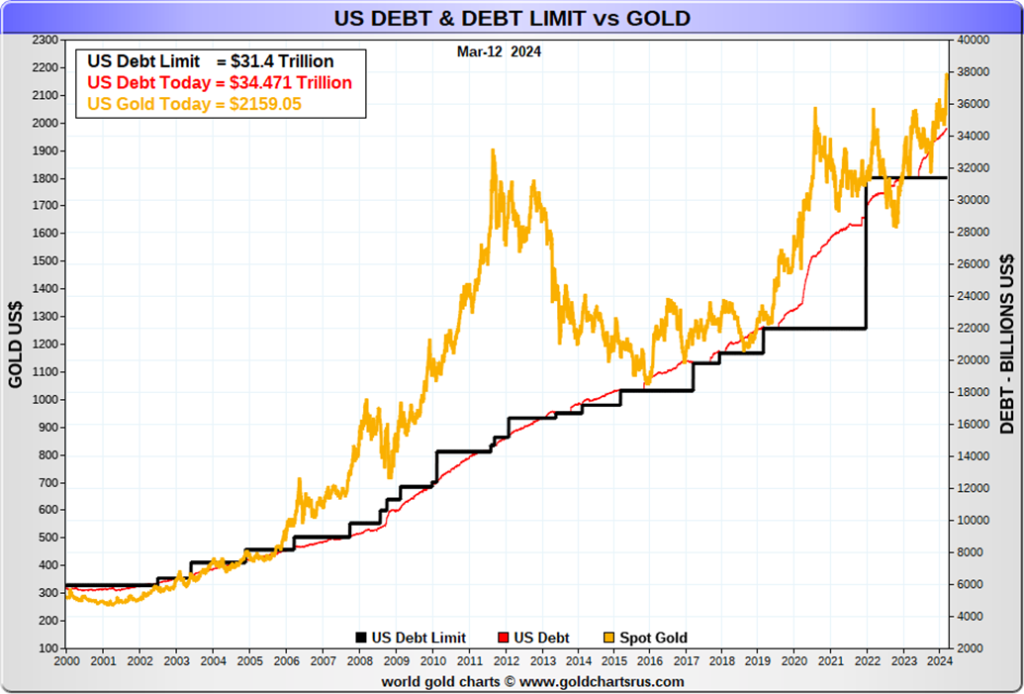
Chart of the Week
They say you can never have enough water. Yet while some places are beginning to swim in it, others are wishing they actually had some. Such is the impact of long-term climatic change where rising sea levels are threatening coastlines and cities around the world, while other areas are suffering drought conditions and water shortages.
The headline screamed “One of the world’s largest cities may be months away from running out of water” (CNN February 25, 2024.) The city is Mexico City with a metro population of 22.5 million, making them the world’s seventh-largest metropolitan area. Some poorer areas of Mexico City struggle to get water for days, even weeks. Aquifers in the region have been shrinking for years. But Mexico City and Mexico in general are not the only region of the world suffering from droughts, with aquifers and reservoirs in many cases at record lows. El Nino is also likely to be causing weather issues.
According to the National Centers for Environmental Information (www.ncei.noaa.gov/), regions suffering from drought conditions include Southern Asia, Africa, South America, Australia, and even North America and Europe. Drought is negatively impacting numerous agricultural zones and is a prime reason why there is upward pressure on food prices. In Europe, affected areas include the Mediterranean and Northern Europe; in
Asia, they include the Southwest and South but also parts up into the Northwest, the Central region, and Russia (Siberia); in Africa, the Mediterranean, Congo Valley, Horn of Africa, and parts of Southern Africa; in North America, Central U.S. and much of Mexico, U.S. Southwest, Western Canada, and Northern Ontario. Other regions may be experiencing the opposite, with too much rain and severe flooding. Rising sea levels are causing the opposite problem in many coastal areas of the world with slowly-sinking cities.
The rise of water scarcity has not received much profile. Yet it has the potential to become a source of major conflict where countries will vie for control of river networks. The rise of water-dependent technologies is also fueling the conflict. A seer once commented that the 20th century wars were fought over oil but the 21st century wars will be fought over water.
All this seems odd when the world is awash in water. However, 96.5% of our water is oceans. 1.7% is groundwater, as in ice caps and glaciers, while only 0.01% is lakes and rivers. However, our ice caps and glaciers are melting while rivers, lakes, aquifers, and groundwater are drying up and/or are polluted. Ice caps and glaciers are also not accessible.
Over half of the world’s wetlands has disappeared. The result is, in a planet with 8 billion people, 1.1 billion lack access to water, while 2.7 billion have water scarcity for at least one month of the year. At least 2.4 billion suffer from inadequate sanitation, leading to numerous diseases. Famine is on the rise. Agriculture is the biggest consumer of water but it also wastes a lot from many inefficiencies.
In 2010, Gwynne Dyer wrote Climate Wars, headlined as the “fight for survival as the world overheats.” He noted that as the world heated and droughts and severe weather events persisted, it could cause mass migrations (waves of refugees as Dyer termed it), dozens of failed states, raging pandemics and war. Everything that he wrote has to come to pass. 2023 was the hottest year on record since modern record- keeping began.
The winter of 2023–2024 was the hottest recorded. The worst may be yet to come. Yet countries, particularly in North America, are locked in intractable divisions between those who believe we have a problem and those who don’t. There are other divisions, but climatic change is a major friction zone.
All that brought us around to having a look at water stocks. Whether these companies can solve problems is, of course, open to question, but it is a sector that is most likely overlooked by many. The sector may garner more attention as water crises deepen.
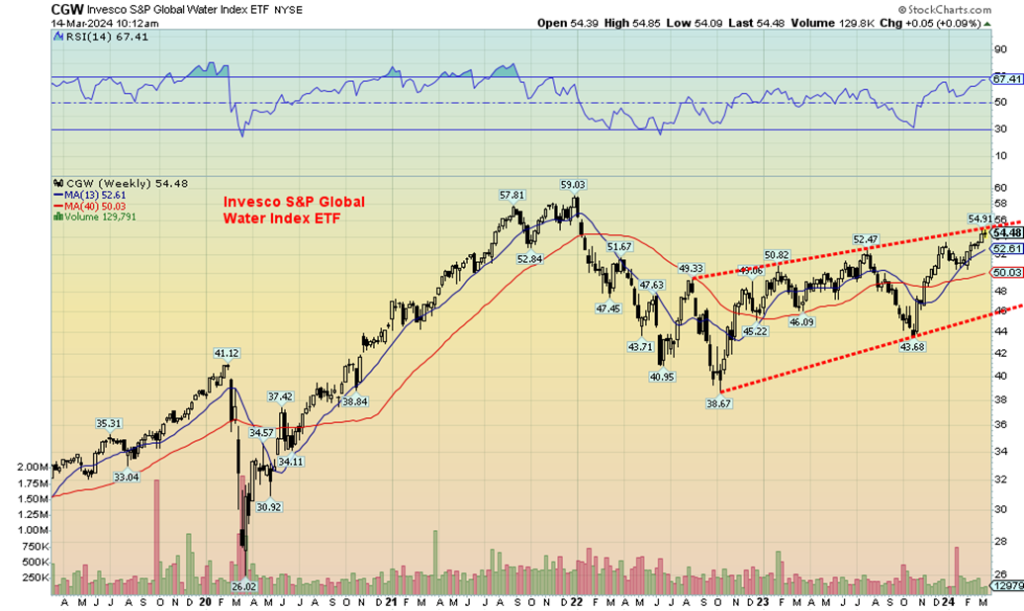
The chart above is the Invesco S&P Global Index ETF (CGW), representing the S&P Global Water Index. The chart has been steadily rising since a low last October 2022 with a secondary low in October 2023. Whether the October 2023 low completed a potential ABC correction is open to interpretation. So far, CGW is bumping up against the upper channel and needs to break up through $56 to suggest higher prices. CGW must also hold the October 2023 low of $43.68. Under $50 might suggest new lows ahead.
There are a number of water stocks, where one can find them by googling water stocks. Investors are encouraged to conduct their own research.
Markets & Trends
| % Gains (Losses) Trends | ||||||||
| Close Dec 31/23 | Close Mar 15, 2024 | Week | YTD | Daily (Short Term) | Weekly (Intermediate) | Monthly (Long Term) | ||
| Stock Market Indices | ||||||||
| S&P 500 | 4,769.83 | 5,117.09 | (0.1)% | 7.3% | up | up | up | |
| Dow Jones Industrials | 37,689.54 | 38,714.77 | flat | 2.7% | up | up | up | |
| Dow Jones Transport | 15,898.85 | 15,498.63 | (1.4)% | (2.5)% | down | up (weak) | up | |
| NASDAQ | 15,011.35 | 15,973.17 | (0.7)% | 6.4% | up | up | up | |
| S&P/TSX Composite | 20,958.54 | 21,849.14 (new highs) | 0.5% | 4.3% | up | up | up | |
| S&P/TSX Venture (CDNX) | 552.90 | 550.90 | (4.2)% | (0.4)% | down (weak) | neutral | down | |
| S&P 600 (small) | 1,318.26 | 1,287.74 | (1.8)% | (2.3)% | up | up | up | |
| MSCI World | 2,260.96 | 2,350.46 | (0.4)% | 4.0% | up | up | up | |
| Bitcoin | 41,987.29 | 68,233.23 (new highs)* | (0.9)% | 62.5% | up | up | up | |
| Gold Mining Stock Indices | ||||||||
| Gold Bugs Index (HUI) | 243.31 | 232.69 | 1.8% | (4.4)% | up | up (weak) | down | |
| TSX Gold Index (TGD) | 284.56 | 275.02 | 1.0% | (3.5)% | up | neutral | down | |
| % | ||||||||
| U.S. 10-Year Treasury Bond yield | 3.87% | 4.31% | 5.6% | 11.4% | ||||
| Cdn. 10-Year Bond CGB yield | 3.11% | 3.58% | 7.5% | 15.1% | ||||
| Recession Watch Spreads | ||||||||
| U.S. 2-year 10-year Treasury spread | (0.38)% | (0.42)% | (5.0)% | (10.5)% | ||||
| Cdn 2-year 10-year CGB spread | (0.78)% | (0.71)% | 6.6% | 9.0% | ||||
| Currencies | ||||||||
| US$ Index | 101.03 | 103.43 | 0.7% | 2.4% | down (weak) | neutral | neutral | |
| Canadian $ | 75.60 | 74.00 | (0.2)% | (2.1)% | down | neutral | down | |
| Euro | 110.36 | 108.87 | (0.5)% | (1.4)% | up | up (weak) | neutral | |
| Swiss Franc | 118.84 | 113.16 | (0.7)% | (4.8)% | down | up | up | |
| British Pound | 127.31 | 127.35 | (0.9)% | flat | up | up | neutral | |
| Japanese Yen | 70.91 | 67.07 | (1.4)% | (5.4)% | neutral | up | down | |
| Precious Metals | ||||||||
| Gold | 2,071.80 | 2,161.50 | (1.1)% | 4.3% | up | up | up | |
| Silver | 24.09 | 25.38 | 3.4% | 5.4% | up | up | up (weak) | |
| Platinum | 1,023.20 | 943.50 | 3.1% | (7.8)% | up | up (weak) | down | |
| Base Metals | ||||||||
| Palladium | 1,140.20 | 1,090.30 | 6.3% | (4.4)% | up | down (weak) | down | |
| Copper | 3.89 | 4.12 | 6.0% | 6.0% | up | up | neutral | |
| Energy | ||||||||
| WTI Oil | 71.70 | 80.58 | 3.3% | 12.3% | up | neutral | neutral | |
| Nat Gas | 2.56 | 1.65 | (8.3)% | (35.6)% | down | down | down | |
New highs/lows refer to new 52-week highs/lows and, in some cases, all-time highs.
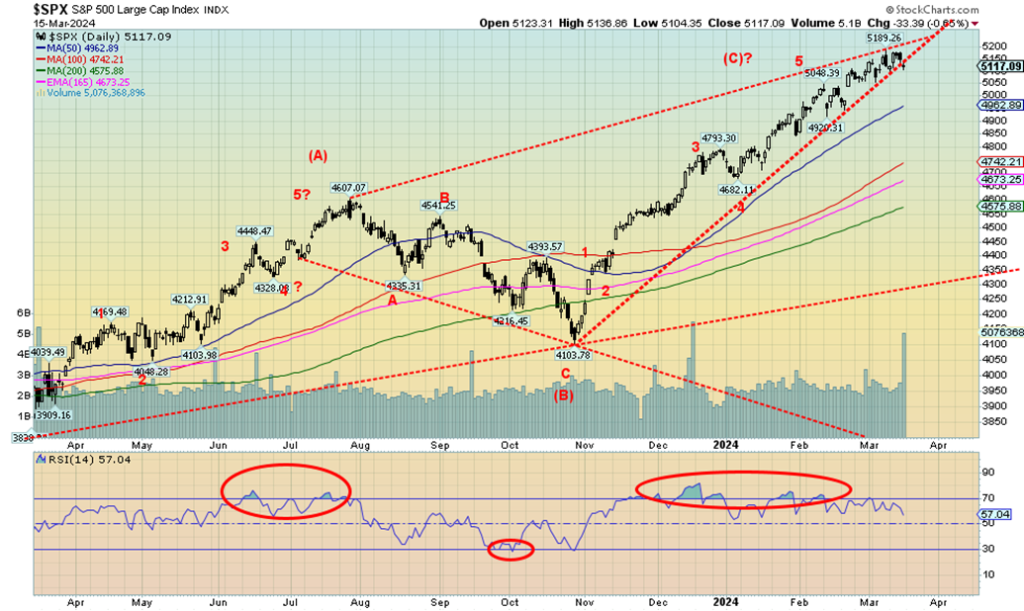
Are we topping? That is the question. We have often noted that we were looking for a potential top in March and we may have got one on March 8. That day saw an outside possible key reversal with a higher high than the previous day, a lower low and a lower close. Over the next week, while we wiggled back up, we did not take out the March 8 high. Then on Friday, following the higher than expected PPI, we fell and appear to be breaking the up trendline from the October 2023 low.
The trouble is, we can’t confirm this until we get a close under 4,900, the most recent daily low. On the weekly and monthly charts, we have to break down under the October 2023 low of 4,100. That’s a long way off to confirm a major sell signal. Most indicators are rolling over and giving us daily sell signals. A minor divergence saw the S&P 500 Equal Weight Index make fresh all-time highs this past week but not the S&P 500.
On the week, the S&P 500 fell 0.1%, the Dow Jones Industrials (DJI) was flat, the Dow Jones Transportations (DJT) fell 1.4%, and the NASDAQ dropped 0.7%. The S&P 500 Equal Weight fell 0.7 after making all-time highs (a negative) while the NY FANG Index fell 1.1%. The S&P 400 (Mid) was off 1.0% and the S&P 600 (Small) dropped 1.8%.
In Canada, the TSX Composite was up 0.5% to fresh 52-week highs but the TSX Venture Exchange (CDNX) was miserable, dropping 4.2%. None of that stopped Bitcoin as it made all time highs at $73,800, then closed the week lower, off 0.9%. Has Bitcoin topped? We’d have to get back under $50,000 to confirm that.
In the EU, the London FTSE was up 0.9% while the EU indices keep making new all-time highs. The EuroNext was up 0.3%, the Paris CAC 40 gained 1.7%, while the German DAX jumped 0.7%, all making new all-time highs. And remember that is against the background of recessionary conditions in the EU and the U.K.
In Asia it was mixed as China’s Shanghai Index (SSEC) rose 0.3%, Hong Kong’s Hang Seng (HSI) was up 1.1%, but the Tokyo Nikkei Dow (TKN) dropped 2.1% after finally taking out after 34 years the late 1989/early 1990 high.
As we note, the SPX line in the sand is at 4,900. Under that would confirm a top. New highs continue the upward march. These reversals we’ve seen before and they have usually ended with new highs wiping out the potential signal. Nonetheless, we are buoyed by all the divergences we’ve seen over the past few weeks, the most notable being the divergence between the DJI and the DJT. We cover the DJT later.
We’ve been looking for a potential high in March. The question is, do we have it? Maybe this week’s FOMC meeting will help it along if the Fed remains not in a mood to cut interest rates.
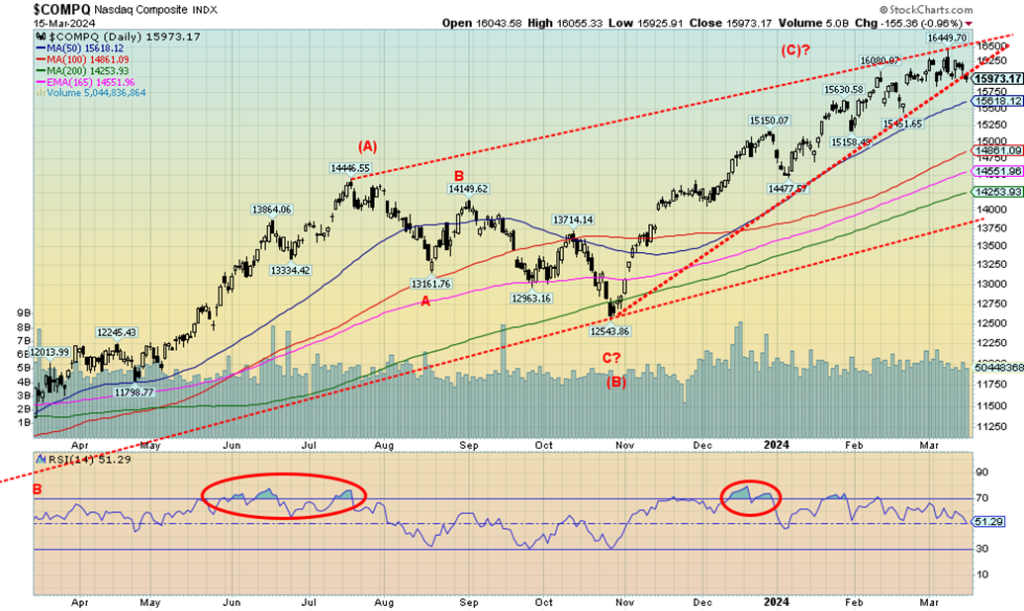
The NASDAQ is faltering but we have no confirmed breakdown. This past week the NASDAQ fell 0.7%, led primarily by the FAANGs as the NY FANG Index fell 1.1%. The Magnificent Seven are faltering, it seems. They didn’t have a good week unless you are talking about Microsoft that did make all-time highs, up 2.5% on the week. Google was a bigger winner, up 4.3%. But it was the Chinese stocks that bounced back as Baidu gained 5.7%, even as Alibaba fell 0.2%.
Otherwise, it was losses: Meta was down 4.3%, Tesla dropped 6.7%, Snowflake off 3.3%, Advanced Micro (AMD) down 7.9%, and Broadcom off 5.6%. The NASDAQ is seemingly breaking the uptrend line from the October 2023 low, but we won’t confirm that until we break under the 50-day MA near 15,600. We appear to be forming a potential wedge triangle and we just broke the triangle on Friday. But, as noted, we won’t confirm that until we are under 15,600. If that’s correct, then we could see a decline to 13,750. The Magnificent Seven aren’t looking so magnificent any longer.
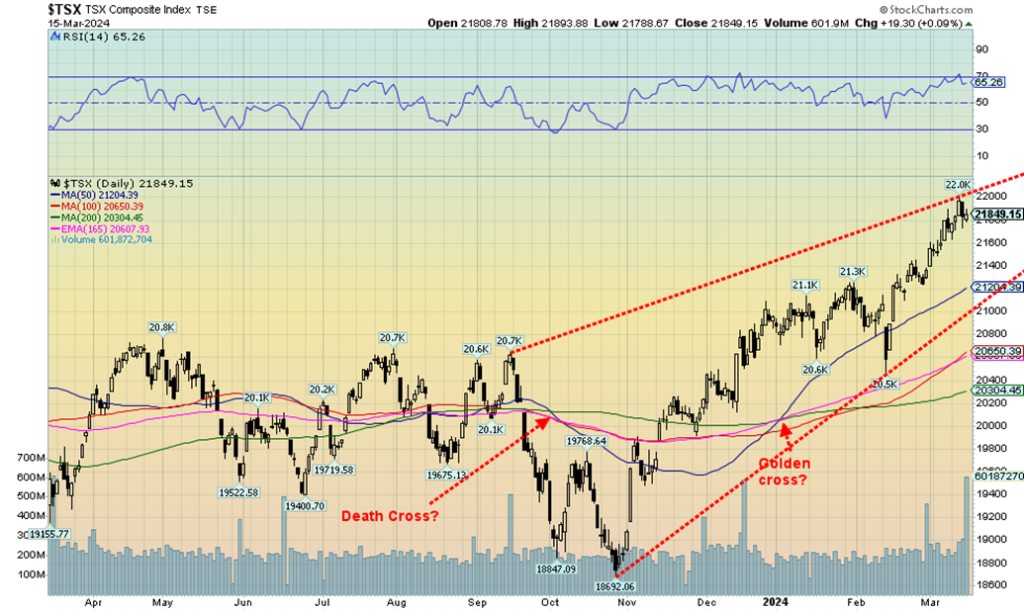
Once again, the TSX Composite hit fresh 52-week highs but remains short of the all-time high set in April 2022. We are still roughly 200 points shy. If this were a top, then it is possible we’d have a multi-year double top. But that’s not confirmed. We’d have to fall back under 20,500 to confirm a major top. The TSX Composite bucked the trend this past week and closed 0.5% higher. The TSX Venture Exchange (CDNX) wasn’t so fortunate, falling 4.2%.
It remains quite depressed. Of the 14 sub-indices, the record was eight up and six down. Leading the way down was Telecommunications (TTS), off 3.1%, and Utilities (TUT), down 2.1%. Income Trusts (TCM) fell 2.5%. Note that it was the interest-sensitive indices that fell, although the Financials hit new 52-week highs and gained a tiny 0.05%. The big gainers to the upside: Materials (TMT), up 3.3%, Energy (TEN), up 3.1%, and Metals & Mining (TGM), up about 2.0%. Interest sensitives down, commodity-based up.
Also making new all-time highs were Consumer Discretionary (TCD), down about 0.2%, and Industrials (TIN), up 0.6%. The TSX 60 along with the broader composite made 52-week highs. We could argue that the TSX is forming a large upward-sloping wedge but it is not confirmed. The breakdown doesn’t occur until under 21,000 and we must not see any new highs that bust the forming wedge. As we note, the major break doesn’t come until under 20,500.
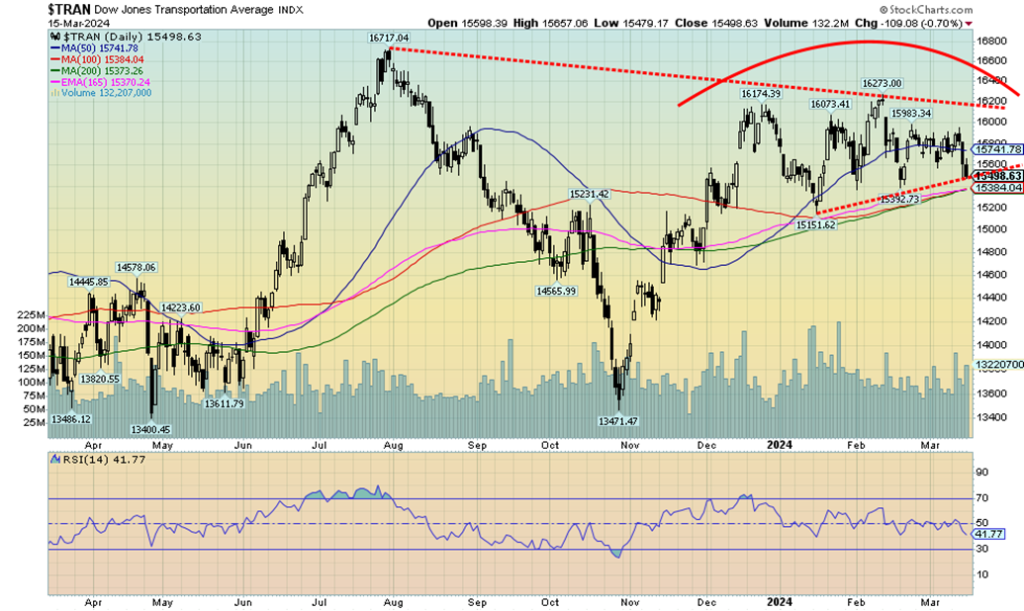
While other indices were making new all-time highs—i.e. Dow Jones Industrials (DJI)—the Dow Jones Transportations (DJT) is not only well short of its November 2021 all-time high (18,246) but it is also nowhere near its July 2023 high (16,717). The divergence with the DJI is a classic Dow Theory potential sell signal as the indices must confirm each other. Many claim that it doesn’t matter anymore. They may be surprised to learn that the indicator is 100%.
The DJT hasn’t broken down yet but it appears poised to. A breakdown under 15,300 would most likely start the decline with potential targets down to at least 13,900 and potentially even new lows below the October 2023 low of 13,471. While new highs above 16,270 might save the DJT, the entire move up from the October 2023 low appears corrective. The question is, when does the breakdown get underway?
U.S. 10-year Treasury Bond
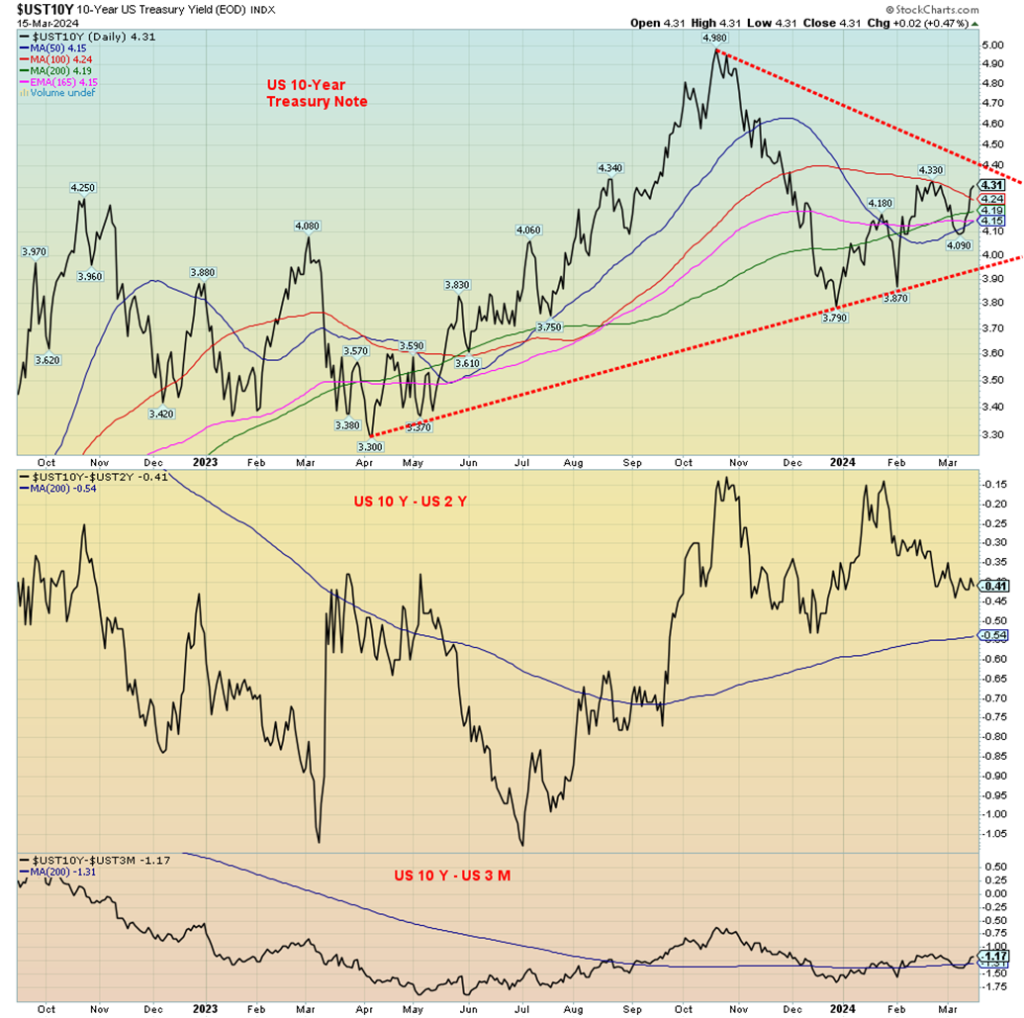
We’re not sure why, but the format we usually got from Trading Economics wasn’t available. So, we went to StockCharts instead. The chart above shows the U.S. 10-year treasury note rising to 4.31% this past week, up from 4.08%. The catalyst, of course, was the somewhat stronger than expected CPI and PPI for February, that was reviewed in our opener. We also show the 2–10 spread and the 3 month–10 spread. The 2–10 spread rose slightly to negative 42 bp from negative 40 bp.
The 3 month–10 spread is at negative 117 bp. These spreads remain quite wide, suggesting to us that a recession could still be months away. Not helping were the weekly initial jobless claims that fell to 209,000, down from 210,000 the previous and below expectations of 219,000. With the job market still strong, no one is expecting interest rates to come down anytime soon. One glitch was the NY Empire State Index (manufacturing in NY) that came in at negative 20.9 vs. negative 2.4 in January and the expectation of negative 5.
The big story for the coming week is the FOMC interest rate decision on Wednesday, March 20. The wide expectation is unchanged, but the market will be hovering for clues as to whether the Fed would cut in June. The next one is April 30/May 1, followed by the widely anticipated June 11/12 FOMC. Many are still expecting a rate cut in June.
The 10-year breaks out above 4.40% and could project up to 5.60% and new highs. Would that happen? It’s a possibility but nothing else. The breakdown is under 4.00%.
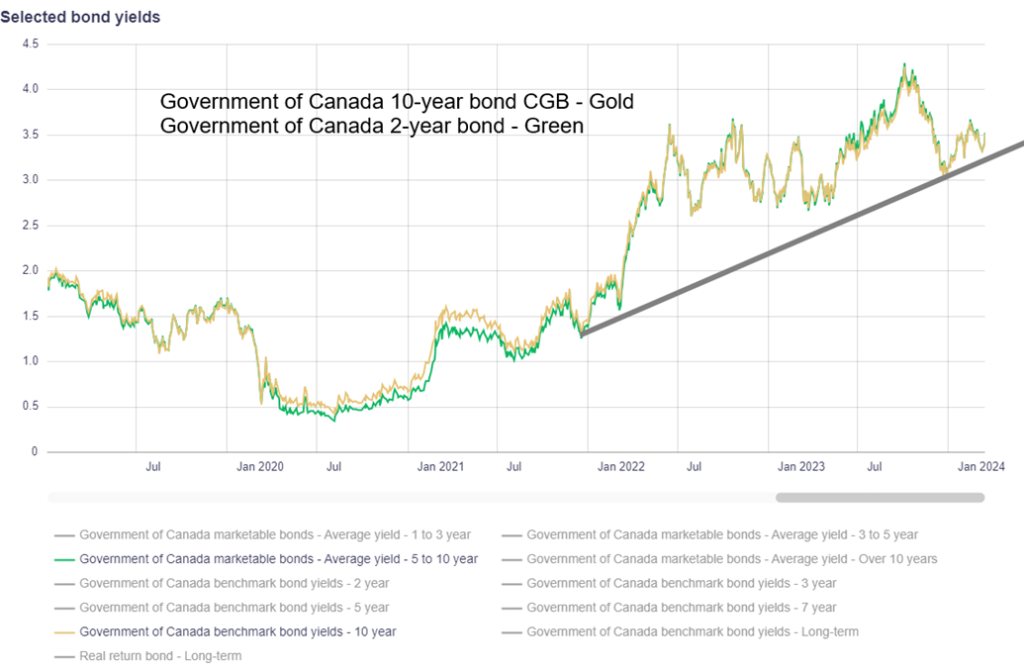
Bond yields rose in Canada as well as the Government of Canada 10-year bond (CGB) jumping to 3.58%, up from 3.33%. Canada does follow the U.S. and with inflation higher in the U.S. it impacted Canada as well. There weren’t a lot of numbers out for Canada this past week, but one that stood out was housing starts that jumped to 253,500 in February, up from 223,200 starts in January and expectations of 220,000/230,000 starts. That is still well off the 321,000 starts seen in March 2021.
This week, look for Canada’s inflation rates with PPI out on Monday and CPI out Tuesday. Expectations are that PPI y-o-y is up 2.0% and CPI up 3%. Core CPI is expected up 2.3%. Retail sales are out on Friday.
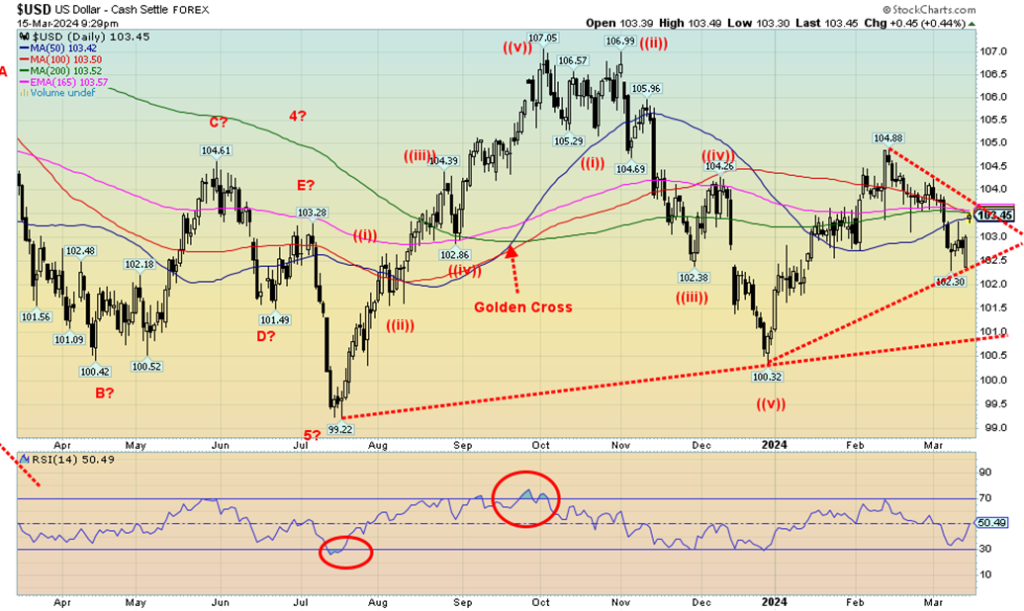
Following the stronger than expected PPI on Friday, the US$ Index leaped upward. Is that a breakaway gap? We can’t tell yet. However, if we were to take out 104, then we’d have to give credence to the gap and suggest the US$ Index is poised to move higher. Otherwise, a failure here would take the index right back down. A firm break under 102.50 would seal lower prices for the US$ Index.
This past week the US$ Index rose 0.7%. The currencies suffered as the euro fell 0.5%, the Swiss franc was off 0.7%, the pound sterling dropped 0.9%, while the Japanese yen fell 1.4%. The Cdn$ dropped 0.2% and, of course, gold also fell down 1.1%. What’s key should be this coming week especially given the FOMC meetings.
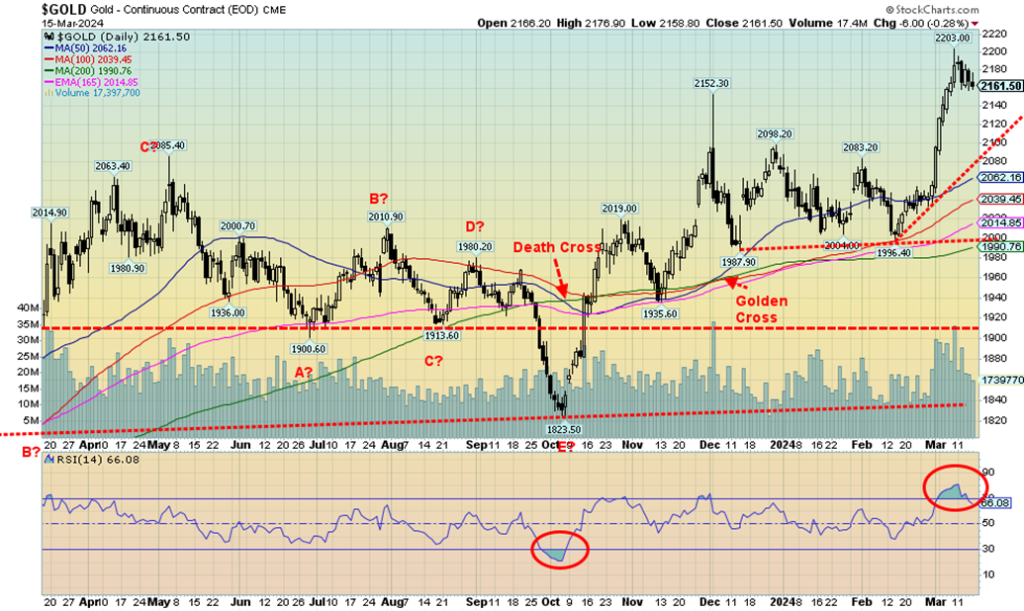
After a sharp run-up from about $2,000 to new record highs at $2,200, gold became overbought. A consolidation appears to be now settling in. Gold was the only casualty of thoughts of rate hikes this past week, falling 1.1%. Silver rose 3.4%, while platinum was up 3.1%. The near precious metals got into the act as palladium rose 6.3% and copper (see next) jumped 6.0%. The gold stocks also rose with the Gold Bugs Index (HUI) up 1.8% and the TSX Gold Index (TGD) gaining about 1.0%.
The catalyst for gold to pull back was the better than expected CPI and PPI released this past week. With some signs that inflation is picking up once again, gold reacted negatively to thoughts that the Fed would keep rates higher for longer. The question is, do thoughts of higher for longer interest rates outweigh thoughts of the growing risk of a significant default? We have previously noted the risks involved in a major sovereign default or a very large financial institution failing; for example, a Russian default à la 1998 that busted Long Term Capital Management (LTCM) and in turn almost busted the entire global financial system.
Or a large institutional failure à la Lehman Brothers 2008 that again almost busted the financial system, with the Fed and all the other major central banks (i.e. Bundesbank, BOE, ECB, BofC, BOJ) coming to the rescue. But, as we have noted, the central banks are between a rock and hard place. Are they out of bullets for another major financial failure? The previous incidents resulted in a massive upward move in debt (government, corporate, and household). As did the pandemic, which in turn led to bubbles in the stock market and housing in particular.
For gold, $2,200 is now a resistance zone. Support can be seen down to $2,100, but below that level a fall to $2,000 is possible (although unlikely, given the conditions). A consolidation could continue for a week or more before another assault on $2,200 is made. Targets remain to at least $2,300 with secondary targets up to $2,500.
Besides the risk of a financial black swan, the geopolitical situation remains on edge. And, as we march towards the U.S. election in November, the risks of negative fallout from that remain. All would be positive for gold as gold acts positively in the face of loss of faith in government.
On the week, gold had an inside week, suggesting that this is merely a pause and not a potential top. That tells us that one could buy pullbacks towards $2,100. Gold’s performance since 2000 suggests as well that, given it’s the leader, one could favour owning gold over both silver and gold stocks, both of which have underperformed. But if a strong rally gets underway, then silver and gold stocks should outperform. Gold has no liability, unlike stocks. Silver is still rated as poor man’s gold. Premiums above spot to buy silver remain high.
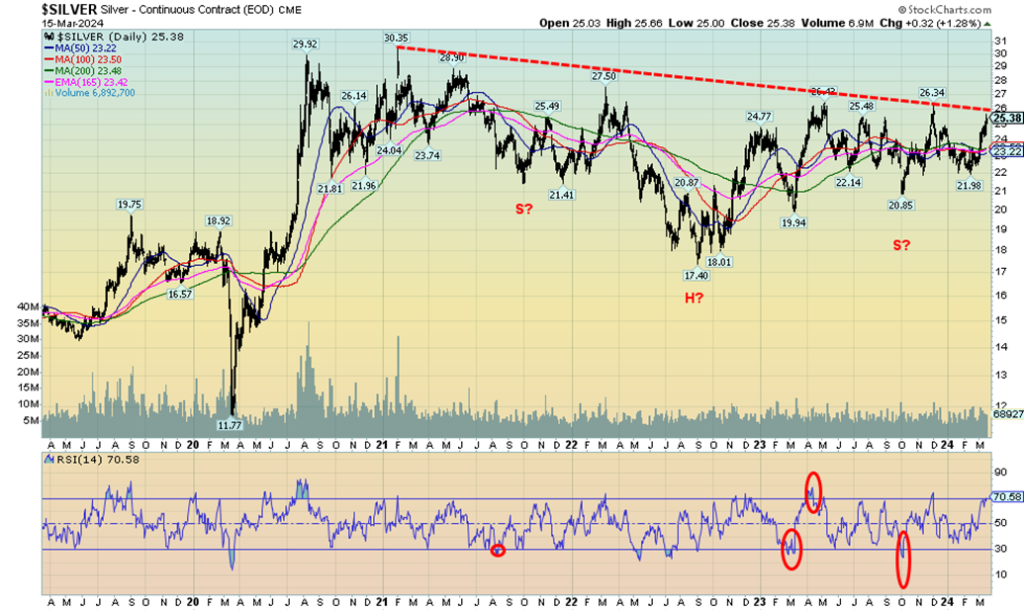
While gold faltered this past week on fears of rate hikes, silver wasn’t too bothered and put in another good week, gaining 3.4%. Silver is now up in 2024 by 5.4%. We continue to note what appears to be a large head and shoulders reversal pattern on silver. A firm break above $26 could project up to about $39. The $26 breakout level is now so well known by traders it almost could prove to be difficult to break through. Or it could generate a false breakout. More important then would be a move above $27.50, the high seen in early 2023. Above that level would be confirmation of the breakout.
A few negatives. First, the RSI is now above 70, in overbought territory. That suggests silver could consolidate in front of the $26 breakout level. Second, the commercial COT is down to 30%, a level we are not overly comfortable with as the commercials appear to be getting ready for a pullback. Bullish levels are seen over 40%. Nonetheless, despite the weakening commercial COT, it doesn’t mean we will fail at $26. As well overbought conditions can remain in place for some time. The runup in 2020 from $11.77 to $29.92 saw silver overbought for a good couple of weeks, at least.
The potential head and shoulders pattern is compelling, but we need to see it realized. The gold/silver ratio is at 85.61, down from a high of 92.41 but still quite high. In December 2022 it fell to 73.90 and has been in an upswing ever since. If we were at 73.90, silver would be trading at $29.25.
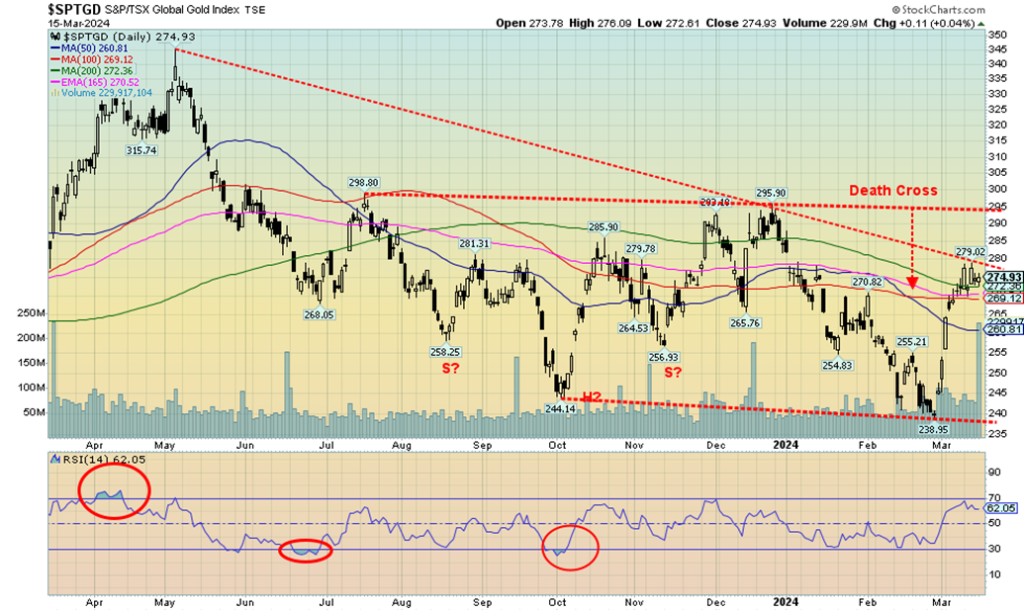
Despite gold consolidating this past week, the gold stocks added to their gains. However, the two main gold stock indices remain below breakout points. The TSX Gold Index (TGD) gained about 1.0% this past week while the Gold Bugs Index (HUI) was up 1.8%. Having different holdings does that. The TGD remains under its breakout level of 280 and still below a more important breakout level at 295/300. The HUI is under its breakout level of 245/250. For the TGD a move above 320 suggests new highs above the May high ahead. It’s important now to hold above 270.
Below 260 a test of the lows could be coming. The move up thus far has been on volume, an important ingredient if we are to go higher. The TGD remains 40% below its all-time high seen in 2011 while the HUI is worse, down almost 64% from its 2011 all-time high. Meanwhile, gold has made new all-time highs but silver is still down 50% from its all-time high. Only gold shines. And certainly not the junior miners where the TSX Venture Exchange (CDNX) remains depressed.
The Gold Miners Bullish Percent Index (BPGDM) is at 35.7, suggesting it has considerable room to move higher before it hits overbought territory above 75. So far, the TGD is not showing any significant overbought signs, suggesting as well that it has room to move higher. Just heed the support zones of 260 and 270. The gold/HUI ratio is at 9.29, so gold stocks remain cheap relative to the gold price. In 2020 the ratio hit 5.31. If we were at that level today the HUI would be trading at 407, not the current level of 233.
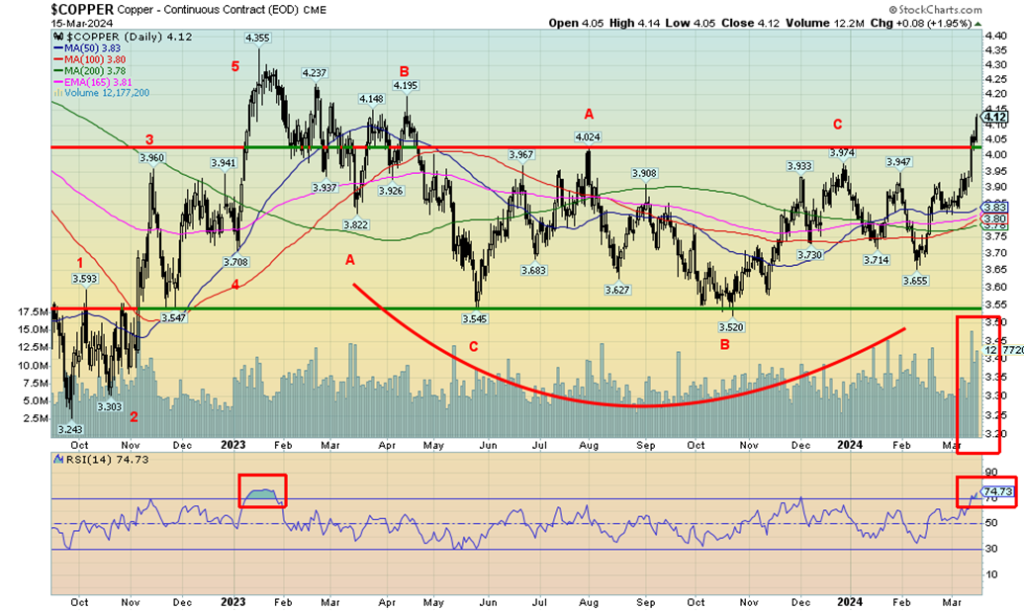
Copper broke out this past week, clearing above $4. Above $4.15 and new highs are possible above the early 2023 high of $4.35. We consider copper an early and leading indicator for gold, so its rise should also help gold prices (which are already at all-time highs). Note the big volume uptick on copper as we broke above $4 this past week. We are somewhat overbought with an RSI at 74.7. So, a consolidation may be in store. But a breakout on volume is positive and we expect that we could soon see new highs above $4.35. It’s also helping copper stocks as Freeport McMoran (FCX) also broke out this past week on an uptick in volume but remains shy of its all-time high of $50.33.
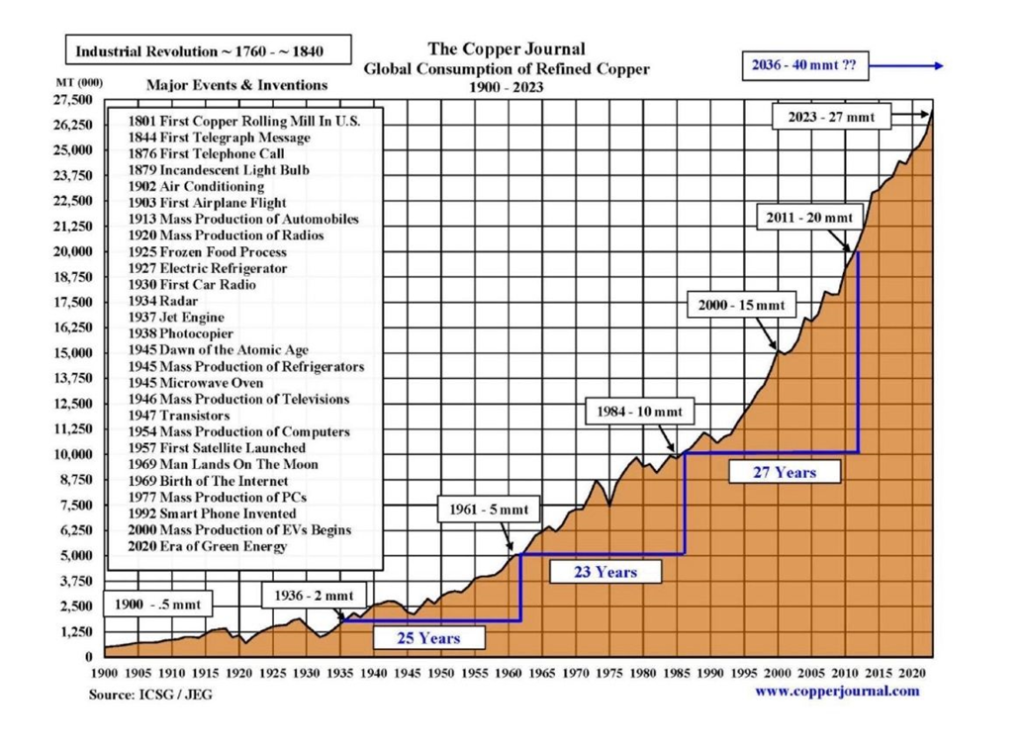
Copper is needed to expand the global electricity grid. It needs to double in size to meet growing net-zero targets. Costs are estimated to be upwards of $21 trillion. There is also infrastructure requirement. The grid has to double in size from current levels. The longer the world waits the more expensive it becomes.
The chart below chronicles the rise of copper.
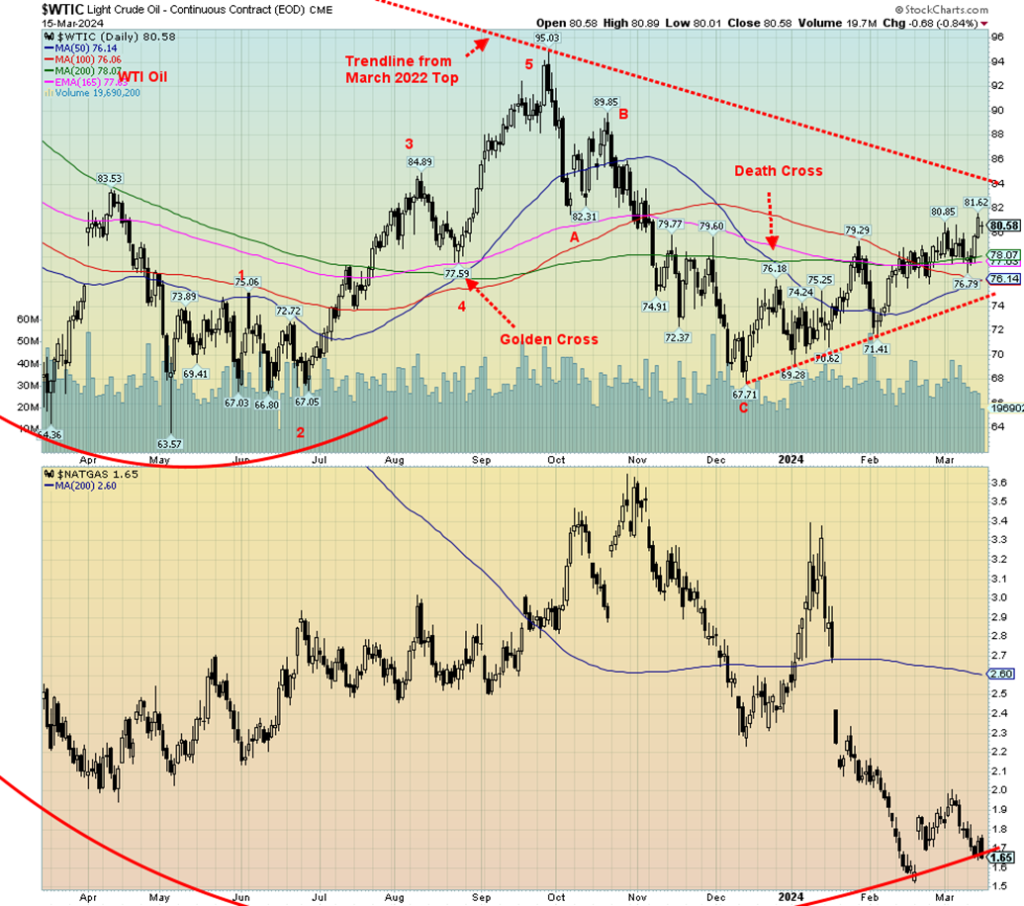
Is WTI oil finally going to break above $80? We did close above $80 ($80.58) this past week, but so far it is not overly convincing. On the week WTI was up 3.3%. Brent closed over $85 and was up almost 4.0%. That all helped the energy stocks to rally as the ARCA Oil & Gas Index (XOI) was up to new all-time highs once again with a gain of 4.8%. The TSX Energy Index (TEN) didn’t fare as well, gaining only 3.1% and short of new highs. Natural gas (NG) continues to languish, thanks to plentiful supplies and warm weather. NG at the Henry Hub fell 8.3% and remains depressed. NG at the EU Dutch Hub was up 2.4% which was mostly negligible.
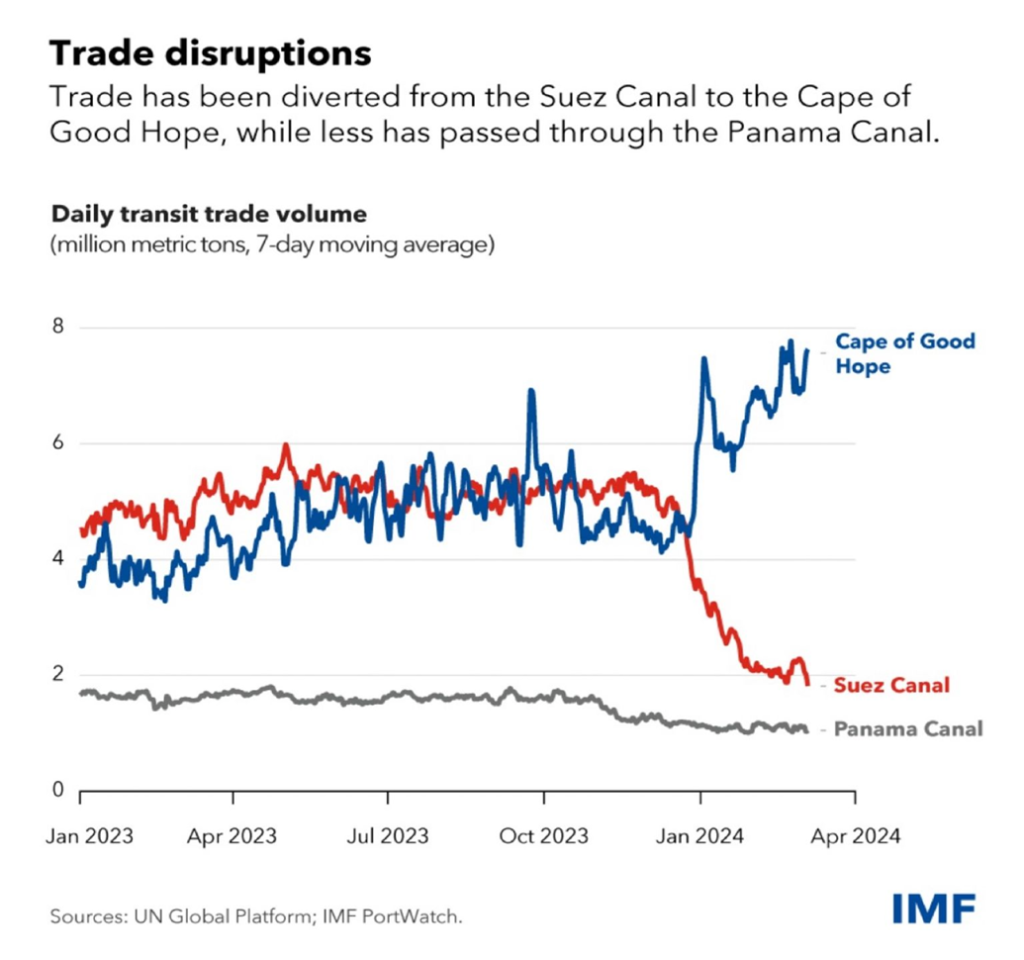
Geopolitical concerns remain. Attacks by Ukrainian drones on Russian oil refineries was a factor. To counter, Russia upped its exports somewhat. The Middle East remains a tinder box, especially with how the Houthis are changing the narrative in the Red Sea. Trade through the Suez is falling while trade around the Cape of Good Hope is rising. U.S. inventories have been falling, or at least not rising, and remain near the lower limit normally seen. Gasoline stocks are also falling.
While we are over $80, the more important point to take out is above $84. That line was drawn down from the top of over $130 seen in 2022 following the outbreak of hostilities between Russia and Ukraine. Once above $84/$85 we could see a swift rise towards $100. A break back down under $77 would be negative and under $75 the oil rally is most likely over. Below $74, we could be headed back to the lows near $68. We’re in an uptrend, but until we break above $84 it is one we should treat with caution. Energy stocks may be leading with the XOI hitting new highs and the TEN getting close. That is a positive sign, suggesting oil prices should rise going forward.
New lows for NG can’t be ruled out. We need to regain above $2 to begin to suggest that a low is in.
__
(Featured image by Adam Nowakowski via Unsplash)
DISCLAIMER: This article was written by a third party contributor and does not reflect the opinion of Born2Invest, its management, staff or its associates. Please review our disclaimer for more information.
This article may include forward-looking statements. These forward-looking statements generally are identified by the words “believe,” “project,” “estimate,” “become,” “plan,” “will,” and similar expressions. These forward-looking statements involve known and unknown risks as well as uncertainties, including those discussed in the following cautionary statements and elsewhere in this article and on this site. Although the Company may believe that its expectations are based on reasonable assumptions, the actual results that the Company may achieve may differ materially from any forward-looking statements, which reflect the opinions of the management of the Company only as of the date hereof. Additionally, please make sure to read these important disclosures.
Copyright David Chapman 2024
David Chapman is not a registered advisory service and is not an exempt market dealer (EMD) nor a licensed financial advisor. He does not and cannot give individualised market advice. David Chapman has worked in the financial industry for over 40 years including large financial corporations, banks, and investment dealers.
The information in this newsletter is intended only for informational and educational purposes. It should not be construed as an offer, a solicitation of an offer or sale of any security. Every effort is made to provide accurate and complete information. However, we cannot guarantee that there will be no errors. We make no claims, promises or guarantees about the accuracy, completeness, or adequacy of the contents of this commentary and expressly disclaim liability for errors and omissions in the contents of this commentary.
David Chapman will always use his best efforts to ensure the accuracy and timeliness of all information. The reader assumes all risk when trading in securities and David Chapman advises consulting a licensed professional financial advisor or portfolio manager such as Enriched Investing Incorporated before proceeding with any trade or idea presented in this newsletter. David Chapman may own shares in companies mentioned in this newsletter. Before making an investment, prospective investors should review each security’s offering documents which summarize the objectives, fees, expenses and associated risks.
David Chapman shares his ideas and opinions for informational and educational purposes only and expects the reader to perform due diligence before considering a position in any security. That includes consulting with your own licensed professional financial advisor such as Enriched Investing Incorporated. Performance is not guaranteed, values change frequently, and past performance may not be repeated.


Switzerland’s Medical Cannabis Reform Advances Access, But Barriers Remain
Switzerland’s 2022 medical cannabis reform improved patient access by removing federal approval requirements, but challenges remain. MEDCAN highlights barriers including...


Swisscanto Launches Catastrophe Bond Fund for Portfolio Diversification
Swisscanto launches a Luxembourg UCITS catastrophe bond fund, giving qualified investors access to insurance-linked securities tied to extreme natural events....


AI Agents Transform Payments as Visa, Mastercard, and Qonto Tackle Trust, Liability, and Regulation
Visa and Mastercard are advancing AI-driven autonomous payments, shifting focus to trust, liability, and regulation when agents act without real-time...

Bitcoin ETFs Lead as German Stock Exchange Debuts Mining ETF
Bitcoin and Ethereum remain largely flat, with BTC near 66,600 and ETH around 1,920, while ETFs see steady inflows. A...


Ali G Makes Surprise Wimbledon Appearance with Cannabis-Themed Satire
Sacha Baron Cohen revived his iconic Ali G character at Wimbledon’s men’s final, blending satire with British high society. Dressed...
 |
|
 |  |
 |
|
-

 Business4 days ago
Dow Jones’ Record Run Faces Early Signs of Potential Shift
-

 Business2 weeks ago
Jobs Cooling Fast as a Cautious Fed Leaves Markets Without a Safety Net
-
 Fintech19 hours ago
AI Agents Transform Payments as Visa, Mastercard, and Qonto Tackle Trust, Liability, and Regulation
-

 Cannabis1 week ago
Cannabis Regulation in Germany and Switzerland Shows Early Benefits of Legalization Models