Markets
Debt: A liability or Obligation to Pay or Render Something
Highlight at the end of the week was Fed Chair Jerome Powell speaking at the annual Jackson Hole, Wyoming symposium. He was a bit hawkish so that at least temporarily halted what might be an emerging gold rally. Still the golds were up on the week but the stock market was decidedly mixed with the S&P 500 and NASDAQ up but the Dow indices down. The TSX was largely flat but the CDNX continues to be woeful.
If you or I fail to pay back our debts and go bankrupt, the only ones impacted are most likely just ourselves and the person(s) or company that lent us the funds. When a company fails to pay back its debts and goes bankrupt, it impacts not only the creditors but the owners of the company and their employees. However, when a big money center bank goes under, it could have global ramifications. But what about a country?
Countries get bailed out as global central banks and global institutions such as the International Monetary Fund (IMF) gather together to provide loans to shore up the country. As for large countries such as the U.S., China, Japan, etc., the central bank steps in and effectively prints money. A reminder that this money is just fiat; meaning, it has no intrinsic value except what the government says it has. Money is backed by the word of the government and nothing else. Money used to be backed by gold, but the gold standard ended in August 1971. That was when former president Richard Nixon took the world off the gold standard and effectively ended Bretton Woods, the global monetary system set up in 1944 to help take the world out of the Great Depression and war. The U.S. dollar was the world’s reserve currency set at the rate to gold at $35/ounce.
But now the U.S. dollar and all currencies are just fiat and its only backing is the government’s word that is good. Maybe it’s no surprise then that the purchasing power of that dollar has done nothing but go down ever since. And that the price of gold has gone up as the debt rises.
Chart of the Week
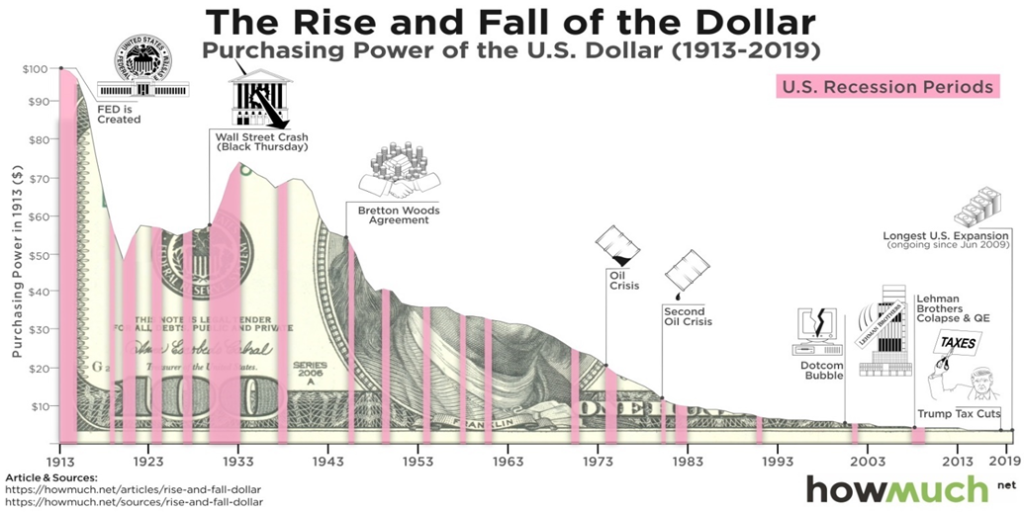
In 1913, when the Federal Reserve was created, US$1,000 would purchase 48.4 ounces of gold. Today, US$1,000 would only buy about 0.52 ounces of gold. That is purchasing power decline in a nutshell.
U.S. Federal Debt, U.S. M1 Money Supply 1970–2023 ($billions)
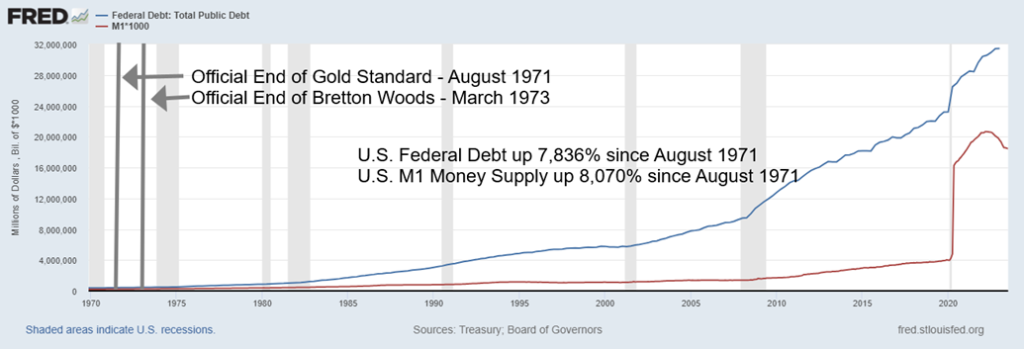
With the end of Bretton Woods, money and debt exploded. Since August 1971, U.S. federal debt is up 7,836% while money supply (M1) is up 8,070%. The debt keeps growing. M1 has actually contracted as the Fed tightens. It’s down 10.4% since its peak in April 2022. The Fed started its interest rate hikes in March 2022. Real GDP has gone up only 302% in the same time period. U.S. Debt to real GDP, which was only about 8.1% in 1971, is now 154%. Federal debt to nominal GDP is 119.1%. As to markets, the S&P 500 is up 4,500% while gold is up just shy of 4,500%.
And that’s just the U.S. What about the world? In 2008, at the time of the global financial crisis, global debt was estimated at about $140 trillion. Today that is $305 trillion and counting. And that’s not even counting shadow debt from derivatives, which adds at least $50 trillion to that number. That sector holds hedge funds, private equity funds, mortgage lenders, and even some large investment banks. We have a debt problem. A really big debt problem.
Total U.S. debt is estimated at $102.2 trillion, making the U.S. the world’s most indebted country, holding roughly 33.5% of global debt. Global debt to GDP was estimated by the IMF at about 418% in 2021. It may be higher today. Global household debt to GDP is estimated at 96.1%; private debt, which includes corporations, is estimated at 285%; while general government debt, which would include states, provinces, etc., is estimated at 36.8% to GDP. Yes, the most indebted is corporations and financial entities (i.e. banks).
Debt has been around for eons, dating as far back as the Bronze Age. That means that debt crises have happened throughout history. This Time is Different was the title of a book by economists Carmen Reinhart and Kenneth Rogoff. Its subtitle was Eight Centuries of Financial Folly. David Graeber’s book, titled simply Debt, the First 5000 Years, also looked at the history of debt from what was known as the Axial Age 800 BC to 600 AD and included the debt follies of the Greek, Roman, Chinese, and Indian empires, to the Middle Ages 600 AD to 1450 AD, and the Capitalist Age (that included the great empires of Spain, Portugal, France, Netherlands, and Britain), and finally the current, unnamed age that started in 1971 with the great fiat money experiment. Note: all periods of fiat currencies have ended badly. The Chinese tried, starting in 700 AD and peaking in the 13th century under the Yuan dynasty. There were others. All failed.
How will it end? Reinhart and Rogoff contend that, no, this time is not different, only how it unfolds and ends. Since 1971 we have had a series of crises. The energy crisis of the 1970s that included the Arab oil shock, followed by the Iranian oil crisis of 1979 and the severe recession of 1980-1982; the Latin America debt crisis in the late 70s to early 80s; the Japanese property bubble of 1986–1992 that burst; the October 1987 Black Monday crisis; the savings and loan crisis of 1986–1995 that helped bring about the early 1990s recession; numerous banking crises in Portugal, India, Finland, and Sweden; the Mexican peso crisis in 1994, the Asian financial crisis in 1997, and the Russian debt crisis in 1998; financial crises in Ecuador, Argentina, and Brazil in the late 1990s, followed by an Argentinian depression in the early 2000s; the dot.com collapse in 2000–2002; banking crises in Turkey, Venezuela, and Uruguay in early 2000s; the Great Financial Crisis of 2007–2009; the European sovereign debt crisis and Greece in 2009–2019 that also saw banking crises in Portugal, Iceland and Cyprus; the Russian financial crisis, following the start of the war between Ukraine and Russia in 2014 to the present day; the 2015 Chinese stock market crash; the Turkey crisis in 2018; Argentina again; the COVID crisis in 2020 and the March 2020 stock market crash; the Sri Lankan sovereign debt crisis; the start of the Chinese property debt crisis in 2020 to the present day; and, finally, Pakistan and Russia financial crises starting in 2022 and ongoing. Did we forget anybody?
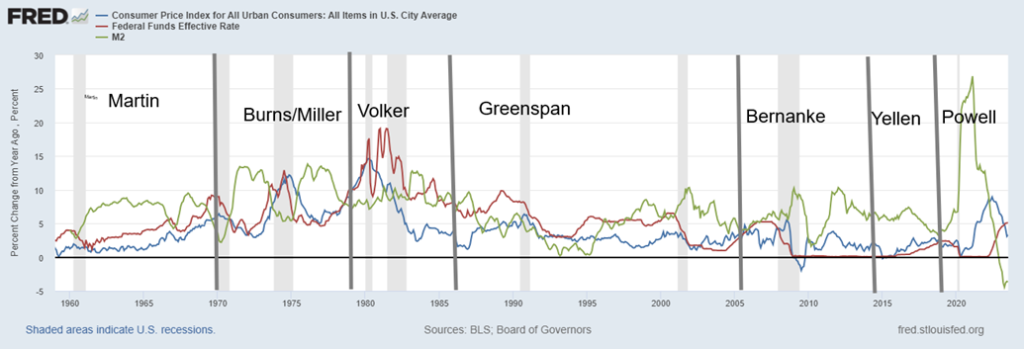
The end of the gold standard and Bretton Woods has begot crisis after crisis, both financially and economically. And we are not finished yet. Yet, amazingly, the stock market keeps going up and up. It’s amazing what oodles of money pumped into the financial system can do. Our chart below highlights how, especially in the latter part of the 90s and for most of the time since, markets have been fueled by low-interest rates (Fed funds) generally below the rate of inflation (CPI) while providing oodles of liquidity via QE (M2). This was true under Greenspan, Bernanke, Yellen, and now Powell. Although, for the first time in memory, M2 is actually falling. And if M2 is falling and Fed funds rising above the rate of inflation, that does not bode well for the stock market or the housing market going forward.
CPI, Fed Funds, M2 1960–2023
Higher interest rates are here to stay. We hear constant talk about how, if another financial crisis develops, the Fed will do as they did before lower interest rates and supply oodles of liquidity to markets to prevent a collapse. But it is precisely that, that sparked the great speculative bull market of almost everything, including stocks and housing, in 2009–2022. Before that it fueled the housing boom of the 2000s and the dot.com bubble of the late 1990s. Given the rise in interest rates and the contraction of money, not only is the stock market overvalued but so is the housing market and possibly many other assets as well.
The central banks and governments are running out of bullets. The next time creditors will pay as their debt is converted to equity. That’s the prime reason countries, including the U.S. and Canada now have bail-ins, on the legislative books to counter bail-outs. Massive debt is the reason.
Governments and central banks simply cannot afford to churn out money any longer. Still, hope prevails that, once again, central banks and governments will come to the rescue. The sense is that they are more afraid of the social unrest that would result from a steep recession (or depression) than they are of just simply printing more money. Maybe then it is no surprise that, despite zero percent interest rates and oodles of liquidity provided during the pandemic, we experienced a number of violent confrontations, including the so-called “Freedom Convoy” that occupied Ottawa, Canada for a few weeks in February 2022. The U.S. experienced an attempted coup on January 6, 2021. There are numerous other examples.
Social unrest has been dominant since the Great Recession of 2007–2009. Even the IMF has noted the rise in social unrest: see https://www.imf.org/en/Blogs/Articles/2022/05/20/social-unrest-is-rising-adding-to-risks-for-global-economy. There has been a rise in far-right governments. Add in the pressures from climate change and extreme weather events and we have the ingredients for the “mother” of all recessions. Protests have dominated countries like France, Chile, other Latin America countries, and the Middle East, particularly Algeria, Iran, Iraq, Lebanon, and Israel.
The Economist’s Economic Intelligence Unit (EIU) (www.eiu.com) has pointed out a number of problems where risk lies with emerging markets. They might as well extend it to households, corporations, and more. The EIU’s main points include the following:
- Rising global interest rates have increased debt servicing burdens, not just for emerging economies but all economies. Note how the U.S. interest payments are approaching $1 trillion annually
- The EIU identified six sovereign defaults in 2022 with more to come in 2023–2024
- Africa is the most vulnerable
- Asia also has problems in Sri Lanka and Pakistan
- Argentina and Ecuador are the riskiest countries in Latin America
- All countries face rising challenges. Note how the U.S. debt was downgraded to AA+ from AAA by Fitch following the debt ceiling battle of 2023
Six countries defaulted in 2022: Russia (artificially put there by the U.S.), Ukraine (U.S. and others are paying their bills and salaries), Belarus (all three are a part of the Russia/Ukraine war), Sri Lanka, Ghana, and Mali. Others on the brink or in deep trouble include Egypt, Ethiopia, Zambia, Kenya, Tunisia, Nigeria, Pakistan, Argentina, Ecuador, Venezuela, Cuba, and Turkey. EU countries have significant debt challenges, while Japan is constantly debt-challenged and has one of the highest federal debt/GDP in the world at an estimated 299%. The U.S. holds the world’s largest debt and is a deeply divided country as it heads into the 2024 election. None of that bodes well, especially against the background of massive debt for government, households, and corporations (financial and non-financial).
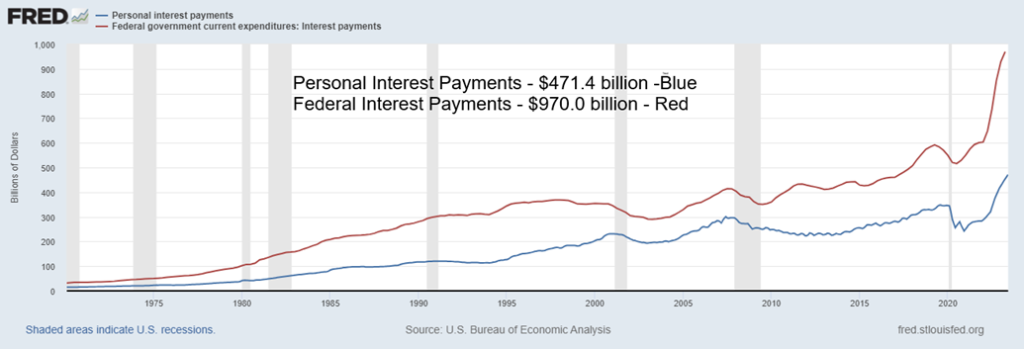
Note the chart below of both personal and federal government interest payments. After the pandemic of 2020 and the subsequent rise in interest rates starting in March 2022, interest payments have exploded to the upside. Personal interest (i.e. households) is up 78% since July 2020 and the federal government’s interest payments are up 88% in the same time period. All thanks to an explosion of debt since the pandemic. It is unlikely that this is sustainable, especially for personal debt. Governments can print more money. Households can’t.
Personal and Federal Interest Payments – 1970–2023
One of the biggest fears is the unraveling commercial real estate market. In China, the largest real estate developer Evergrande finally declared bankruptcy. Country Garden, the second largest, is not too far behind. More than 50 developers have defaulted. Years of unbridled growth, allowing companies to gorge themselves on debt, are finally catching up. China is falling into deflation, with the latest inflation rate at negative 0.3%. China tried to slow a housing bubble going into the pandemic but it’s actually backfiring, making things worse. The system is looking for a bailout but, instead, is only getting relaxed mortgage requirements. Between Evergrande and Country Garden, they employ almost 200,000 workers. China’s unemployment is growing, its balance of trade is slowing, and its budget deficit to GDP is growing, now almost equal to the pandemic high. Its manufacturing index is slipping into recession territory, retail sales have turned negative, and business and consumer confidence is waning. Student unrest is growing.
China is the world’s second-largest economy and, if it slips into a recession or even slows, it has global ramifications. Its military spending is growing. China is also the prime leader of the BRICS (Brazil, Russia, India, China, and South Africa) and is leading the way to forming alternatives to the U.S. dollar with a currency backed by gold. It is also leading the way in forming alternatives to the IMF, the World Bank, the SWIFT payments system and other global institutions dominated by the U.S. The BRICS have been meeting in South Africa. Its attempts to form an alternative currency to the U.S. dollar are still in the early stages, but many fear that de-dollarization will take hold as countries shift away from the U.S. dollar. Sanctions against Russia, China, and many others have numerous countries fearing that if they can do that to Russia and China, they could do it to them too. By banding together, they lessen the risk of U.S. sanctions.
The BRICS has invited others to join. On January 1, 2024, Saudi Arabia, Argentina, Ethiopia, Egypt, Iran, and the UAE will come on board. Note that a few—Argentina, Egypt, and Ethiopia—are on the potential default list. Nonetheless, the thought is that BRICS could become a challenge to the G7. BRICS and its new members would constitute 36% of global GDP and 46% of the globe’s population. Today, BRICS represents roughly 26% of
global GDP whereas the G7 represents 27%. It’s noteworthy that the revamped BRICS is to be two-tiered, and interesting that, including the new members, BRICS will now hold six of the top ten oil producers in the world. The only one missing is Indonesia. Why Indonesia was not included in the BRICS expansion and Egypt, Argentina, and Ethiopia were is a mystery.
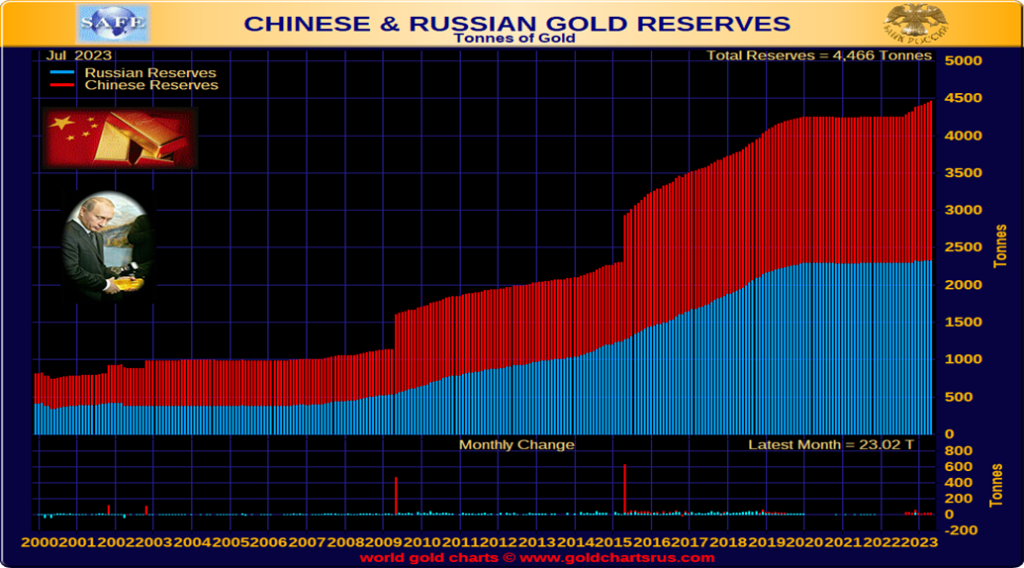
Russia and China have been the two largest buyers of gold to shore up their currencies over the past number of years. Note the sharp growth, particularly since 2015. We suspect the actual amount is higher for both Russia and China. Both are major gold producers, with China the world’s largest producer and Russia right behind Australia. Canada ranks fourth and the U.S. fifth. In terms of reserves in the ground, Russia holds the second largest and China is ninth.
In the U.S. and North America, the fear is the shaky commercial real estate loan market. In the U.S., the real estate loan market is estimated at $21 trillion. The question is, how much of it might be in trouble? In June 2022 some 5% of the market was in delinquency. We suspect that’s higher now. However, there is no real panic in the market. Many commercial mortgages are guaranteed by government agencies like Fannie Mae and Freddie Mac. Yes, the vacancy rate is higher than normal, but it has yet to cause a panic in the market. A big chunk of the market is multi-family apartments and many with tenants, etc. are generally sound, despite rising rents. The housing market in both the U.S. and Canada is overvalued and, by some estimates, the fear is that valuations have a lot further to fall. Some estimate that a fall of over 30% in both Canada and the U.S. is required to align the housing market more closely with income.
This past week was the annual gathering in Jackson Hole, Wyoming in the heart of the Teton Mountains. It’s the Fed’s annual meeting to discuss the broad direction of U.S. monetary policy. Fed Chair Powell spoke at the end and somewhat spooked the markets with his thoughts that inflation is still too high and more interest rate hikes could be on the agenda. Markets wobbled. Still the wide expectation is that next FOMC on September 19-20, 2023 will see rates left unchanged.
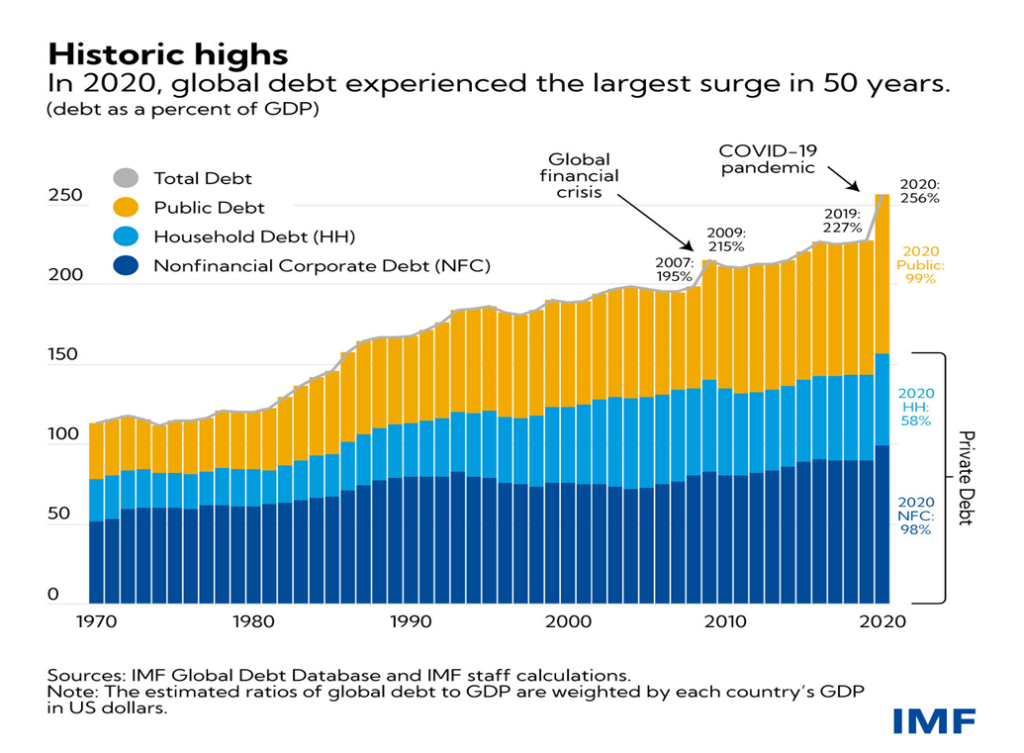
We conclude with a chart of global debt from the IMF (www.imf.org). The chart goes only to 2020, but it shows the surge of debt as a result of the pandemic. It is no surprise that the biggest growth took place in advanced economies and the U.S. in particular. It was followed closely by China. The question remains. It is not a question of, will we have another global debt crisis, it is a question of when. In 2020 global debt reached $226 trillion.
Now it is $305 trillion and still rising. No, this time is not different. Like the iceberg the Titanic ran into, only the tip at the top is visible.
Markets & Trends
| % Gains (Losses) Trends | ||||||||
| Close Dec 31/22 | Close Aug 25, 2023 | Week | YTD | Daily (Short Term) | Weekly (Intermediate) | Monthly (Long Term) | ||
| Stock Market Indices | ||||||||
| S&P 500 | 3,839.50 | 4405.71 | 0.8% | 14.8% | down | up | up | |
| Dow Jones Industrials | 33,147.25 | 34,346.9 | (0.5)% | 3.6% | down | up | up | |
| Dow Jones Transport | 13,391.91 | 15,614.94 | (0.6)% | 16.6% | down | up | up | |
| NASDAQ | 10,466.48 | 13,590.65 | 2.3% | 29.9% | down | up | up | |
| S&P/TSX Composite | 19,384.92 | 19,835.75 | 0.1% | 2.3% | down | up | up | |
| S&P/TSX Venture (CDNX) | 570.27 | 581.23 | (0.8)% | 1.9% | down | down | down | |
| S&P 600 (small) | 1,157.53 | 1,196.69 | (0.4)% | 3.4% | down | neutral | neutral | |
| MSCI World | 1,977.74 | 2,088.31 | 0.1% | 5.6% | down | neutral | neutral | |
| Bitcoin | 16,531.31 | 25,976.28 | (0.9)% | 57.9% | down | up | neutral | |
| Gold Mining Stock Indices | ||||||||
| Gold Bugs Index (HUI) | 229.75 | 221.00 | 3.1% | (3.8)% | down | down | down | |
| TSX Gold Index (TGD) | 277.68 | 268.91 | 3.4% | (3.2)% | down | down | down | |
| % | ||||||||
| U.S. 10-Year Treasury Bond yield | 3.88% | 4.23% | (0.5)% | 9.0% | ||||
| Cdn. 10-Year Bond CGB yield | 3.29% | 3.70% | (0.5)% | 12.5% | ||||
| Recession Watch Spreads | ||||||||
| U.S. 2-year 10-year Treasury spread | (0.55)% | (0.85% | (23.2)% | (54.5)% | ||||
| Cdn 2-year 10-year CGB spread | (0.76)% | (1.09)% | (4.8)% | (43.4)% | ||||
| Currencies | ||||||||
| US$ Index | 103.27 | 102.69 | 0.8% | (0.6)% | up | down (weak) | up (weak) | |
| Canadian $ | 73.92 | 73.58 | (0.4)% | (0.5)% | down | down | down | |
| Euro | 107.04 | 107.96 | (0.7)% | 0.9% | down | neutral | down (weak) | |
| Swiss Franc | 108.15 | 113.06 | (0.2)% | 4.5% | down | up | up | |
| British Pound | 120.96 | 125.86 | (1.2)% | 4.1% | down | up | neutral | |
| Japanese Yen | 76.27 | 68.29 | (0.7)% | (10.5)% | down | down | down | |
| Precious Metals | ||||||||
| Gold | 1,826.20 | 1,939.90 | 1.2% | 6.2% | down (weak) | neutral | up | |
| Silver | 24.04 | 24.23 | 6.6% | 0.8% | up (weak) | neutral | neutral | |
| Platinum | 1,082.90 | 948.20 | 3.6% | (12.4)% | up (weak) | down | down | |
| Base Metals | ||||||||
| Palladium | 1,798.00 | 1,229.10 | (2.5)% | (31.6)% | down | down | down | |
| Copper | 3.81 | 3.76 | 1.4% | (1.3)% | down (weak) | down | neutral | |
| Energy | ||||||||
| WTI Oil | 80.26 | 79.83 | (1.0)% | (0.5)% | up (weak) | up | up (weak) | |
| Nat Gas | 4.48 | 2.66 | 4.3% | (40.6)% | neutral | down (weak) | down | |
New highs/lows refer to new 52-week highs/lows and, in some cases, all-time highs.
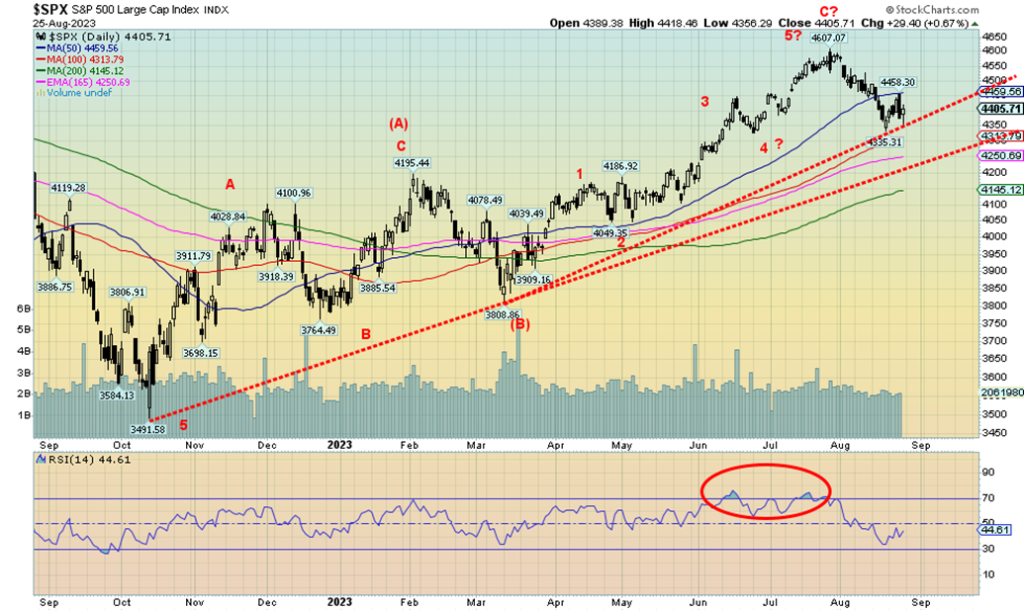
Has the stock market topped? We’ve pondered that question earlier. Then again, on Thursday August 24, the market opened slightly higher, reversed, and then closed sharply lower, putting in an outside reversal day. Not a positive sign. Reversal days are nothing new and they do have more significance if they come at a major top. What’s noteworthy is that the failure came at the 50-day MA as the market was trying to recover. The drop from the high of 4,607 was 5.5%. At this point, that’s just a correction within the context of an emerging bull. Or is it an emerging bull? After Thursday’s reversal, the market opened lower on Friday but rebounded and closed up on the day. So far, support at 4,350 has held.
Since the low in October 2022 the S&P 500 had risen almost 32%, a significant move that has everyone talking about the new bull market. Contrary to that belief, we view this as a correction to the decline that occurred from the major top in January 2022 to that low in October 2022. All of that has come against a backdrop of rising interest rates, falling money supply, and, the Fed running off its balance sheet. Since October 2022 the Fed funds rate has gone from 3.25% to 5.25%, M1 money supply has fallen $1.65 trillion or 8% while the Fed’s balance sheet has declined $605 billion or about 7%. Tightening? Yet the stock market has jumped 32%. And, surprisingly, GDP is also up over 4% on a nominal basis and 1.7% on an inflation-adjusted basis (real GDP). If money is the oil for the stock market, why is the market rising when it is no longer being oiled? In the past when this occurred the market didn’t rise; it fell, even if there was a delayed reaction.
4,300 is the new breakdown point. Actually, a break under 4,350 could start the drop but we’d await a break of 4,300 to confirm. The next confirmation comes under 4,200 and under 4,100 we could be beginning a new bear. A move back above 4,500 could keep this alive. But that is only confirmed if we make new highs above 4,607. We had a target of 4,800 and, so far, it has not been achieved. A failed target?
The market actually had some good news on Thursday when the weekly claims report came in 10,000 below the previous week. But durable goods orders were a big disappointment, coming in at negative 5.2% vs. a rise of 4.4% in June. The consensus was that durable goods would fall 4%, so falling 5.2% was a surprise. On a positive note, the weak durable goods number allowed the U.S. 10-year to fall to 4.21%, down from a recent peak of 4.34%.
While we view the market negatively at this time, we do need to await a break of the key points noted above to confirm that we are starting to break down. We have warned that the decline from January 2022 to October 2022 was the A wave decline and the recent rise from October 2022 to that peak in July 2023 is our B wave. Typically, the C wave decline is the biggest. The biggest C wave decline ever was the 86% decline from April 1930 to July 1932.
To summarize the week: the S&P 500 rose 0.8% but the Dow Jones Industrials (DJI) fell 0.5%, the Dow Jones Transportations (DJT) fell 0.6% but the NASDAQ rose 2.3%, thanks to new all-time highs for Nvidia, which was up 6.2%. Tesla also leaped, up 10.7%. The S&P 400 (Mid) was flat, but the S&P 600 fell 0.4%. The S&P 500 Equal Weight was also flat, but the NY FANG Index leaped 2.7%. Bitcoin fell under $26,000, losing 0.9%. Despite the rise for the S&P 500 and NASDAQ the Dow indices fell. A divergence.
In Canada, the TSX Composite was up a meager 0.1%, but the woes of the TSX Venture Exchange (CDNX) continued as it lost 0.8%. In the EU, the London FTSE was up 1.1%, the EuroNext rose 0.7%, the Paris CAC 40 was up 0.9%, and the German DAX gained 0.4%. In Asia, China’s Shanghai Index (SSEC) continued its recent woes on the back of the weakening Chinese economy, losing 2.2%, and is now down 0.8% on the year. The Tokyo Nikkei Dow (TKN) was up 0.6% while Hong Kong’s Hang Seng (HSI) was flat.
The big event this coming week is the U.S. job numbers on September 1. Unusual to be released on the 1st. Expectations are for nonfarm payrolls to be up 170,000/180,000 and unemployment (U3) to remain unchanged at 3.5%.
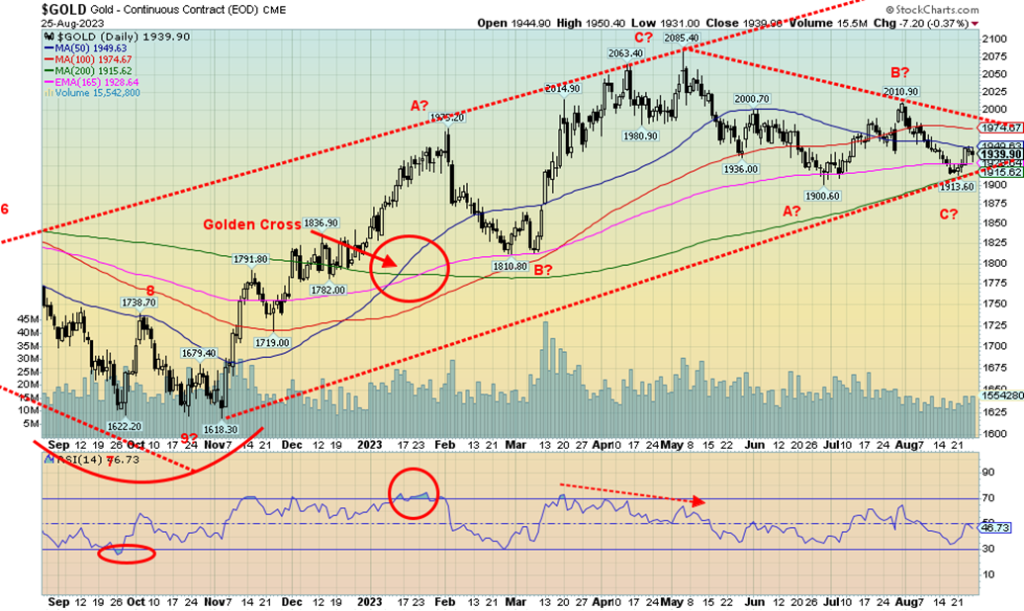
Gold bugs have to be the most frustrated investors in the world. They may go on and on about the state of the global economy, the state of global politics, the fear of recession, the shortages, particularly of silver, the ongoing buying of central banks, BRICS proposing to back the currency with gold and de-dollarization; yet gold to some extent, silver to a great extent, and the gold stocks to even greater extent remain mired. Yes, they showed some signs of life this past week as gold rose 1.2% and silver jumped 6.6%, while platinum was also up 3.6%. But sentiment is terrible. The Gold Miners Bullish Percent Index (BPGDM) has fallen to about 18%, the lowest level seen since September 2022 just before a decent rally got underway. By that measurement alone it could fall further. The junior mining market is, by many measurements, not just in the doldrums but, some would say, in a depression.
So, the jump this past week is encouraging, particularly the gain for silver. If we are to experience a good up move, we usually want to see both silver and the gold stocks leading. Grant you, the US$ Index has been strong, even if now it has become overbought. A reminder that overbought is merely a condition and not a guarantee that we are about to fall. However, it is usually a sign that we could be approaching a top.
Gold’s rise remains elusive. Will this one be the wave that takes it to new heights? We keep mentioning points that gold has to break through to convince we are going higher. Set aside those calling for $3,000 gold, $5,000 gold, $10,000 gold. That may sound good, but it’s also unrealistic unless we actually see signs that could happen. So far, we see none. Our first point of resistance is $1,950. We are there now and the odds do favour a breakthrough. Next up is $1,980/$2,000. That is more important. Above $2,050, the odds increase we’ll see new highs above $2,089 and even break through $2,100. Silver has been a huge laggard. While gold jumped to new all-time highs in August 2020 at $2,089, silver is well down from its high over $49.
As to the gold stocks, well, the all-time high for the TSX Gold Index (TGD) is 455 and for the Gold Bugs Index (HUI) 639. Except that was made in 2011. Here we are twelve years later and we remain down percentage-wise from that high for the TGD and down percentage-wise for the HUI. Misery is the owners of gold stocks. We won’t even mention the junior mining market where the TSX Venture Exchange (CDNX), comprised of at least 50% mining stocks, is down some 83% from its high in May 2007. That’s misery. We’re even down 76% from the 2011 high.
We have continued to note our long-term cycles for gold. The 7.83-year cycle (last seen in December 2015) and the 23.5-year cycle (last seen with the double bottom in 1999 and 2001) are both due, assuming they have not already been made. However, the only way we can prove that is new all-time highs above $2,100. Silver’s cycles are different as the two do not necessarily bottom and top at the same time. Since the two started trading in 1971, they have never made their lows together. For silver, its last major low was in March 2020, the pandemic low. That was a suspected 9.25-year cycle low, so the next one isn’t due until at least 2027–2031. And could it be a bearish cycle, meaning we won’t see new all-time highs? But if it’s bullish, we could once again challenge the highs of 1980 and 2011.
In the interim, all we can do is wait for a confirmation that our important cycle lows are in and the sentiment shifts.
A note on oil. WTI oil pulled back this past week as we had expected. The range $75/$77 should hold this drop as the fundamentals remain bullish. With six of the top ten producers in the world now becoming members of BRICS, could they put a squeeze on oil? That, of course, would not be good for the Western economies.
__
(Featured image by geralt via Pixabay)
DISCLAIMER: This article was written by a third party contributor and does not reflect the opinion of Born2Invest, its management, staff or its associates. Please review our disclaimer for more information.
This article may include forward-looking statements. These forward-looking statements generally are identified by the words “believe,” “project,” “estimate,” “become,” “plan,” “will,” and similar expressions. These forward-looking statements involve known and unknown risks as well as uncertainties, including those discussed in the following cautionary statements and elsewhere in this article and on this site. Although the Company may believe that its expectations are based on reasonable assumptions, the actual results that the Company may achieve may differ materially from any forward-looking statements, which reflect the opinions of the management of the Company only as of the date hereof. Additionally, please make sure to read these important disclosures.
Copyright David Chapman 2023
David Chapman is not a registered advisory service and is not an exempt market dealer (EMD) nor a licensed financial advisor. He does not and cannot give individualised market advice. David Chapman has worked in the financial industry for over 40 years including large financial corporations, banks, and investment dealers. The information in this newsletter is intended only for informational and educational purposes. It should not be construed as an offer, a solicitation of an offer or sale of any security. Every effort is made to provide accurate and complete information. However, we cannot guarantee that there will be no errors. We make no claims, promises or guarantees about the accuracy, completeness, or adequacy of the contents of this commentary and expressly disclaim liability for errors and omissions in the contents of this commentary. David Chapman will always use his best efforts to ensure the accuracy and timeliness of all information. The reader assumes all risk when trading in securities and David Chapman advises consulting a licensed professional financial advisor or portfolio manager such as Enriched Investing Incorporated before proceeding with any trade or idea presented in this newsletter. David Chapman may own shares in companies mentioned in this newsletter. Before making an investment, prospective investors should review each security’s offering documents which summarize the objectives, fees, expenses and associated risks. David Chapman shares his ideas and opinions for informational and educational purposes only and expects the reader to perform due diligence before considering a position in any security. That includes consulting with your own licensed professional financial advisor such as Enriched Investing Incorporated. Performance is not guaranteed, values change frequently, and past performance may not be repeated.


Ecobnb Turns Sustainable Tourism Into Measurable Impact
Ecobnb’s sustainable tourism platform generated significant environmental and social impact in 2025, avoiding 58,207 kg of CO₂ and adding 583...


Sugar Markets Balance Biofuel Demand and Global Supply
Sugar markets in New York and London were mostly unchanged as the Iran conflict renewed interest in biofuels. Drought concerns...


The $40 Trillion Trap: Disinflation Is Not Deliverance
U.S. debt has reached $40 trillion, with $24 billion weekly interest, while deficits accelerate. Despite disinflation in CPI, from cooling...


FinTech Matures as AI and Infrastructure Drive the Next Growth Phase
Fintech markets are entering a mature phase, shifting from rapid growth to consolidation, specialization, and sustainable business models. Zurich and...


Bitcoin, and Ethereum Rise, While Cardano Enters Transition
Bitcoin and Ethereum posted modest weekend gains, supported by ETF inflows. A new proposal may protect Bitcoin from quantum threats....
 |
|
 |  |
 |
|
-

 Africa1 week ago
Morocco Cuts Card Fees to Spur Digital Payments, but Uncertainty Remains
-

 Markets2 weeks ago
Rice Prices Rise as Supply Outlook Tightens and Demand Stays Mixed
-

 Cannabis6 days ago
Virginia Cannabis Market Could Reshape Regional Competition
-

 Biotech2 weeks ago
BIP Sells BIC Incubator to Innova, Refocuses on Core Innovation Areas