Markets
Personal Income, Consumer & Corporate Debt
I haven’t covered consumer debt and personal income for a few years. As of June 2023, consumer debt has increased by a factor of 102.06 from where it was in January 1959. That seems like a huge increase in consumer debt, and it is, especially when considering personal income, the source used to service consumer debt, has increased by a factor of only 58.29 since 1959.

The Dow Jones closed the week just short of closing in scoring position (-0.01% to -4.99%). Looking at the Dow Jones from its lows of last autumn (chart below), its upward trend remains intact. But that isn’t the same as saying the Dow Jones will be making a new BEV Zero anytime soon, though it may.
I still believe its last all-time high of January 2022, will prove to be Terminal Zero (TZ), the last all-time high of a massive advance that began in August 1982, when the Dow Jones last closed below 800, to where it advanced to 36,799 forty-years later in January 2022.
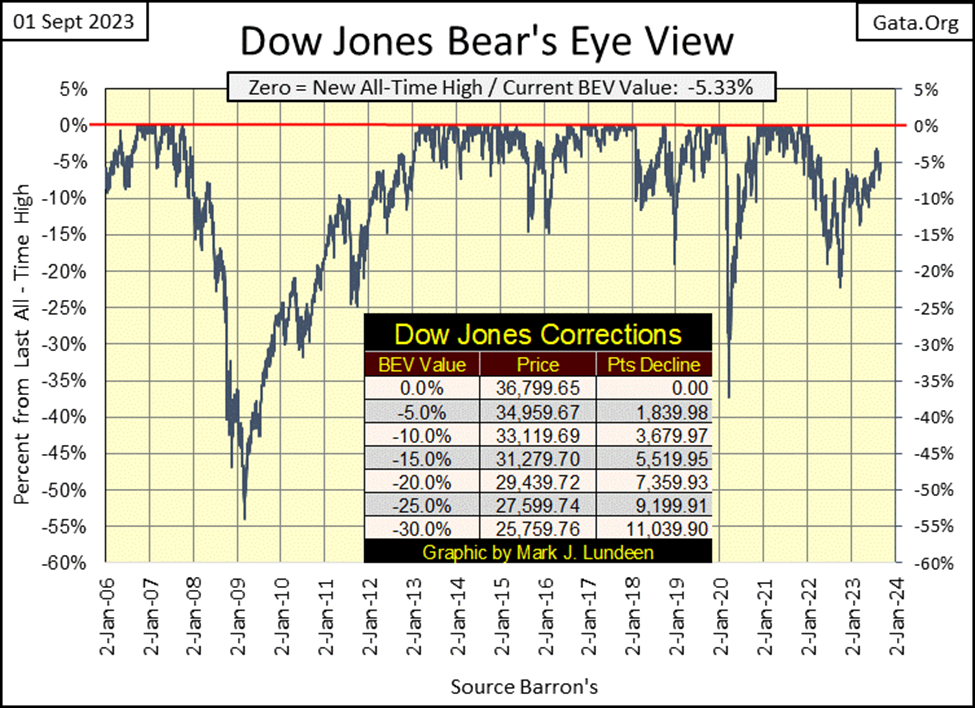
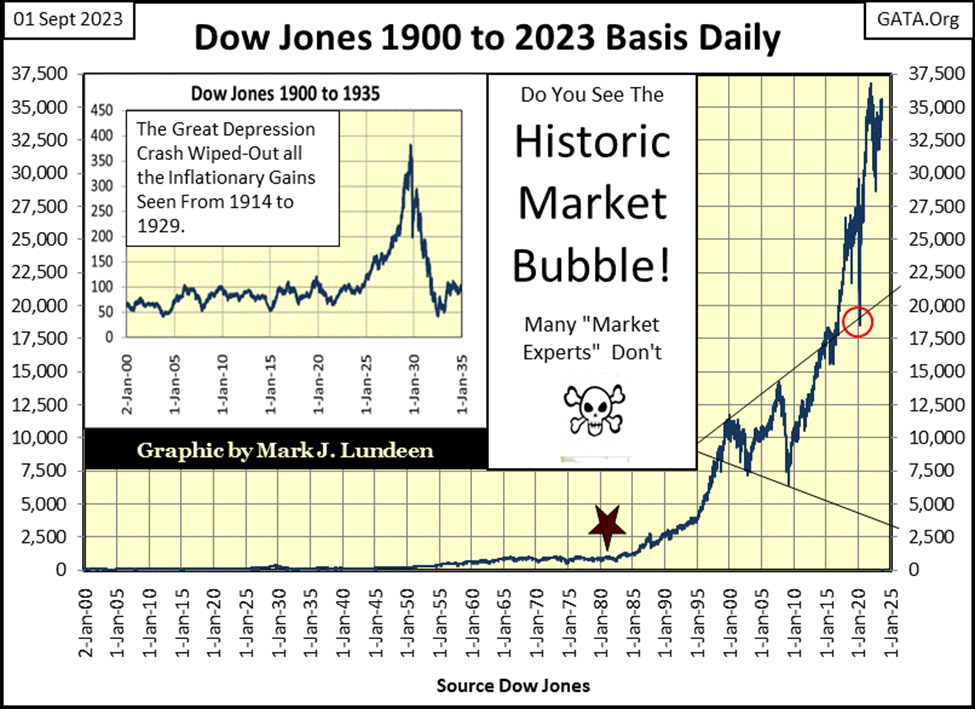
Even if I’m wrong, should the Dow Jones see additional BEV Zeros in its BEV chart above, that doesn’t change anything. Look at the chart below; the gains the Dow Jones has seen since August 1982 (Red Star), to its last all-time high of January 2022. Reasonable people understand how at the current valuation, the Dow Jones, my proxy for the broad stock market, is all risk, and no reward. Exiting this market, and not coming back until Mr Bear has clawed back current valuations by 50%, or more, is only an act of prudence.
Geeze Louise, what a chart! I couldn’t in good conscience tell anyone to buy the stock market today. What I can do, is tell people to get out, and stay out for as long as it takes for this bubble in the stock market to go bust. Stay out until the Dow Jones once again sees a dividend yield of something over 6%, or even a yield of 7% or 8%.
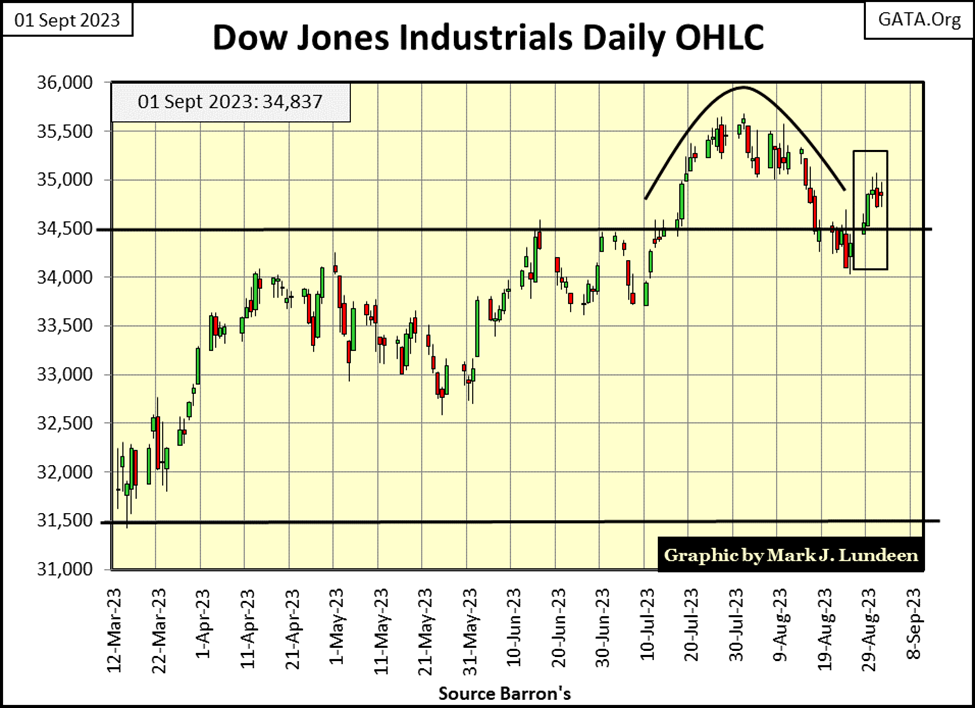
If the Dow Jones is destined to collapse by over 50%, it didn’t start collapsing this week, as seen in the chart below. The Dow Jones did close the week over 34,500, but the advance was due to one strong day; Tuesday. The other four trading days were weak.
Should the Dow Jones fail to advance towards its 35,500 line in the chart below, but instead retreat back down under its 34,500 line in the coming weeks, it should mean something. In fact, it doesn’t mean anything, one way or the other. Why? Because like everything else, the stock market is a regulated market, and right now the market’s “regulators” seem happy playing tennis with the Dow Jones between its 35,000 and 34,000 lines.
When I was five years old, I believed in Santa Claus. When I was thirty-five years old, I believed in the stock market, but that was decades ago. I now believe we live in a terrible world, where the scum of the Earth, rising from academia, have clawed their way to the top. These brilliant people, and they are gifted people, people who take every opportunity to behave despicably toward those they see as their inferiors, now control most aspects in our lives, including the valuation of the Dow Jones.
Don’t take the above as an indication that I’ve become hopeless. I’m very optimistic about the future, as God will ultimately win, and the “policy makers” lose. But between that day and now, there will be much drama to be observed in the markets, and elsewhere. As an old geezer, I’d like the drama to begin sooner rather than later, for fear of missing some of the action.
So, seeing the Dow Jones just go back and forth between 34,000 and 35,000, instead of soaring higher, or crashing back down to 1000, is a source of frustration for an old retired Navy Chief, such as myself. Perhaps, should CNBC show some videos of market miscreants getting a taste of the cat-o-nine-tails, or a good keelhauling at the USS Intrepid CV-11, conveniently berthed in Manhattan’s Hudson River, I may begin watching CNBC again.
But no, they won’t do that for me, or anyone else. Instead, the financial media will continue promoting hot stocks, and can’t miss opportunities to the unwary, like carnival barkers at a state fair, drawing the suckers in. I’m just weary of all their nonsense.
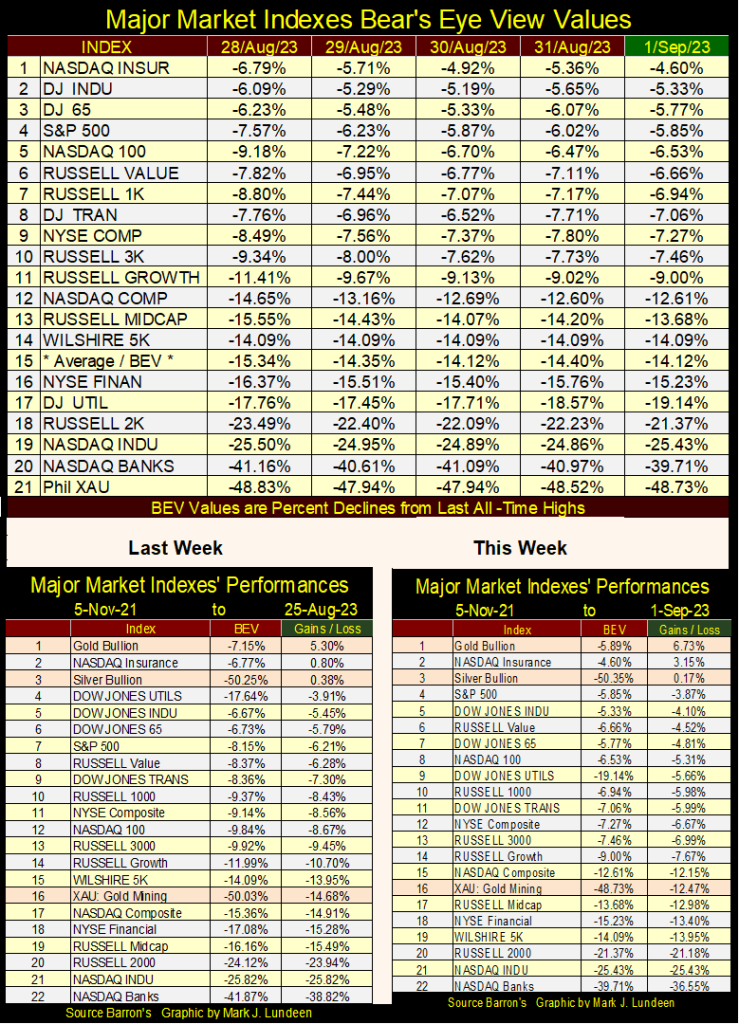
Looking at the BEVs for major stock indexes I follow in the table below, the NASDAQ Insurance Index closed in scoring position twice last week; nothing else did. When was the last time any of these indexes saw a BEV Zero? Not since April 2022, or maybe before.
Inflation has been in the news since 2021, so what have commodity prices done these past few years? As seen in the indexed average of the 22 commodity prices I follow on a weekly basis below, they’ve peaked at 4.5 in February 2022, and closed last week at just under 3.5. This indexed average is down about 22% in the past eighteen months, making the current decline a nice correction within a continuing bull market.
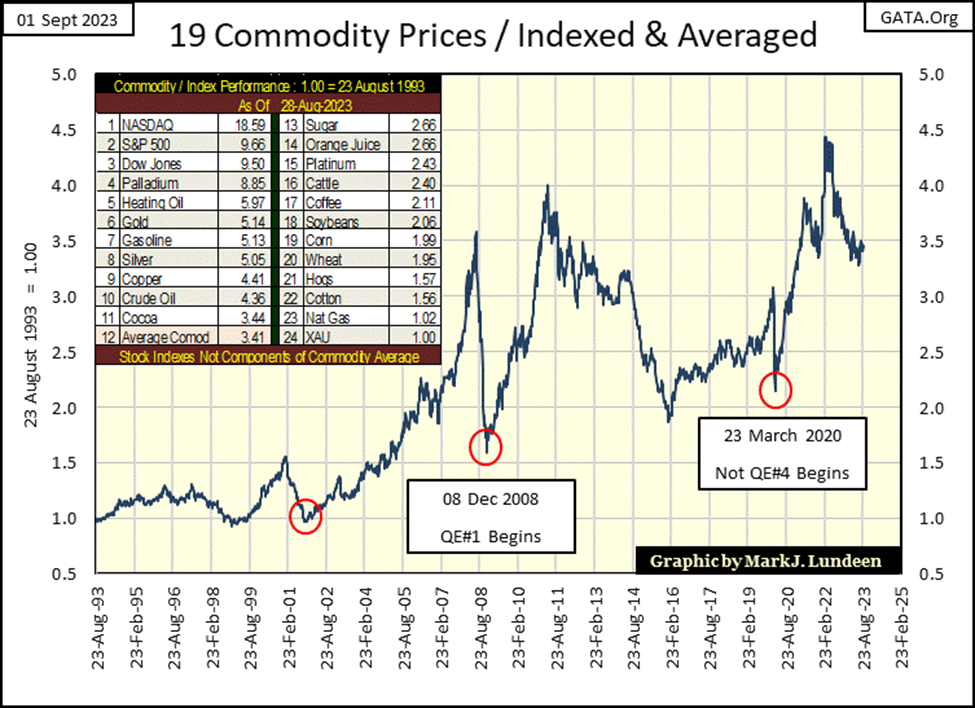
Something of interest can be seen in the chart above (Three Red Circles). The far-left circle happened during the 2000-2002 NASDAQ High-Tech bust, a deflationary market event by anyone’s definition. A year later (November 2002), then Federal Reserve Governor, future Idiot Primate FOMC; Ben Bernanke said the following at a widely reported event at the National Economists Club.
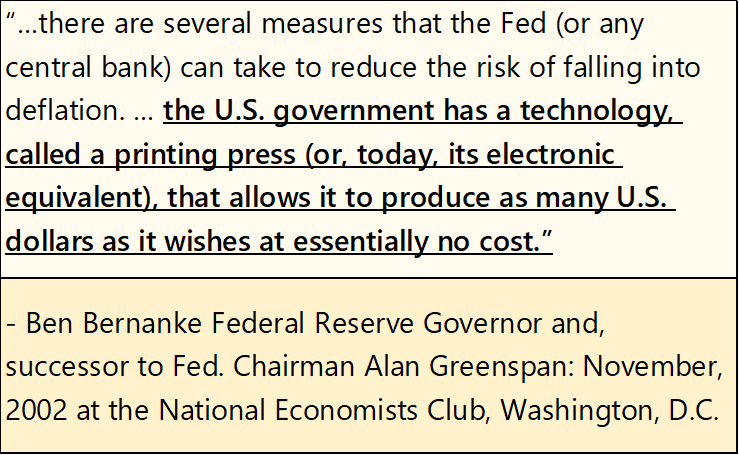
In November 2002, the investing public, which included most people, were in shock following the bottom of the NASDAQ High-Tech a month earlier. This speech by Bernanke received much coverage in the news media, as Bernanke was in fact promising to hunt bears on Wall Street to extinction.
Back to the chart above, the synchronizing between this November 2002 comment and the turn in commodity prices in November 2001 isn’t perfect, but interesting.
The middle circle identifies the December 2008 bottom in the commodity price bust, which occurred during the subprime mortgage bust. The following reversal in commodity prices matches up nicely with the beginning of Doctor Bernanke’s QE#1, where the good doctor took full advantage of the “technology called a printing press” mentioned in his quote above, how best to reflate market valuations.
The far-right circle lines up with the bottom of the March 2020 flash crash, and the implementation of Idiot Primate FOMC, Powell’s massive Not QE#4.
So Mark, what is the point you’re trying to make here? Just that idiots from the FOMC, both common idiots and idiot primates, don’t always lie to the public. In Bernanke’s quote above, promising to fight valuation deflation with monetary inflation, that was certainly true. And then there is Fed Vice-Chairman; Alan Blinder’s admitting the obvious below.
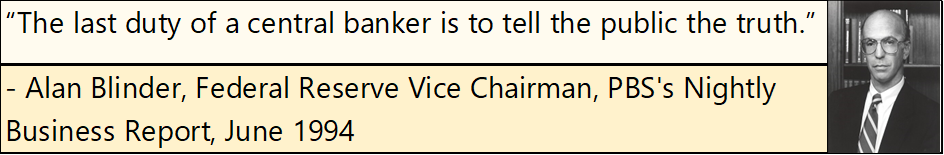
I remember Blinder saying that on PBS’s Nightly Business Report, just one of many MSM outlets the then-new Federal Reserve Vice Chairman used to inform the world that; the FOMC has no moral obligation to tell the public the truth about this, that, or the other thing concerning “monetary policy.”
It’s not just me saying this. Reading former Chairman of the House of Representatives’ Financial Services (Banking) Committee; Henry B Gonzalez’s book; Deception and Abuse at the Fed, Vice-Chair Blinder earned some distinction in deceiving the US Congress too, as per Chairman Gonzalez.
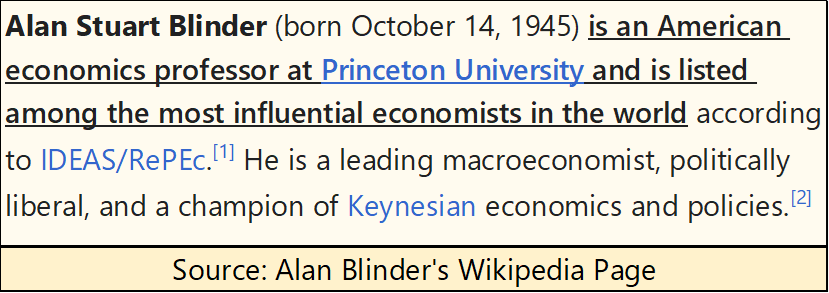
The reaction from the media’s news outlets to Blinder’s comments was very interesting. Stunned by the brilliance of this professor from Princeton University (box below), the moderators sat there in awe, saying nothing as Professor Blinder promised to lie to them too.
I’m not a fan of consumer debt. I have a major credit card, and I use it. However, I pay the full balance at the end of the month. I’ve had this card since 1994, and since they issued it to me, Bank XYZ hasn’t earned a penny of interest from me for thirty years.
If I have to purchase something, even big-ticket items like a new washer/dryer, or even a new car, if I can’t write a check to pay for it, I make do with what I have, until I can write a check for it. That is called “living within one’s means.” At times that created hardships for me, and it’s apparent that everyone around me has more and newer consumer goods than I do. But knowing I wasn’t using my income to service debts to the bank made it all worthwhile.
So, what is my problem with consumer debt? Consumer debt is consumptive debt, profitable only to the bank that issues it. People in their 20ies who begin a lifelong habit of “buying now / paying later,” risk paying a big price later in life. As there is nothing worse than poverty in one’s old age, its best to spend one’s younger years saving surpluses, for later in life.
That is just me. But what about normal people?
I haven’t covered consumer debt and personal income for a few years, so this is a good time to review these data series. First, some commentary on the chart below. The data plots are indexed to January 1959 = 1.00, though actually in January 1959, consumer debt was $48.96 billion, and personal income was $391.80 billion. I listed the actual data in billions of dollars for January 1959 and June 2023 on the table in the chart inserted to the upper left.
Don’t think of these indexed plots below in terms of billions of dollars, but as multiples of consumer debt and personal income from January 1959. For instance, when these indexed plots below reached 10.0, consumer debt and personal income had increased by a factor of 10, or 10 times what they were in January 1959; something that happened in the 1980s.
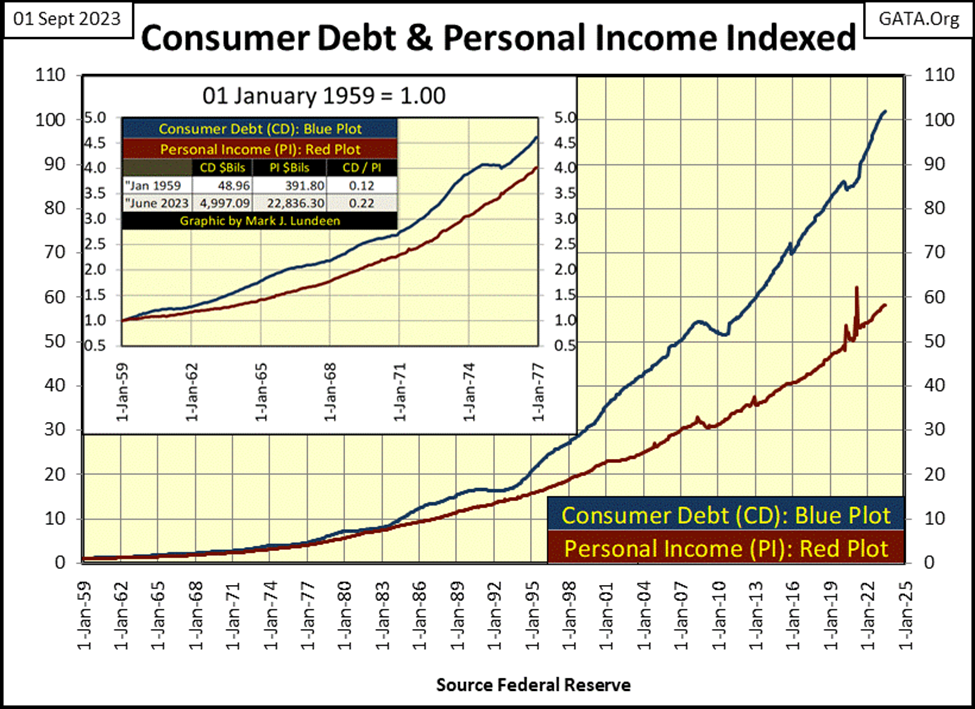
As of June 2023, consumer debt has increased by a factor of 102.06 from where it was in January 1959. That seems like a huge increase in consumer debt, and it is, especially when considering personal income, the source used to service consumer debt, has increased by a factor of only 58.29 since 1959.
How best to understand what’s on display above; the growing gap between consumer debt and personal income. I think the following quote from Earnest Hemmingway is appropriate; we’re looking at the American middleclass in their “gradually going bankrupt” phase.
When the middle-class enters their “suddenly going bankrupt” phase, it will be interesting to see how the plots above respond to the credit crisis (massive defaults) that follows.
Below, I’ve plotted consumer debt with corporate debt. As with the chart above, the plots are indexed, making them multiples of the values seen for October 1945, seen in the chart inserted on the upper left of the chart.
And as with personal income above, consumer debt below is increasing at a much higher rate than is corporate debt below. In October 1945, for each $1.00 of consumer debt, there was $4.05 of corporate debt (see table). As of March 2023 (the latest data), there is now only $1.56 dollars of corporate debt for every $1.00 of consumer debt.
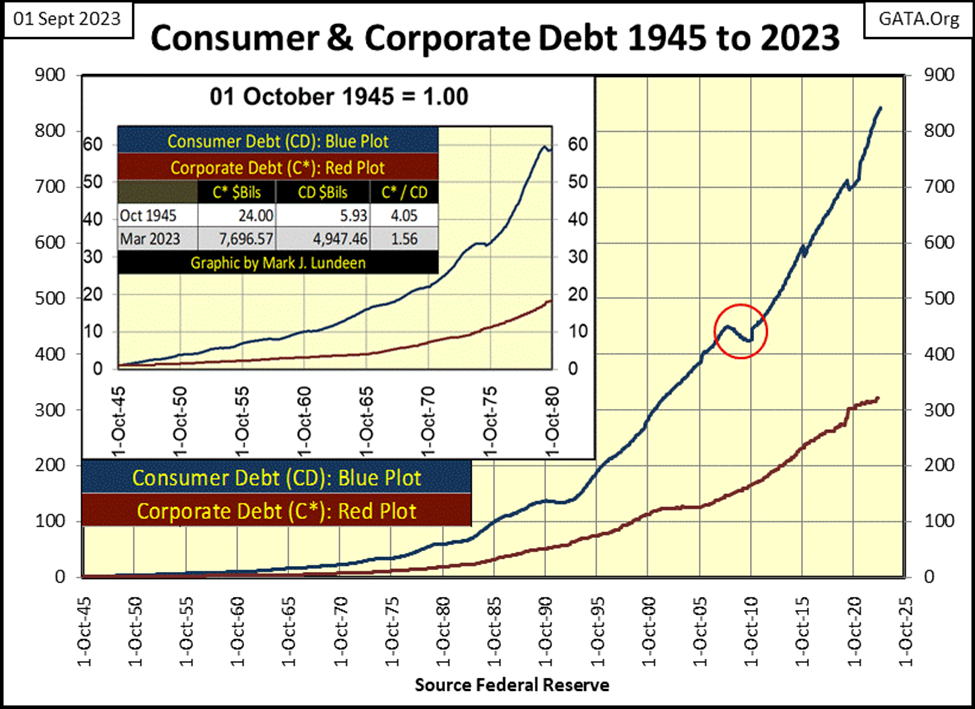
Okay, so what? Well, it’s a BIG So What! Unlike corporate debt, consumer debt is consumptive debt, used to finance moments of pleasure, or consumer goods destined to be deposited into recycling centers and waste dump sites. The only economic benefit for consumer debt, is to the bottom line of the banking system that issues credit to consumers, people who are consuming their future, for who knows what today?
Corporate debt is totally different, as it is debt that provides real economic value to the economy. Corporate debt finances infrastructure, or inventories, or something of economic value, that eventually pays off the debt that created it, leaving a residue called PROFIT to the corporation, that took the debt burden on.
That consumptive consumer debt has increased so much more than economically profitable corporate debt since 1945, is probably a major factor why the FOMC has had to “stabilize” their banking system so frequently since 1971.
Still, all debts today are taken on with the post-Bretton Woods’ dollar, dollars with no precise legal definition, that the old $35 gold peg once gave money. If I were to define the post-Bretton Woods dollar, I’d call it dollars whose only limitations are the willingness of people, governments, and corporations to assume debt, and debt increases that are only possible as there are no limits to the dollars that make them possible.
Though the dollars produced by the banking system to create debt are created effortlessly, the work required within the economy to service these debts is not. Currently, most people and all too many businesses work to service their debts to the banking system, leaving less and less to those who labor.
Considering the above; how profitable has the increase in corporate debt since 1945 been? That is a good question, a question I don’t know if I have a good answer to. But what I can do is look at the earnings and dividend payouts for the Dow Jones in October 1945, along with corporate debt, and see how much they’ve increased by March 2023 in the table below.
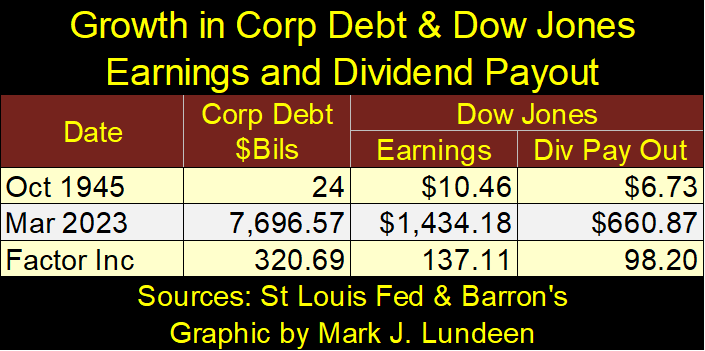
For what it is worth, increases in corporate debt above far exceeds any gains in earnings, and dividend payout for the Dow Jones. Is that bad? Well, I don’t think it’s good, as what we see above suggest that growth in corporate debt, is not as profitable as it once was. If so, that is not good.
Time to look at gold’s BEV chart below. Gold moved away from its BEV -10% line this week, closing not far from its BEV -5% line, which is good.
What else is there to say? We’ve been over gold’s BEV chart many times before. Since gold’s Terminal Zero (TZ) of August 2011, where it then deflated down to its BEV -45% line in December 2015, and hasn’t been anywhere near it since then.
Gold’s next TZ (last all-time high of an advance) was in August 2020, and so far, the COMEX goons could drive gold down only to its BEV -20% line last October. For 2023, gold attempted to make a new BEV Zero on May 4th, missed it by only 0.56%. Following that, the bears so far have only driven gold down to its BEV -7.5% line.
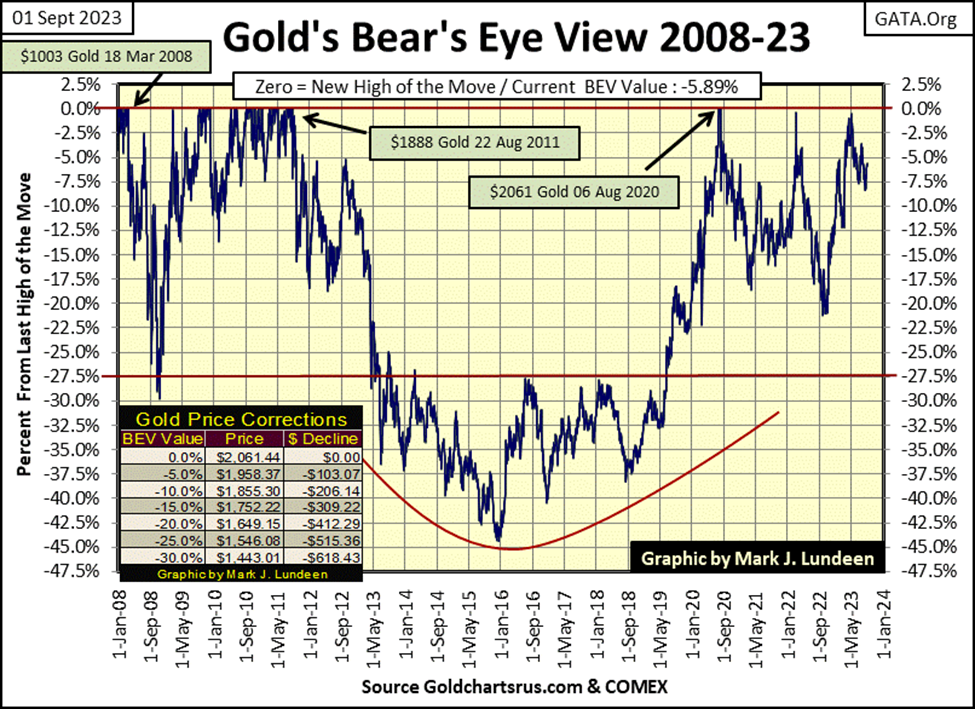
That is quite a difference compared to the 45% clawback following gold’s August 2011 TZ, or the 22% clawback following gold’s August 2020 TZ. What are we to make of this? Maybe something like; if the bears can’t drag the price of gold down below its BEV -10% line, possibility it’s time for the bulls to finally drive the price of gold above its last all-time highs of August 2020; $2,061.
But will the gold bulls get that done? I’ll tell you all about that in about three weeks’ time.
As far as gold’s and the Dow Jones’ step sum tables below goes, not much new going on there either – EXCEPT THAT – both gold’s and the Dow Jones’ daily volatility’s 200D M/A continue falling. So what?
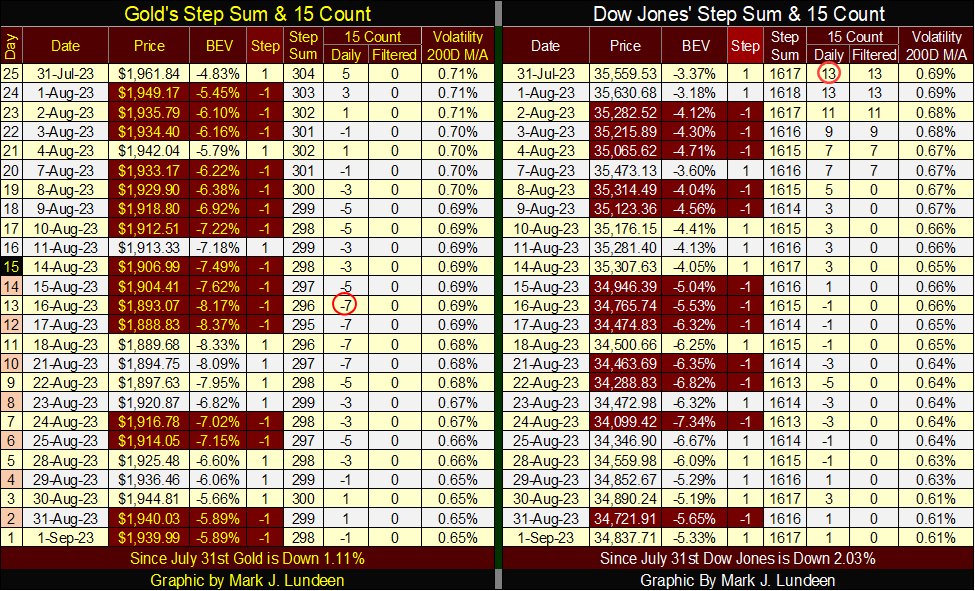
It’s just that they’ve both been declining for a long time now, and neither are destined to decline to 0%. So, sometime in the not-too-distant future, I’m thinking daily volatility for both gold and the Dow Jones will bottom, and then turn back up.
For gold, an increase in daily volatility should be a very positive development. But that would not be the case for the Dow Jones. Since 1885, a time when high-tech was morse code over a telegraph wire and steam locomotives were looked on in awe, seeing this metric in daily volatility for the Dow Jones rise above 1.00% has been a VERY bearish development. That isn’t going to change the next time the Dow Jones sees its daily volatility’s 200D M/A rise to, and then exceed its 1.00% level.
But Mark, when is that going to happen? As the stock market is a “regulated market,” I haven’t a clue about the when just that one day it will. Until that day arrives, and most likely for a long time following it, you’ll find me up here in the markets’ peanut gallery, betting beer and hotdogs on what the market will do next. But I choose to not expose my wealth on the broad stock market, as until the Dow Jones once again sees a dividend yield of something greater than 6%, the market is more risk than reward. A situation I choose to avoid.
__
(Featured image by Mimzy via Pixabay)
DISCLAIMER: This article was written by a third party contributor and does not reflect the opinion of Born2Invest, its management, staff or its associates. Please review our disclaimer for more information.
This article may include forward-looking statements. These forward-looking statements generally are identified by the words “believe,” “project,” “estimate,” “become,” “plan,” “will,” and similar expressions. These forward-looking statements involve known and unknown risks as well as uncertainties, including those discussed in the following cautionary statements and elsewhere in this article and on this site. Although the Company may believe that its expectations are based on reasonable assumptions, the actual results that the Company may achieve may differ materially from any forward-looking statements, which reflect the opinions of the management of the Company only as of the date hereof. Additionally, please make sure to read these important disclosures.


Ecobnb Turns Sustainable Tourism Into Measurable Impact
Ecobnb’s sustainable tourism platform generated significant environmental and social impact in 2025, avoiding 58,207 kg of CO₂ and adding 583...


Sugar Markets Balance Biofuel Demand and Global Supply
Sugar markets in New York and London were mostly unchanged as the Iran conflict renewed interest in biofuels. Drought concerns...


The $40 Trillion Trap: Disinflation Is Not Deliverance
U.S. debt has reached $40 trillion, with $24 billion weekly interest, while deficits accelerate. Despite disinflation in CPI, from cooling...


FinTech Matures as AI and Infrastructure Drive the Next Growth Phase
Fintech markets are entering a mature phase, shifting from rapid growth to consolidation, specialization, and sustainable business models. Zurich and...


Bitcoin, and Ethereum Rise, While Cardano Enters Transition
Bitcoin and Ethereum posted modest weekend gains, supported by ETF inflows. A new proposal may protect Bitcoin from quantum threats....
 |
|
 |  |
 |
|
-

 Biotech2 weeks ago
BIP Sells BIC Incubator to Innova, Refocuses on Core Innovation Areas
-
 Impact Investing17 hours ago
Ecobnb Turns Sustainable Tourism Into Measurable Impact
-

 Fintech1 week ago
Robinhood Chain Surges with Rapid Adoption and Billion-Dollar Trading Volume
-

 Cannabis2 weeks ago
Virginia’s Cannabis Journey: A Lesson in Why Legalization Requires More Than a Law