Featured
Dividend payouts are under pressure: That’s not good
The last time monetary inflation did flow directly into gold and silver valuations annual CPI inflation increased to over 15%. The US Treasury issued a 20yr bond with a 15% coupon and the FOMC increased its Fed Funds Rate to 21% to stop inflation in commodity prices. Until now, what has benefited directly from these flows of inflation were financial assets such as stocks, bonds and real estate.

This week (circle below) the Dow Jones’ daily closes were within 1.30% of each other, as the 24,750 line of resistance held against the bulls’ second assault against it in a month.
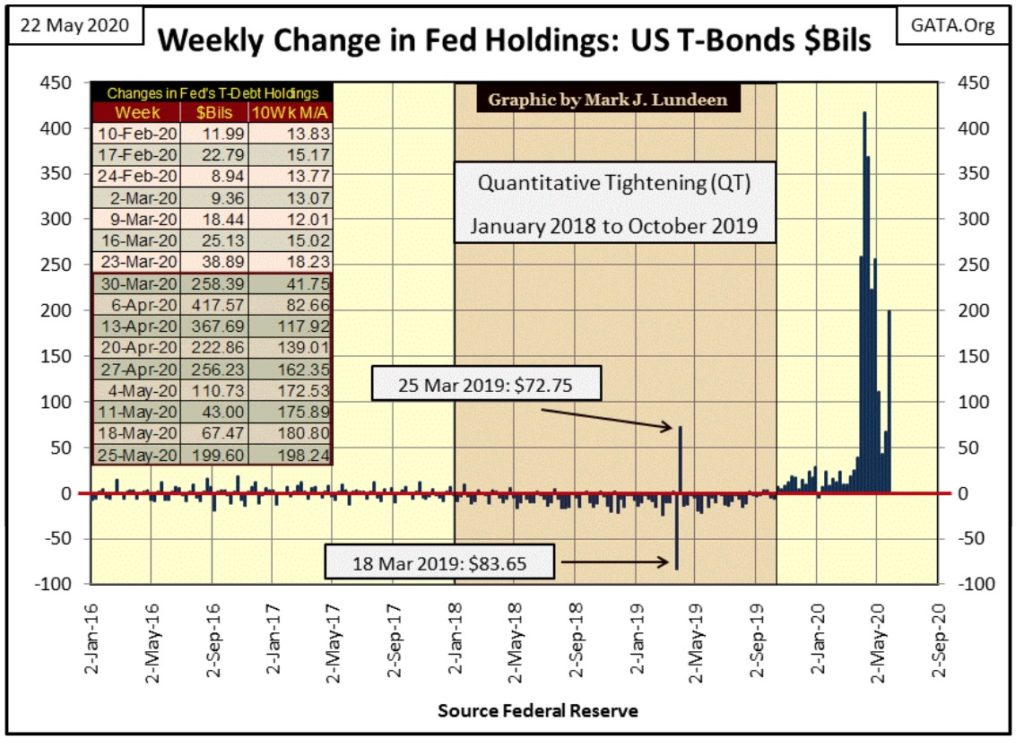
I inserted my table for the weekly changes of US T-debt holdings in the Federal Reserve’s balance sheet in the chart below. Looking at the $Bils column, beginning in May until this week, the FOMC had “injected” less “liquidity” into the financial system than it had from late March to late April. The timing of this “monetary moderation” corresponds with the Dow Jones 24,750 level becoming a line of resistance and I don’t think this is a coincidence.
I continue believing if left to its own devices, the Dow Jones (my proxy for the broad stock market) would rather go down than up; much farther down. However, whenever the Dow Jones does begin to deflate, the FOMC “injects sufficient liquidity” into the financial system to “stabilize market valuations.” As I see it, they are only forestalling the inevitable valuation collapse in today’s obscenely-bloated financial markets.
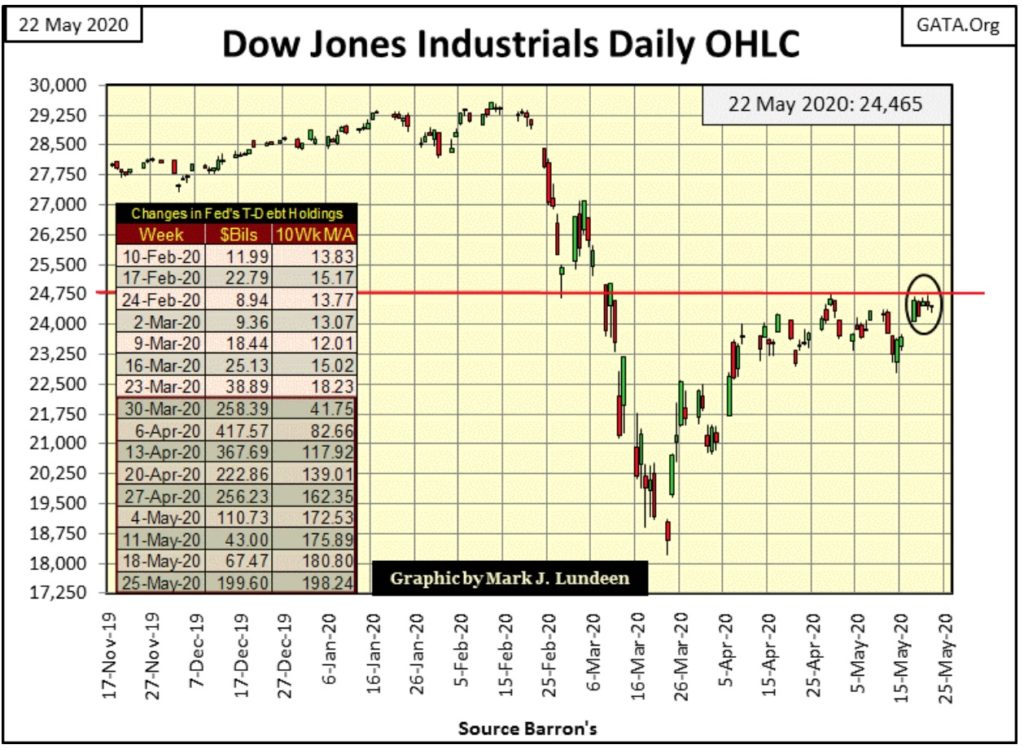
So, this is the battle between Mr Bear and the “policy makers”; with Mr Bear representing what natural market forces would naturally do in a market whose valuations have been inflated to obscene levels. And the FOMC, representing the idiot savants who inflated market valuations to obscene levels in the first place, now believe they can hold off Mr Bear’s deflationary forces with ever larger “injections of liquidity.”
Question: In the table above how long will the April 6th’s $417.57 billion dollar “injection” remain the all-time high? I can’t give you a date, but I can tell you when the FOMC will exceed this “injection” of monetary inflation; the next time the Dow Jones threatens to break below its low of March 23rd: 18,591.
In the Dow Jones’ BEV chart below, the story is much the same. Except we’re looking at its BEV -17.5% line (24,380), which the Dow Jones has broken above twice, as well as closed the week above. But these advances above this critical line of resistance so far have been feeble, so I’m not moving on just yet.
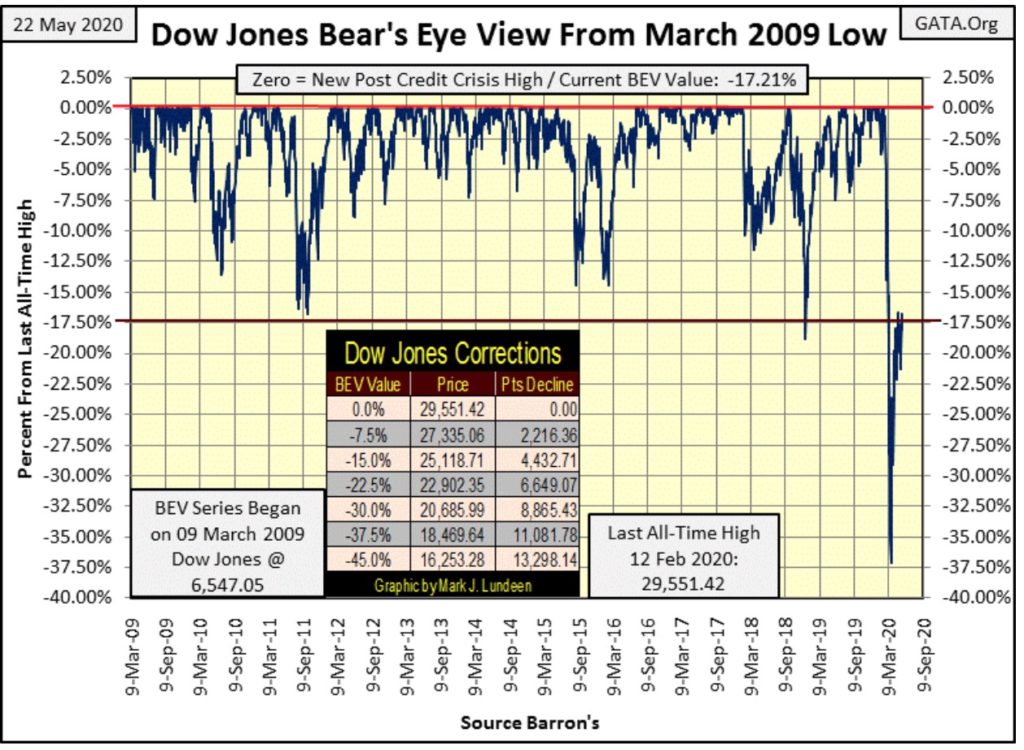
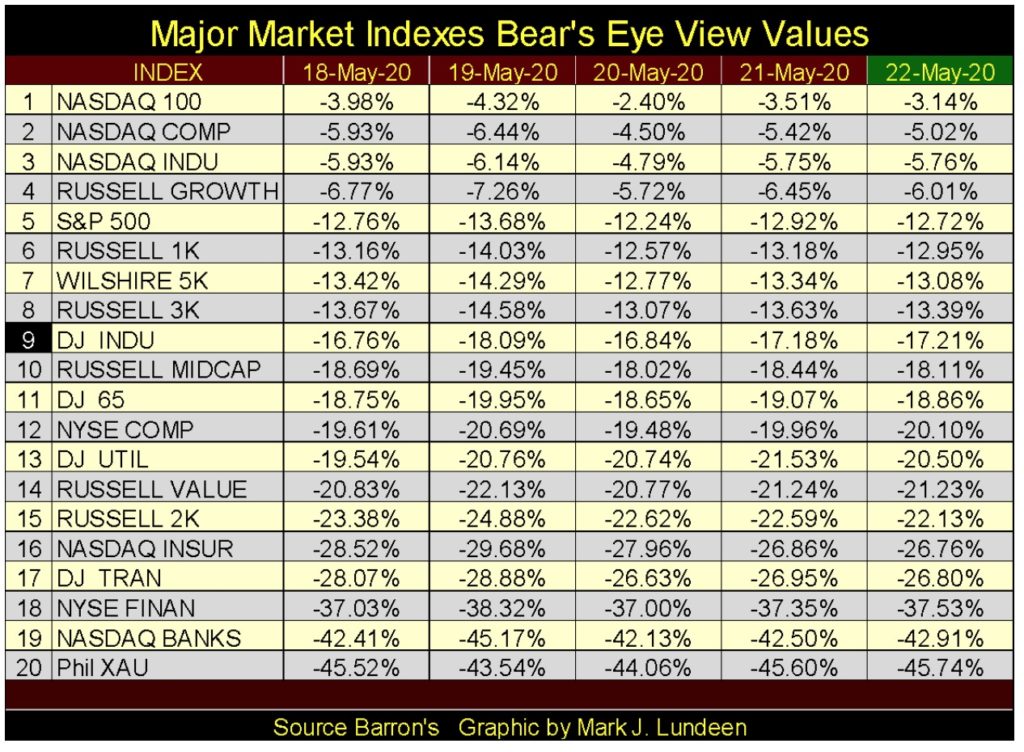
Here are the weekly closing BEV values for the major market indexes I follow in the following table. Four of them are in single digit BEV values, with three of them in scoring position (5% from a BEV Zero). For the NASDAQ 100 Index, I expect it will see a new all-time high sometime next week or the following.
But the financial indexes (#18 &19) are lagging the others, and that’s not good.
What about the XAU (#20: gold mining)? When the “policy makers’” grasp on the financial system begins to weaken, it will be shocking how fast the XAU index, as well as the price of gold and silver bullion can advance.
Why would that be? Because when the many trillions of dollars the “policy makers” have “injected” into the financial system since the 2007-09 credit crisis, and even long before that begin to feel deflation, the owners of these dollars, if they value their wealth, will flee deflation in the financial system, and seek inflation elsewhere such as in commodities and precious metals. It will be a near replay of the 1970s; rising CPI inflation, interest rates, bond yields and commodity prices as financial assets struggle.
Remember; inflation from the Federal Reserve doesn’t flow directly into precious metal assets. When it does, as in the 1970s, central banks will do whatever it takes to stop it.
The last time monetary inflation did flow directly into gold and silver valuations annual CPI inflation increased to over 15%. The US Treasury issued a 20yr bond with a 15% coupon and the FOMC increased its Fed Funds Rate to 21% to stop inflation in commodity prices.
Beginning in the early 1980s until now, what has benefited directly from these flows of inflation were financial assets such as stocks, bonds and real estate. When these overpriced assets begin to deflate, money will flee these markets’ declining prices and once again flow into gold and silver valuations.
I realize the market has calmed down considerably in May. But so far in this bear market, only in Week 11 has it been free of extreme market events (see Mr Bear’s Report card below);
- Dow Jones 2% days / Days of Extreme Market Volatility
- NYSE 70% A-D / Days of Extreme Market Breadth
Mr Bear may not now be actively clawing back market valuation from the bulls, but the market is still feeling his hot breath on the back of its neck.
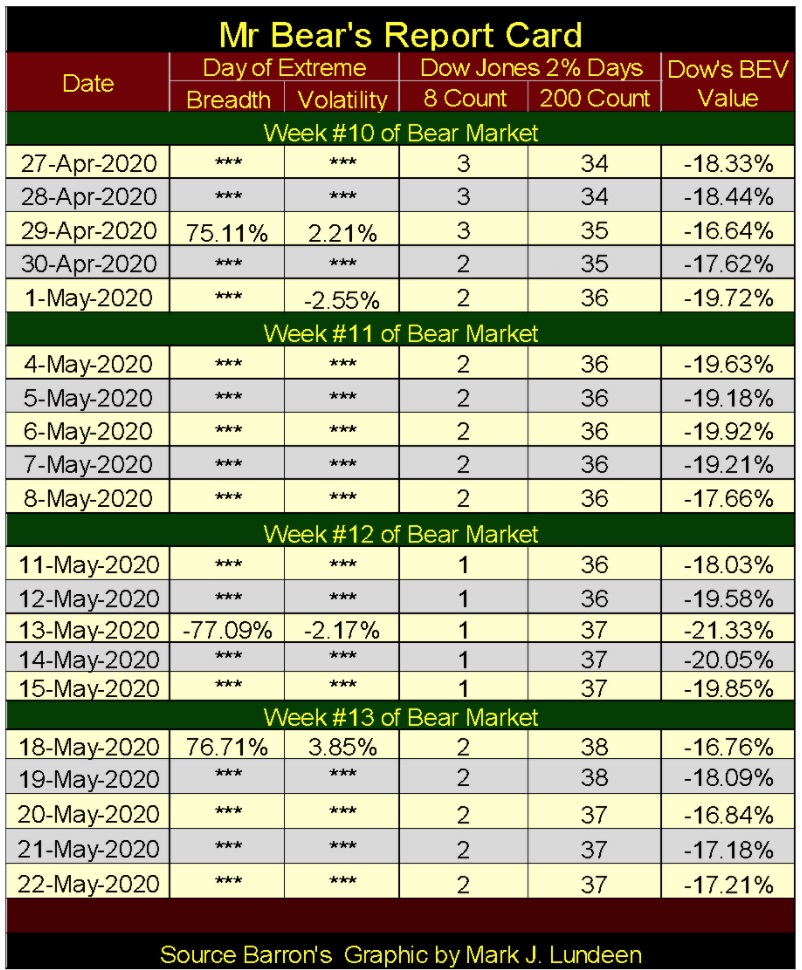
Moving on to the Dow Jones counts of its 2% daily moves (Days of Extreme Volatility / table above and chart below), the difference between our current market decline and the Dow Jones now long forgotten October to December 2018 18% correction is made apparent.
During the 18% correction of eighteen months ago, its 200 count (Blue Plot: the number of Dow Jones 2% days in a running 200 day sample) increased to 19 at its peak, while in our market decline we saw a 200 count of 38. That’s a huge difference in daily volatility, in this case the difference between an 18% and 37% decline in the Dow Jones.
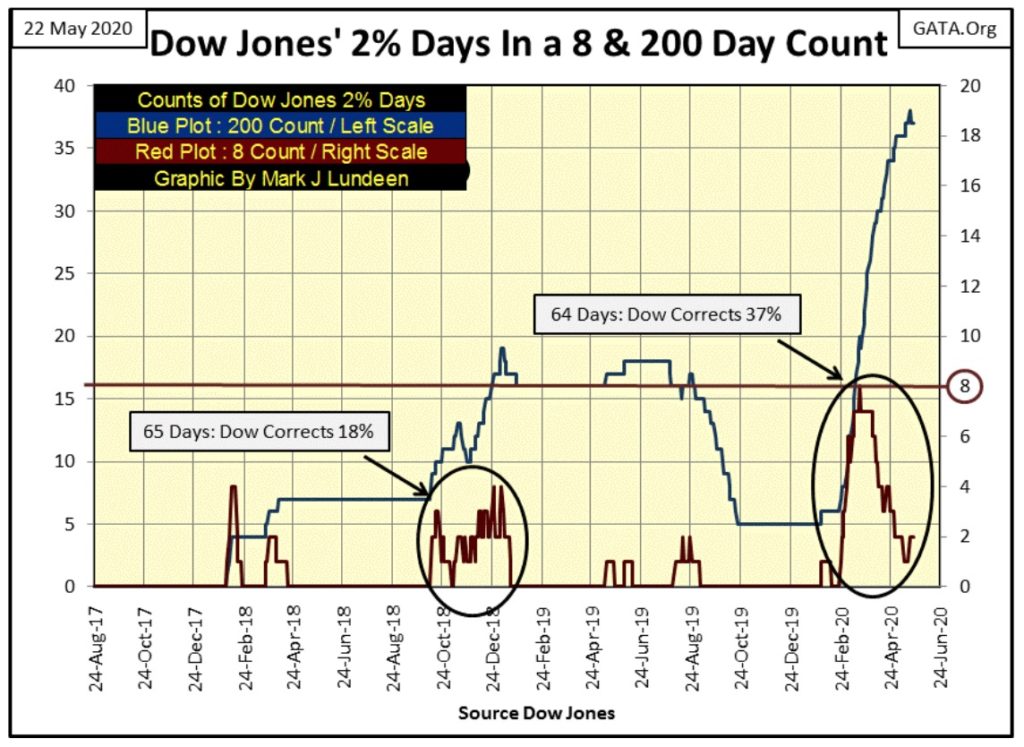
The Dow’s 8 count (Red Plot: the number of Dow Jones 2% days in a running 8 day sample) has yet to decline to a zero in the past 64 days, and the 8 count also saw a count of 8 on March 18th, or eight straight days of extreme market volatility. Since January 1900, the Dow Jones has seen an 8 count of eight only once before; during the Great Depression.
But now all this is market history. As long as these extremes in market volatility remain in the market’s rear-view mirror, all is well as the Dow Jones once again advances to new all-time highs. Looking at our bear market below (Red Plot), it looks very different from the market crash of 1929/1932 (Blue Plot).
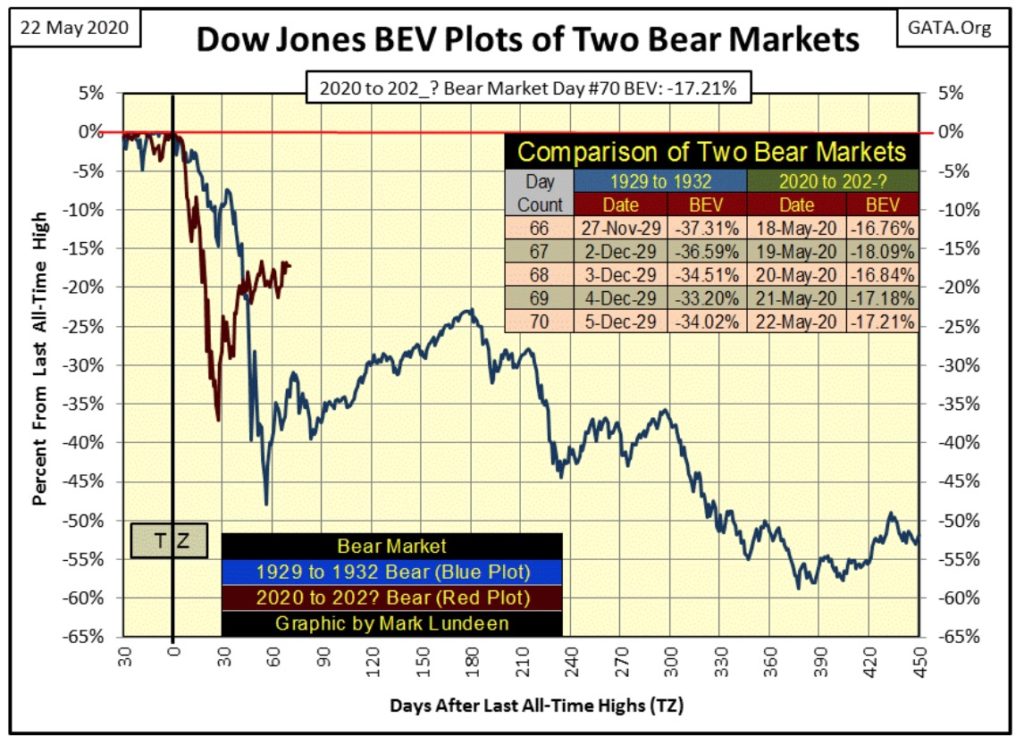
Okay. Our market decline did crash below its BEV -35% line faster than the Great Depression’s crash did. In fact our current decline was the fastest 35% market crash in the history of the Dow Jones; so what? So, maybe it’s just a little too early to be thinking about new all-time highs (BEV Zero’s) for the red plot above, when considering factors other than valuations.
In the past I’ve covered the importance of dividends for share price valuations, and how the huge growth in corporate debt will one day negatively impact dividend payouts. Debt must be serviced. When a corporation looks at the revenue coming into it from its operations, by law debt service must come before disbursing any cash into a company’s dividend program.
Here’s an article from CNN (Fake News) on the potential for a $500 billion dollar reduction in dividend payouts for 2020.
Okay, so why label CNN as “fake news”, and still see them as a viable source of information? A pending reduction in dividend payout was and is predictable. What makes CNN Fake News is their placing the CCP (Chinese Communist Party) Virus pandemic as primarily responsible for it, with no mention of the vast increase of debt these dividend-paying corporations and their customer base are now carrying on their balance sheets.
Dividends have disappeared this year. Will they ever come back?
Updated 7:03 PM ET, Sun May 17, 2020
London (CNN Business) Dividend payouts could tumble by nearly $500 billion this year, a steeper drop than during the global financial crisis, as the worst global recession in decades is forcing companies to preserve cash.
The damage to dividends could endure well beyond the coronavirus pandemic, analysts say, as companies around the world facing a historic collapse in revenue consider permanently shoring up their cash buffers.
https://www.cnn.com/2020/05/17/investing/dividend-payouts-after-coronavirus-recession/index.html
Next a USA Today article on the customer base of the above corporations.
Mortgage delinquencies surge by 1.6M in April, the biggest monthly jump ever
USA TODAY
The above article covers only mortgages, but I don’t need an article from the Financial MSM to believe the same is happening in:
- Student Loans
- Auto Loans
- Credit-Card debt
Or even with residential property-tax payments. Given this reality in the debt markets, how long before we see a significant reduction in corporate sales and revenues from which dividend payouts are funded?
I for one can’t say as the FOMC is allowing corporations to use the “liquidity” they are “injecting” into the economy for funding their corporate-dividend payouts. This past week the FOMC had “injected” another $199 billion dollars into the banking system (chart below).
From these “injections” the banking system can, and will lend many trillions of dollars, all at attractive rates, to corporations and consumers alike to maintain the appearance of normality within the markets and economy. But it’s all a fraud upon the public, and as such can’t go on forever.
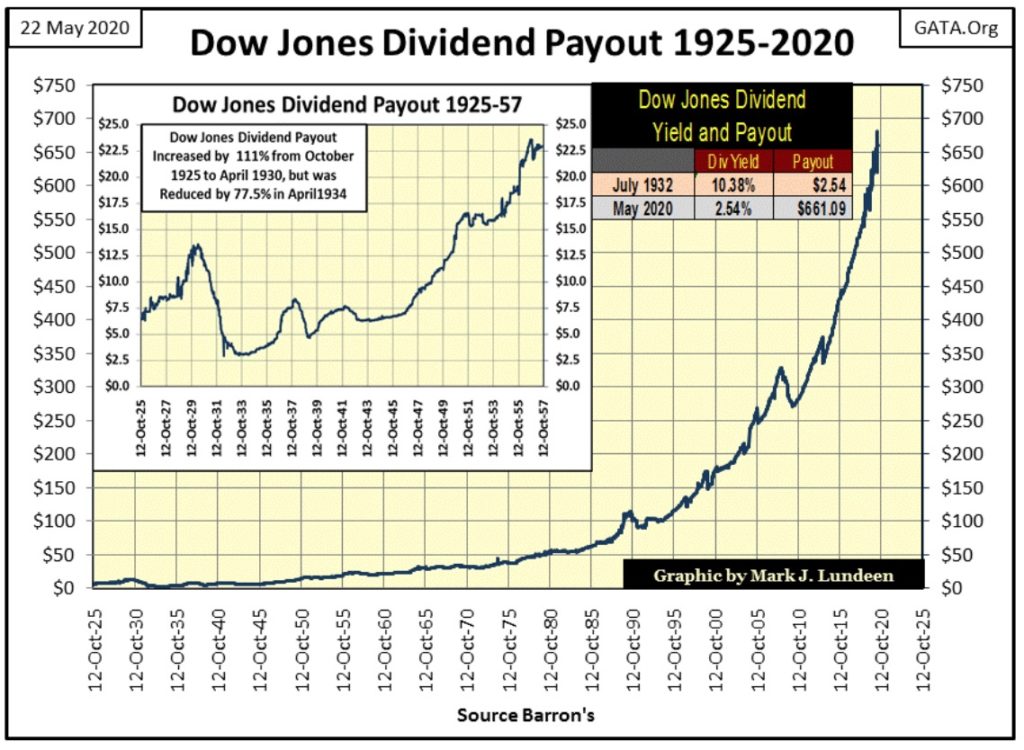
Currently the Dow Jones is paying out around $661 in dividends. How many of those dollars are funded from profitable corporate operations and how much from assuming new debt is a question no Fake News outlet will ever address until long after the pending dividend-payout collapse for the Dow Jones is history.
Someday they’ll write books about this and win awards. But now, when it could help retail investors they’ll remain silent.
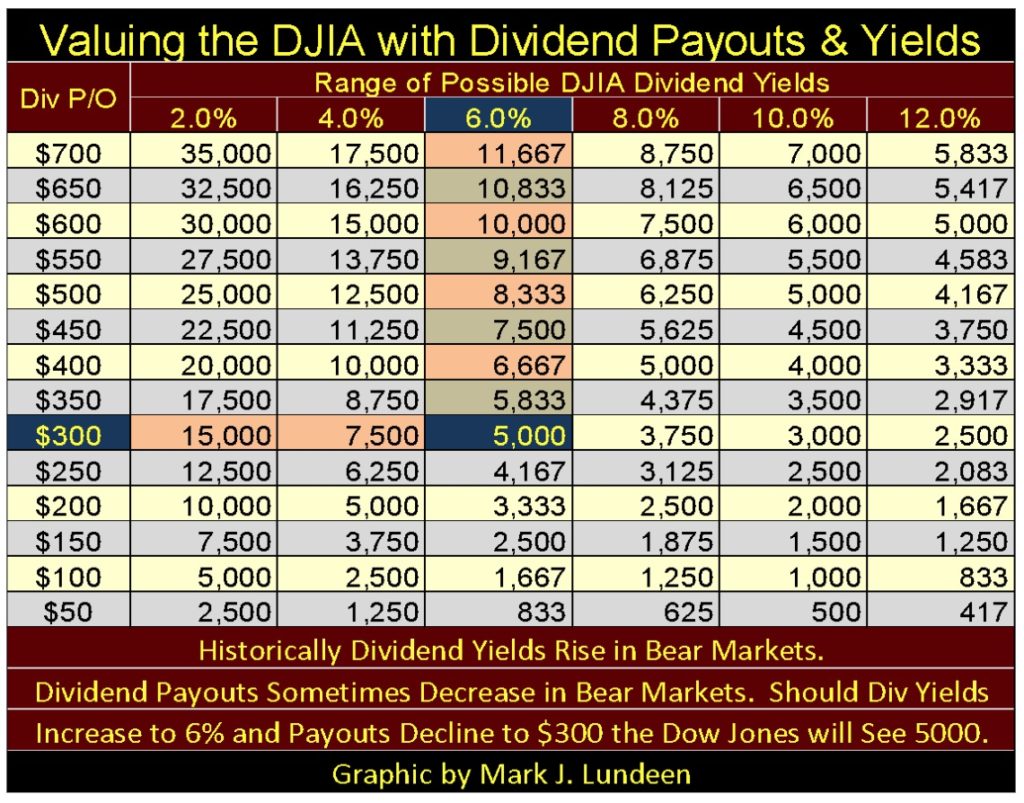
A collapse in corporate-dividend payout is pending, and it will have an oversized impact on market valuations, as seen in the table below.
Fixing a dividend yield is simple; divide its payout by the valuation. So too is fixing a valuation from a dividend’s payout and yield; divide the payout by the yield, and that is how I computed the data in the table below. As of Thursday night when I was writing this, the Dow Jones was paying out $660.80 and yielding 2.70% (0.027). Dividing $660.80 by 0.027 returns 24,474, Thursday’s closing price for the Dow Jones.
So are all the valuations seen below; by computing the given payouts on the left, and dividing them by the yields given above. The provided highlighted example below is fixing the valuation of the Dow Jones should its payout decline to $300, and its yield increase to 6%.
During the Great Depression dividend payouts for the Dow Jones was cut by 77% as its yield increased to over 10%. So both these assumptions are well within historical parameters. But should they happen the Dow Jones will find itself closing at 5000, a whopping 83% bear-market decline from its last bull market all-time high: 29,551.
Next is NYSE Margin Debt plotted with the Dow Jones going back to 1979. In the twenty years spanning 1979 to 1999, the Dow Jones and NYSE Margin Debt pretty much increased with one another. This was not so since 1999, where there has been three episodes of margin debt booming, which then led to a market bust.
The first margin debt boom of this series peaked first in March 2000, which ultimately resulted in a 38% bear market in the Dow Jones thirty months later. The second peak in margin debt occurred in July 2007, which was followed by a 54% market decline in the Dow Jones twenty months later, a percentage decline exceeded only by the 89% market decline of the Great Depression.
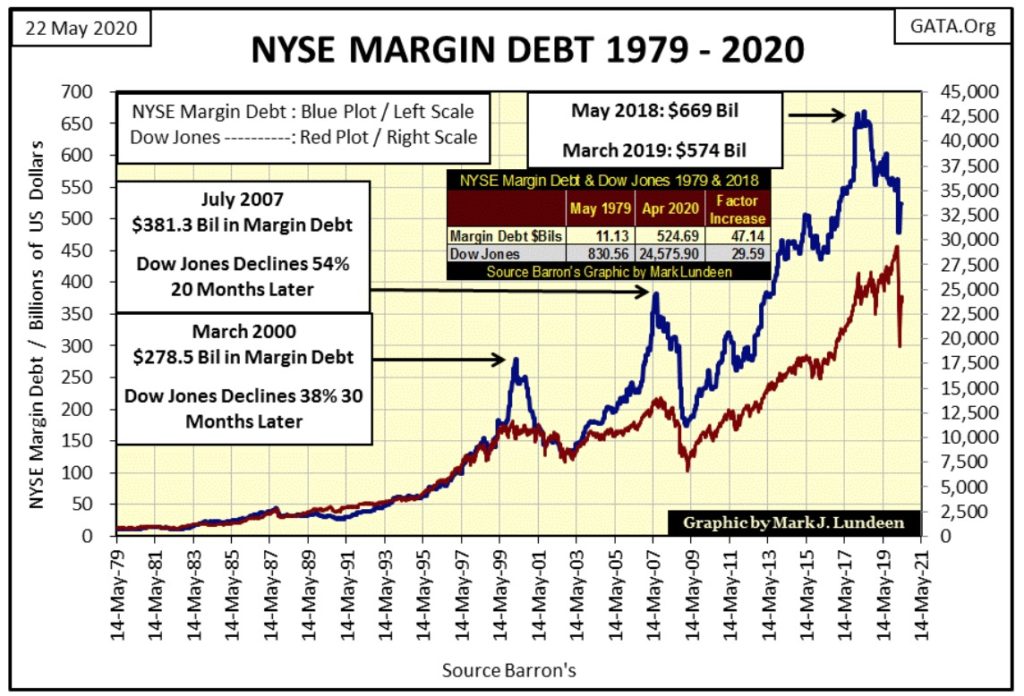
Our current NYSE Margin Debt peak occurred in May 2018, and two years later (March 2020) the Dow Jones saw a 37% market decline, as it had in October 2002. If a 38% bear market was good enough in 2002, isn’t it good enough for a bear market bottom in 2020?
I don’t believe so. It’s not just me thinking this, as this is also the opinion of the Idiot Savants sitting at the big table at the FOMC. As seen in the chart below, during the Dow Jones 38% bear market of 2000-02, the FOMC saw no need for a quantitative easing (QE).
That changed dramatically during the 2007-09, 54% Dow Jones bear market, where the FOMC felt the need for not one but three bouts of QE during the market crash and subsequent market recovery.
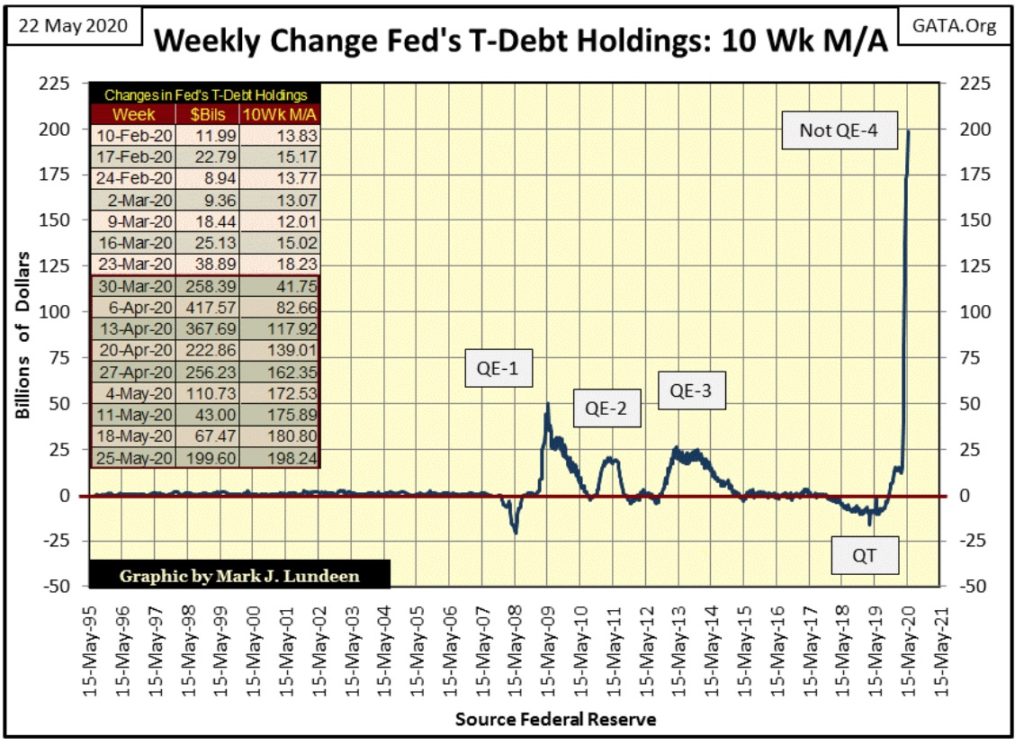
And now look at what the FOMC saw the need for our current, so far only a 37% bear market – a QE of historic proportions. Do you think our current bear market’s percentage decline of 37% (so far) would have stopped just short of a 40% market decline had the FOMC not have “injected” this massive amount of “liquidity” into the financial system? I don’t!
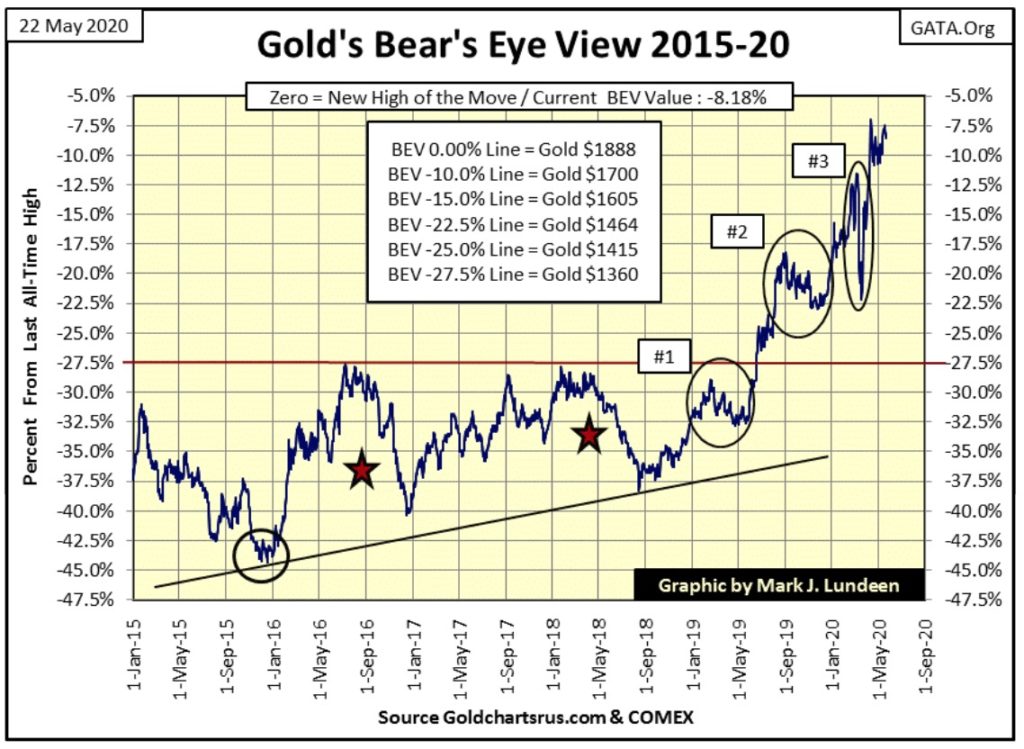
Moving on to gold’s BEV Chart below, since April 13th gold has struggled to break above its BEV -7.5% line. This too shall pass, and we’ll see gold once again making new BEV Zeros in the chart below.
The Silver to Gold Ratio (SRG) has come back to the 100 ounces of silver for one ounce of gold level in the past few weeks, a big reduction from the 121 SGR of earlier this year.
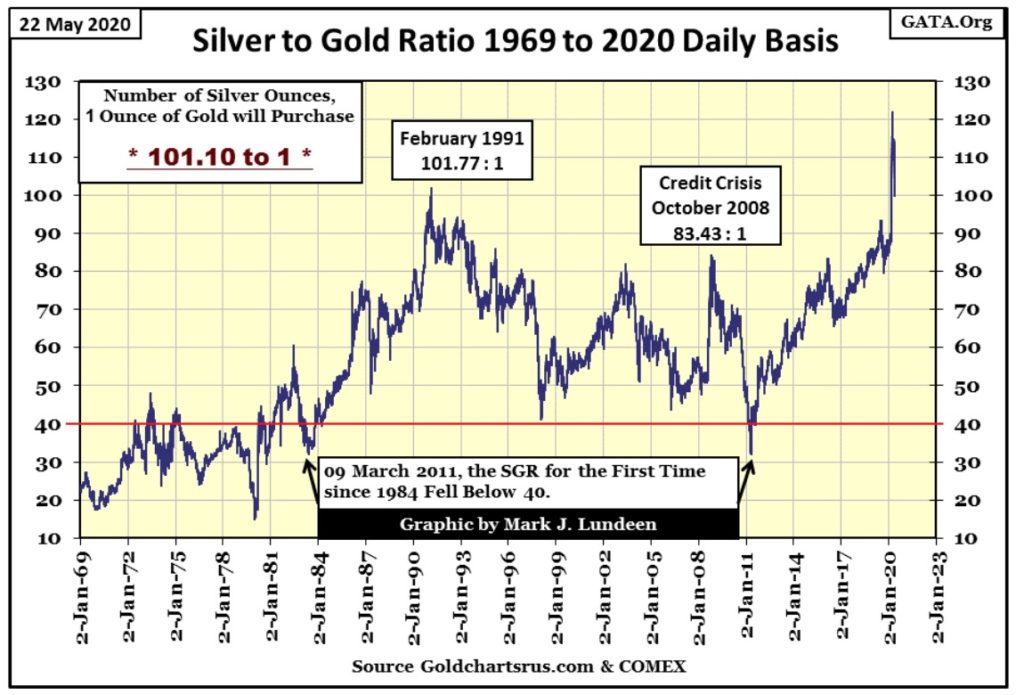
But this data is based on spot prices. Silver is more expensive in the futures markets. And then when you look for what an ounce of silver will actually cost you on the internet, looking at 1 ounce Silver Eagles (SE) from the US Treasury, the cheapest will cost you around $24, a 40% premium over today’s spot price of $17.15. Some SEs go for well over $30; the 1996 SE goes for over $88.
Looking at SEs at the site below, most of the years, including the $88 1996s are out of stock, which tells me there is no market in silver eagles as NO ONE is willing to sell their eagles at the prices offered.
How high must silver prices rise before current owners of silver eagles are willing to trade them for dollars the FOMC is currently trashing? Obviously much more than just $24! So, what does that make silver’s spot weekly closing of $17.15? No less a fiction than seeing the Dow Jones close the week at 24,465.
https://www.jmbullion.com/silver/silver-coins/american-silver-eagles/uncirculated-ase/
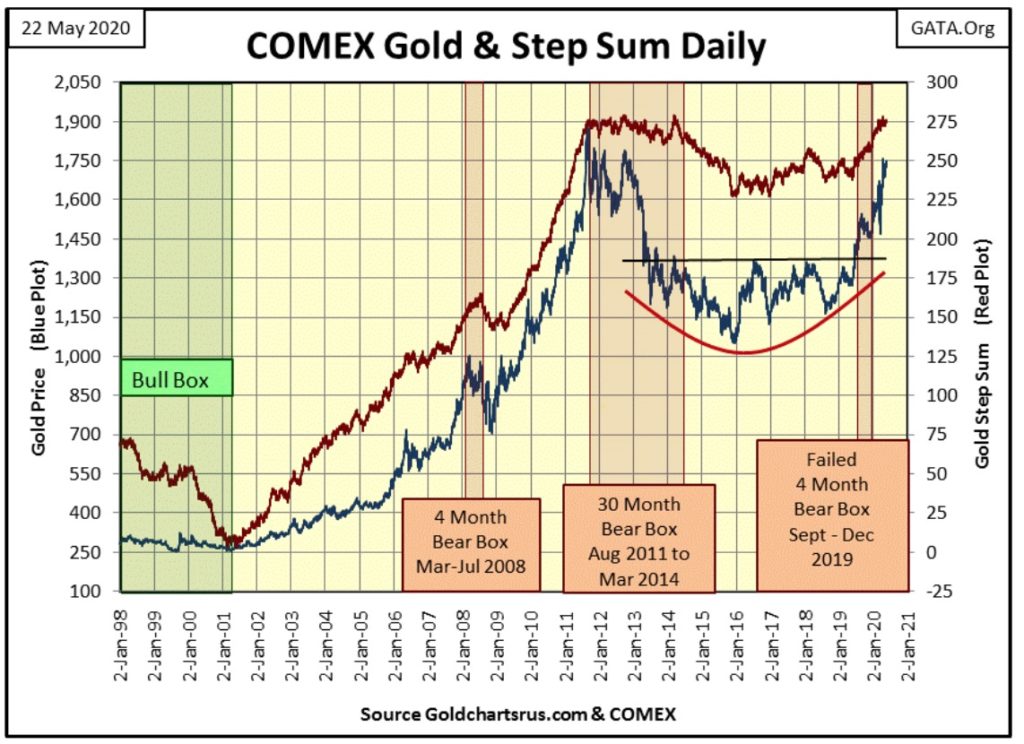
Moving on to gold and its step sum chart below, since April 13th when gold closed at $1756.30 the bulls have struggled to break above it. So yes, the chart below continues looking very positive, but after six weeks of more of the same this chart has also become tedious, and will be until the price of gold either advances far above $1756 or declines far below it. Until then we wait, but I expect the next big move will be to the upside.
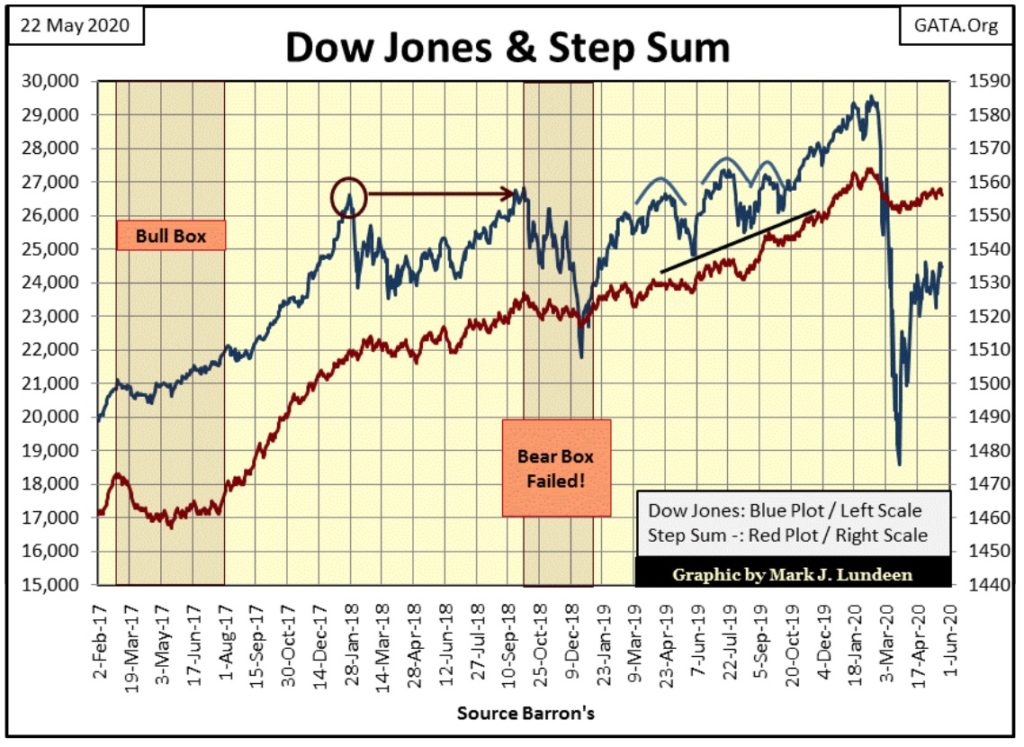
The Dow Jones and its step sum chart below is also becoming tedious as the market is making us wait for its next big move, which for the Dow Jones below or gold above could be either up or down. But in late May of 2020 the stock market is scary, so I’d rather have my investments in gold and silver come what may in the weeks and months to come.
Moving on to gold’s and the Dow Jones step sum tables below, neither markets are over or under bought, as seen by their 15 counts inside their +7 to -7 range. Gold’s daily volatility has peaked at 0.80% a few times since April 20th, and is having a hard time rising above it. That’s another way of saying gold is currently in a slow market. When gold once again begins to advance, we’ll see its daily volatility once again trending upward.
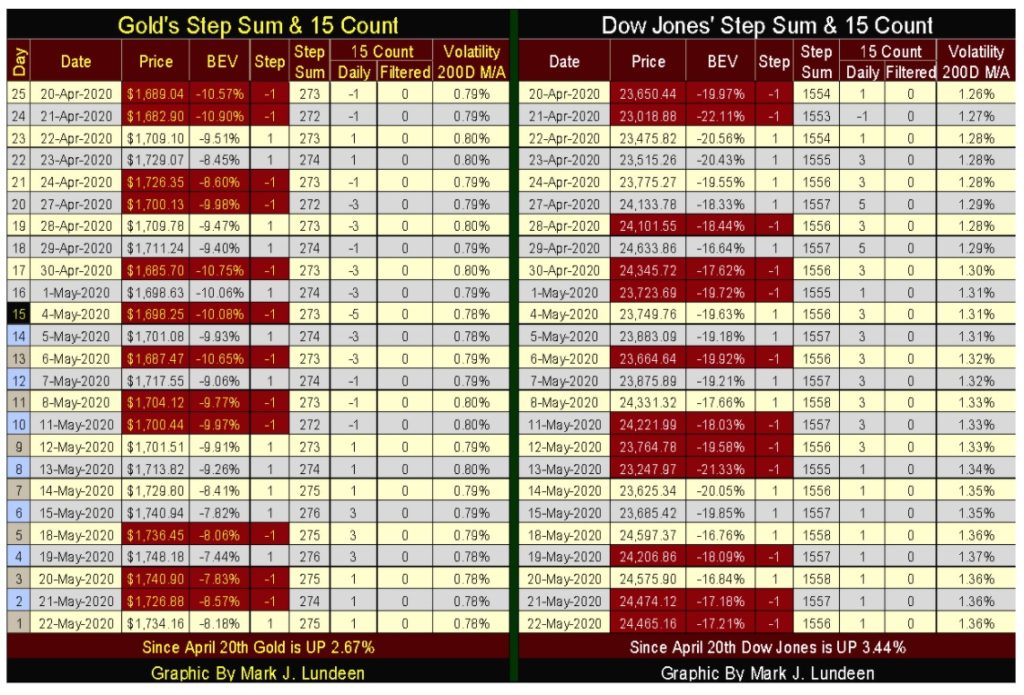
For both gold and the Dow Jones above, there are about as many daily advances as there are declines. In the past twenty-five trading days both have seen their step sums advance by two net advancing days. And that is just how markets operate, about as many daily advances as declines whether they are in a bull or bear market.
The Dow Jones on 02 January 1900 (120 years ago) closed at 68.13. That’s far from the 24,465 it closed this week at. But in the frequency distribution table below we see all the daily advances (1) and declines (-1) in the Dow Jones since 02 January 1900, and the daily advances out number its declines by only a net of 1556 days. That’s not much from the total 32,558 NYSE trading sessions this sample is based on.
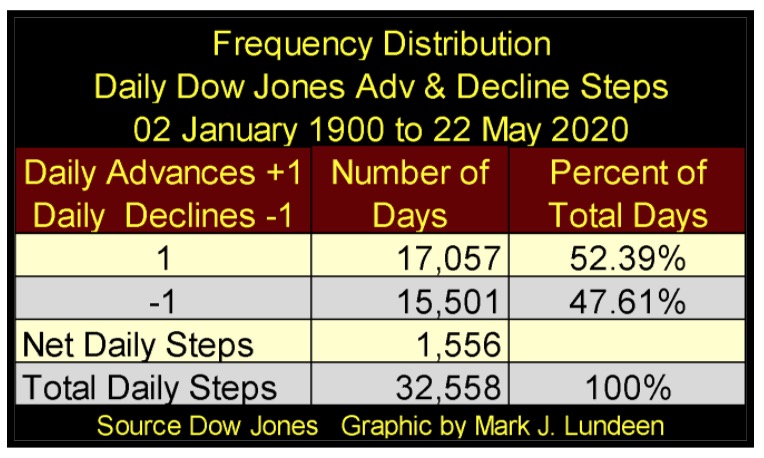
Think of all the bull and bear markets the Dow Jones has seen since January 1900. It was upon these net 1556 daily advances that raised the Dow Jones’ valuation from 68.13 on 02 January 1900 to this week’s close of 24,465.
Here is something else about that 1556 net up days since January 1900; it was also the Dow Jones’ step sum value at the end of this week.
As a reminder, assuming the CCP Virus pandemic doesn’t get me first, I’ll be back in mid-June. But I may not make it back as I never wear a mask out in public and I disregard social distancing standards every opportunity that comes my way.
I can’t help myself, as the current rules for the “new normal” remind me so much of the old rules the Navy imposed on me while I was in boot camp. Well not exactly as in boot camp the social distancing standard was “nuts to butt” for the entire line waiting for chow. Eighty guys stacked like sardines in field large enough for a tank battle.
Veterans on this Memorial Day Weekend know what I’m talking about. As well as remembering the many young people who from boot camp went to war and never came back. That’s what Memorial Day is all about: remembering those who in giving their last full measure of devotion never came back; so sad. Take a moment this weekend to remember them.
I’ll get back to you guys in two weeks.
—
(Featured image by S B via Pixabay)
DISCLAIMER: This article was written by a third party contributor and does not reflect the opinion of Born2Invest, its management, staff or its associates. Please review our disclaimer for more information.
This article may include forward-looking statements. These forward-looking statements generally are identified by the words “believe,” “project,” “estimate,” “become,” “plan,” “will,” and similar expressions. These forward-looking statements involve known and unknown risks as well as uncertainties, including those discussed in the following cautionary statements and elsewhere in this article and on this site. Although the Company may believe that its expectations are based on reasonable assumptions, the actual results that the Company may achieve may differ materially from any forward-looking statements, which reflect the opinions of the management of the Company only as of the date hereof. Additionally, please make sure to read these important disclosures.

-

 Cannabis2 weeks ago
KONOPEX Expo 2026: Celebrating Europe’s New Era of Legal Cannabis
-

 Biotech3 days ago
Volatile Outlook for Enlivex Therapeutics as Investors Await Clinical Catalysts
-

 Impact Investing1 week ago
Inter IKEA Launches Electric Truck Fleet to Decarbonize Heavy-Duty Logistics in Italy
-

 Markets5 days ago
Cotton Market Weakens Amid Demand Concerns and Bearish Trends


