Featured
DJI, S&P 500 climb to new heights; Precious metals enjoy a positive week
The DJI and S&P 500 reached new all-time highs but NASDAQ, the DJT and Russell 2000 fell lower. Precious metals had a good week as U.S. dollar faltered.

“Millionaires don’t use astrology, billionaires do.”—attributed to J. P. Morgan, American financier & banker, 1837–1913; founder of J.P. Morgan & Co, 1895
“The only function of economic forecasting is to make astrology look respectable.”—John Kenneth Galbraith, economist
“Thousands of experts study overbought indicators, head-and-shoulder patterns, put-call ratios, the Fed’s policy on money supply….and they can’t predict markets with any useful consistency, any more than the gizzard squeezers could tell the Roman emperors when the Huns would attack.”—Peter Lynch, investment guru, head of Magellan Funds 1977–1990
No, it is not our intention to get into a discussion on financial astrology, although it is a rather fascinating subject. We have viewed our job as to provide insight rather than predicting. Throughout the years, we have discovered that no one has the perfect forecast and no one has the perfect answer. But that doesn’t stop many from trying. Daily, we see come-ons imploring us to get this next great stock or we have the next great prediction on the markets. Just read through a lengthy write-up telling you all about it, but not the stock, of course, and when you get to the end—it’s “subscribe here for the next great thing.”
Two years ago, we wrote about the election of President Trump and what might happen next. We didn’t have any inside information but, given what we saw and what we learned about Donald Trump we thought we could make some reasonable forecasts about where his presidency might lead us.
One thing we noted in our write-up at the time was the divisiveness of the election. Since then, the divisiveness in the U.S. has only grown, and not only is it in the U.S. but it is rampant in the EU and is now been seen in Canada too. Irreconcilable divisiveness can lead to civil war. We have seen and read a number of articles on whether a civil war in the U.S. could happen and the answer has been for the most part yes, from both the right and the left.
The U.S. has a history of civil war and a long history of civil strife. While these events are in the past, history has shown that they never seem to go away.
The EU is not immune either as the history of Europe is littered with wars between the various states and the rise of strongmen, resulting in civil strife and violent wars between the states where millions were killed. The formation of the EU and advent of the euro was supposed to end that. Instead, stark divisions are rising between the wealthy states of Germany and France and the southern and eastern European states, where many feel they are mere vassals of France and Germany. The Euro, the currency that was supposed to unite also divides as they operated under a common currency but each retained its own central bank and monetary policy. Stark divisions are also rising over immigration, and arguments that were heard in the past are being repeated.
And then there is Brexit where the United Kingdom is trying to extract itself from the EU. Canada has no history of civil war, but that doesn’t make us immune.
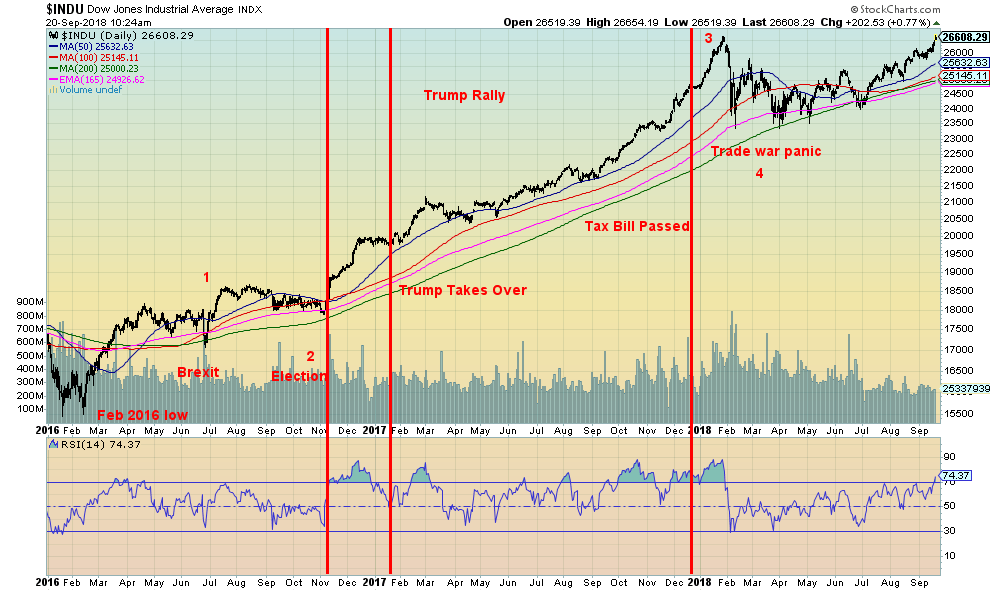
We noted that following the election, the stock markets took off in what appeared to be a “blow-off” move. At the time, the Dow Jones Industrials (DJI) was only around 20,000. Today, it is around 26,000 and setting record highs.
On election day, November 8, 2016, Trump backer billionaire Carl Icahn injected $1 billion and prevented a massive sell-off. Over the next several months, the stock market, encouraged by the thoughts of deregulation, tax cuts and the repatriation of a huge amount of funds from outside the country sent the stock markets on a massive upward tear.
The rally has been led largely by the FAANGs (Facebook, Apple, Amazon, Netflix, and Google). Together, they have accounted over 80 percent of the rally. Our chart below shows the Dow Jones Industrials (DJI) dating from the February 2016 low. It notes the dates of the Brexit, the election, the inauguration, and the passing of the much-anticipated tax bill, that when passed set off what seems to have been the final blow-off before the trade war panic set in.
© David Chapman
Three things stand out that we highlighted from our December 2016 report. They are trade, taxes, and jobs. On jobs, we had noted Trump stating he wanted to be the greatest job-creating president in history and raise the U.S. GDP to 5–6 percent. Since his inauguration in January 2017, U.S. GDP growth has averaged 2.7 percent annually—well below his projected 5–6 percent. Most economists expect 2018 GDP growth to average around 2.8 percent–2.9 percent. Most 2019 forecasts expect GDP growth to slow.
As to jobs, Fed statistics show that between this time in 2016 and now the U.S. workforce has grown by 2,075,000. The official unemployed (U3) has fallen by 867,000 while the actual unemployed (U6) has fallen by 2,090,000, a figure in line with workforce growth. This projects to roughly 4,000,000 jobs during Trump’s tenure or if he serves two terms possibly as many as 8,000,000 jobs. That is well short of the 30 million he has suggested he will create. Under Democrat Bill Clinton, during a period of considerably higher economic growth, the economy created 21.5 million jobs. From 2008 to 2016, under the Obama administration, the U.S. workforce grew by 9.4 million jobs.
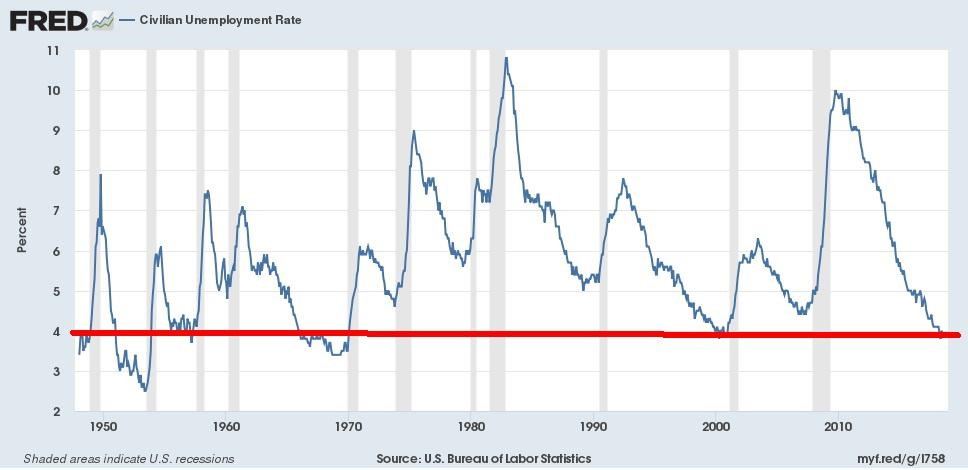
U.S. unemployment is already at a multi-year low. While there have been periods where the official unemployment rate has fallen lower, it is worth noting that has not occurred since the late 1960s, a period of considerable growth that followed the Great Depression and WW2. The last time the unemployment rate was this low was at the end of the 1990s boom. The suggestion here is it is likely that the unemployment rate has hit or is very close to a multi-year low.
© David Chapman
In December 2017, the Trump administration passed its $1.5 trillion tax cut, bringing about the biggest changes to the U.S. tax code in decades. At the time, most economists predicted that it would have only minimal impact on the economy. It was also forecast that it could add upwards of $1 trillion to the deficit over the next decade. Corporations were to see a drop in their tax rate to 21 percent from 35 percent. Most would see some benefit from the tax cut, but the main beneficiaries were the top 10 percent and even the top 1 percent.
As to closing tax loopholes, there was little to be seen except in one significant case. Canadian residents holding dual U.S. and Canadian citizenship were facing a massive tax bill because of the tax reform. Corporations and the wealthy were happy. For almost everyone else, there was little to get excited about, or in the case of dual-citizenship Canadians, it was a disaster.
When we wrote about the tax cuts back in December 2016, we noted that corporations tended to pass their tax cuts to shareholders and even buy back their shares as opposed to making investments that would create new jobs. We also noted that the tax cuts could result in a huge increase in the deficit.
Since Trump’s inauguration in January 2017, the U.S. debt has jumped $1.5 trillion. The budget deficit in 2017 jumped to $665 billion from $585 billion in 2016, the last year of the Obama administration. In 2018, the estimated budget deficit is $833 billion. From 2019 onwards, the budget deficit is expected to hit up to $1 trillion. It would be the first time since 2012 that a trillion-dollar deficit would be seen. 2012 was the last year of the trillion-dollar deficits as a result of the 2008 financial crisis. Many had predicted that the tax cuts would unleash trillion-dollar deficits for upwards of a decade.
The Trump administration appears to have unleashed a huge trade war against the world. In our December 2016 report, we cited how the Trump administration was most likely prepared to unleash trade wars against Canada, Mexico, China, and others. We can’t say that we have been disappointed, even as disappointment is not what we would wish to associate with this.
NAFTA negotiations with Canada and Mexico have been ongoing for months and could be on the verge of falling apart. To say that they have been going well may be an overstatement. The trade war with China is escalating as the U.S. has unleashed a new round of tariffs against them and China has shot back with a new volley of tariffs against the U.S. China is unlikely to relent.
We have often noted that no one wins in a trade war. Consider the trade wars that the U.S. has unleashed on Canada, Mexico, China, the EU, and more along with sanctions against Russia, North Korea, Iran, Turkey, and more. It feels like the U.S. has hit almost the entire with either tariffs or sanctions.
The main targets are tariffs against China and sanctions against Russia, the two leaders in what has become a war against U.S. global hegemony. The main target appears to be China’s Belt and Road initiative, designed to link Asia to the EU. China is leading the way in challenging the supremacy of the U.S. dollar for global trade as the world’s reserve currency. The supremacy of the global reserve currency is not a given. History suggests that trade wars and currency wars almost inevitably lead to real wars. Both WW1 and WW2 were preceded by trade and currency wars.
Despite the trade war threats, the U.S. stock markets continue to soar with the DJI hitting new heights this past week. What we are seeing is that stock markets and economies in the EU, China, and elsewhere are slipping, with funds flowing into the U.S. as a result of the high U.S. dollar, given that, so far, the U.S. dollar has benefitted from all of the trade tensions.
But that is a situation that won’t last forever as the Trump administration has accused everyone of deliberately devaluing their currencies against the U.S. dollar. Trump wants a lower U.S. dollar and Trump has also criticized the Fed for hiking interest rates and not doing more to bring down the value of the U.S. dollar.
Again, in our December 2016 report, we had noted that Trump had already attacked the Janet Yellen Fed before taking office. Despite the current Fed Chairman Jerome Powell being a Trump appointee, Trump hasn’t hesitated to attack the Fed’s policies. While in the past there have been tensions between the President and the Fed, it would be unprecedented if Trump were to actually interfere with the Fed. That would likely spook the markets.
We concluded our December 2016 report with a note that the next four years were going to be bumpy. So far, we can’t say we have been disappointed. Divisiveness has grown, trade and currency wars are deepening, the debt can only be described as astounding, and global tensions are rising.
Against this backdrop, it has been surprising for many that the stock markets keep on rising. The U.S. is not immune to the trade wars forever. Even as the U.S. stock markets have soared, markets elsewhere in the world are down on the year. Gold, which was supposed to act as a safe haven in times of currency and trade strife, has so far failed to ignite thanks to the strong U.S. dollar. That won’t last forever either as gold in other currencies that have been falling against the U.S. dollar has been soaring. For a pent-up market such as gold, if history is any guide, gold is ripe for a huge rally. And, as many continue to say, gold is money. All other forms of money are fiat.
Bitcoin watch
© David Chapman
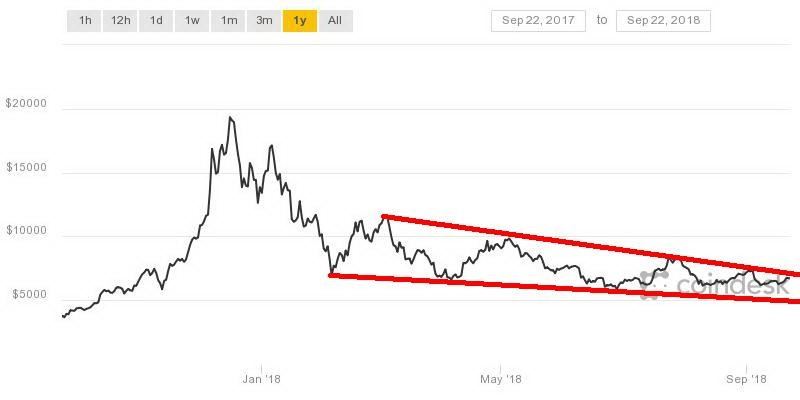
Once again, Bitcoin appears to be trapped in a trading range between $6,000 and $7,000. Given Bitcoin’s failure to break below $6,000, it continues to give hope to the bulls that the next bull market in cryptos is just around the corner. Giving them considerable encouragement is XRP (XRP).
XRP has leaped over 100 percent in the past week or so from a market cap of around $10 billion to a market cap of $23 billion. It has now leapfrogged Ethereum (ETH) as the second-largest crypto, behind Bitcoin. Unlike Bitcoin, it still trades for pennies as there are almost 40 billion coins outstanding vs. about 17.3 million for Bitcoin. XRP trades for about 59 cents.
Regulators continue to circle. For regulators, the cryptocurrency market remains essentially a “wild west” that needs to be tamed. Yet the purveyors of cryptos always sold it for its anonymity and that it was outside the system. Seems regulators have other ideas. Why? Because too many are getting burned. We have constantly noted that a few got rich, even very rich, but many have lost everything. Even as we write this, we picked up another story of a Japanese cryptocurrency firm, Tech Bureau Corp, reporting that some $60 million was stolen from its exchange. Cryptocurrency trading remains very popular in Asia, particularly China, South Korea, and Japan. Japanese regulators are also now circling.
This week, Coin Market Cap reported the market cap of all the cryptos stood at $224 billion, up from $202 billion a week ago. Bitcoin has gained roughly 4.3 percent on the week. XRP was a big leader amongst the larger cryptos, up 111 percent. The number of cryptos with a market cap of $1 billion or more now stands at 17, up from 15 a week ago. There, 1,981 cryptos are listed, up from 1,950 a week ago. The universe continues to grow. Surprisingly, there was no movement on Dead Coins as it remains at 911. Dead coins are scams, deceased coins, or parodies that just don’t exist anymore.
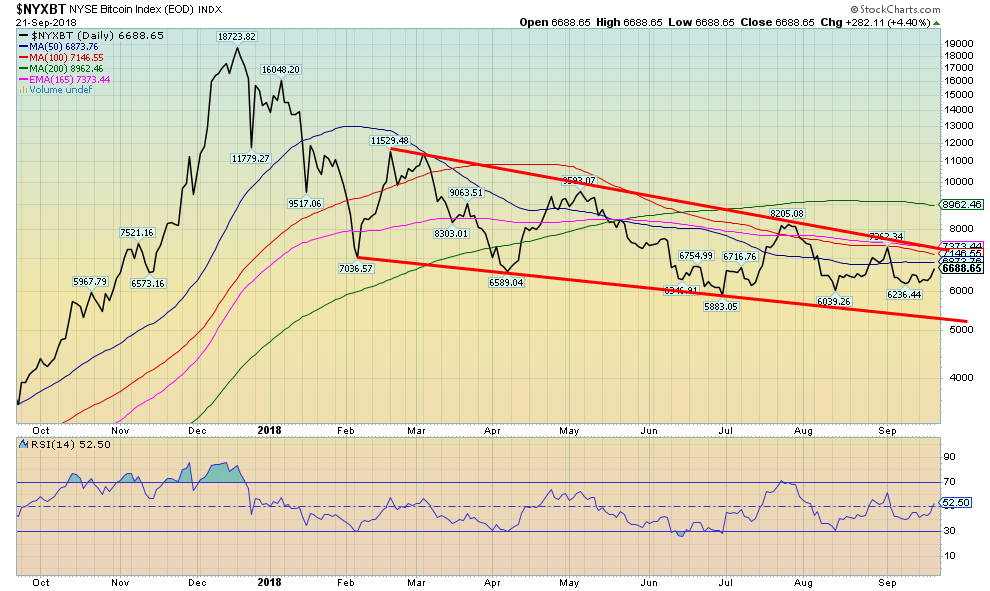
Not a lot has changed in the past week. Our thoughts on the next move of Bitcoin have not changed, either. Many cryptos remain down 90 percent from their all-time high. A solid break below $6,000 could send Bitcoin down towards $5,000. $7,250 is resistance and next resistance is seen at around $8,000. Bitcoin continues its series of lower highs along a relatively flat series of lows, the definition of a descending triangle.
© David Chapman
Markets and trends
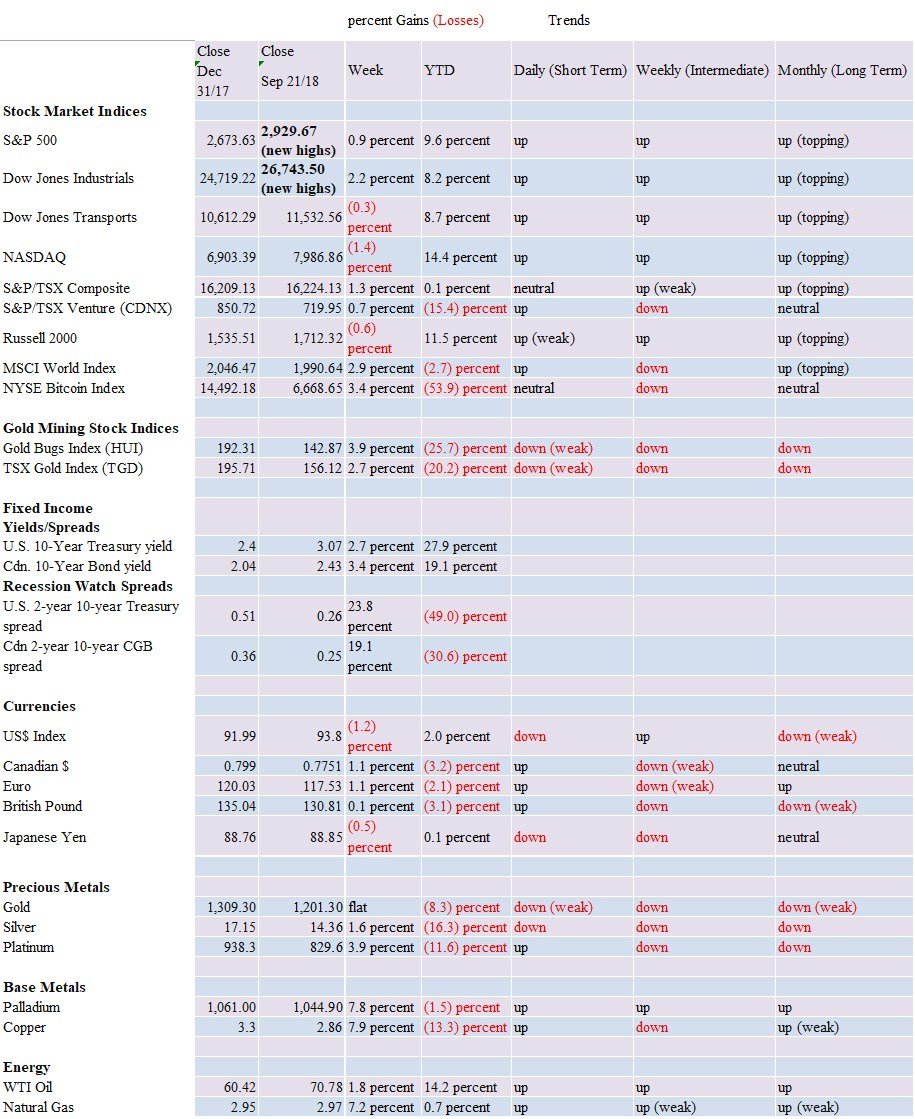
New highs/lows refer to new 52-week highs/lows. © David Chapman
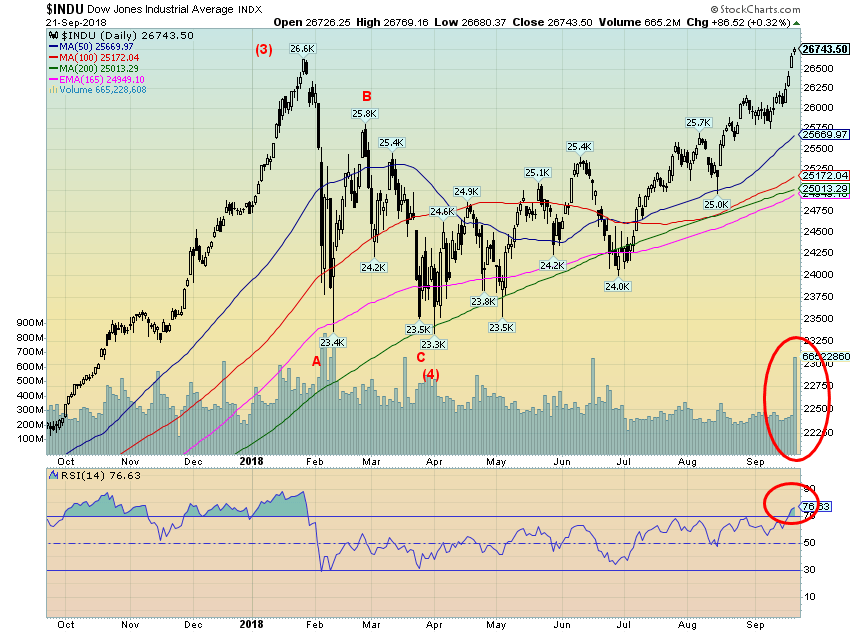
© David Chapman
Get out the bubbly. While most other U.S. indices were making new all-time highs the Dow Jones Industrials (DJI) was just a laggard. Not anymore. This week, the DJI made new all-time highs. Not by much mind you, but just enough to say “we did it.” Who cares about trade disputes, rising interest rates, or all that debt in the hands of governments, corporations, and the consumer? It’s piffle. Focus instead on the economic numbers. That’s all that matters. This past week saw the housing numbers, jobless claims, and manufacturing indices all come in marginally better than expected. Praise the lord. The Trump rally continues.
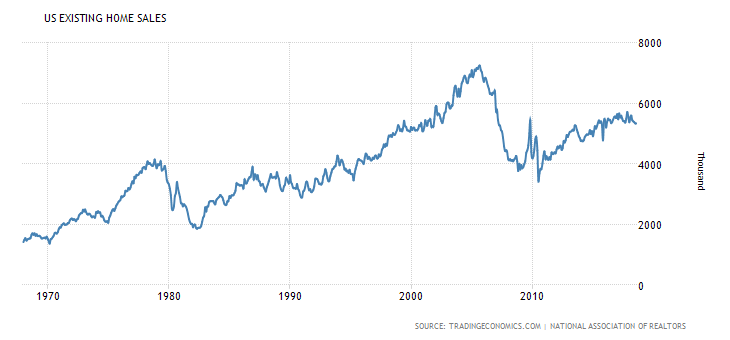
© David Chapman
One of the numbers that kept the market steady this past week was existing home sales that came in at 5.34 million for August. It was the same as July and roughly on expectations. But the reality is that sales remain well below the levels seen in September 2005 and the number remained down from the recent peak seen in February 2018. It is also worth noting that the median price also declined, falling to $303.2 thousand from $307.6 thousand. The number of houses available was also flat. Sales remain around levels last seen in 1999.

© David Chapman
One number that got them excited this past week was the unexpected jump in the Philly Fed Manufacturing Index. The index came in at 22.9 for September, easily beating August’s 11.9 and easily beating market expectations of 17. Helping the index along were jumps in new orders, shipments, and employment. Further inventories fell, prompting some to believe that they will need to be built up again.
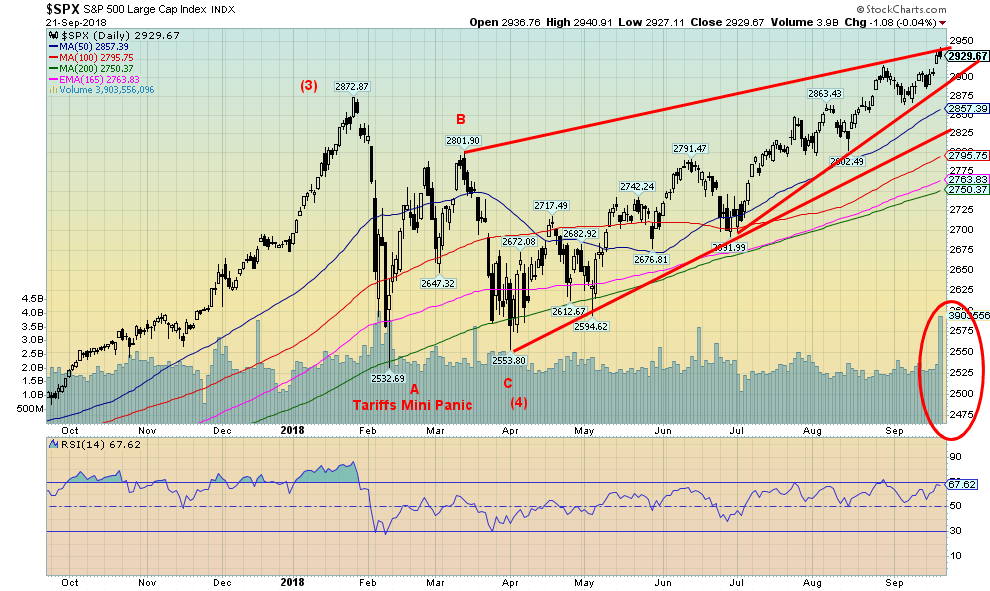
© David Chapman
The high-volume day that accompanied the U.S. stock indices to new all-time highs on Friday, September 21, is interesting, considering that the market essentially went nowhere. The market opened high, moved to new highs, then reversed and actually closed down marginally on the day, just below its opening level. That tells us that there was a lot of churning. Key will be what happens this coming week against the backdrop of the Fed meeting on September 25–26. It is highly expected that the Fed will hike the Fed rate by 25bp, raising it to 2.25 percent. It will also be an interesting week for economic numbers as the releases include the inflation numbers along with consumer confidence.
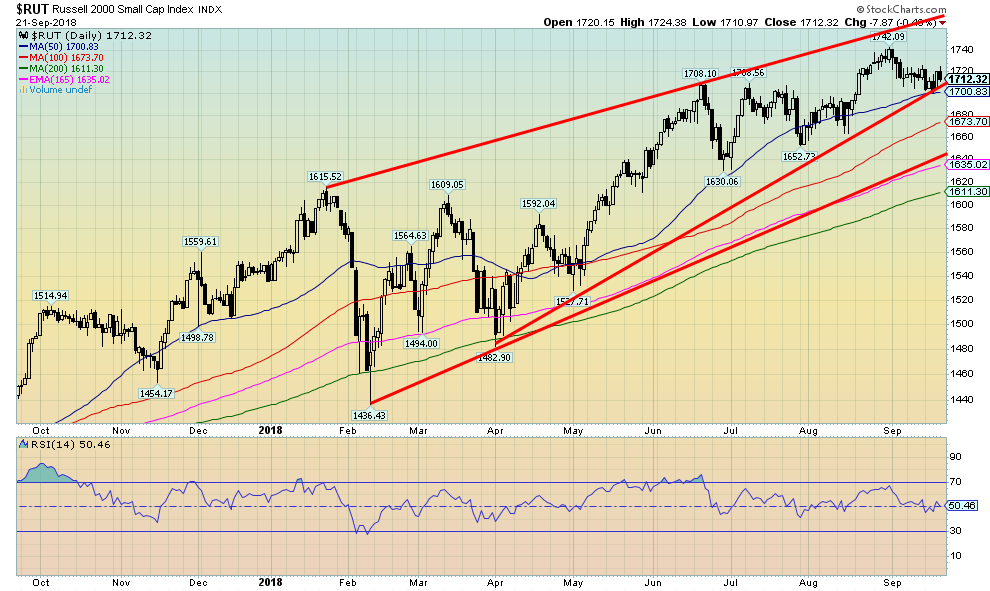
Despite the S&P 500 and the DJI making new all-time highs this past week, we note others didn’t. The Dow Jones Transportations (DJT), the NASDAQ, and the small cap Russell 2000 all closed the week lower down 0.3 percent, 1.4 percent, and 0.6 percent, respectively. A negative divergence? Time will tell.
We note the S&P 500 appears to be at the top of a possible ascending wedge triangle. The breakpoint is just around 2,900, so that is worth keeping an eye on. Given all that is happening this coming week, our suspicion is that we “sell the news.” The news will be the Fed.
Indices outside of North America did well this past week. The MSCI World Index jumped 2.9 percent, the London FTSE was up 2.4 percent, the Paris CAC 40 gained 2.7 percent, while the German DAX was up 2.5 percent. In Asia, the Chinese Shanghai Index (SSEC) jumped 4.3 percent while the Tokyo Nikkei Dow (TKN) was up 3.4 percent. Canada? The TSX Composite did see a 1.3 percent gain and the TSX Venture Exchange (CDNX) showed some life gaining 0.7 percent.
We doubt there is much room to move for the S&P 500 if the wedge channel is correct. Instead, we’d be watching that 2,900 zone to see if it can hold. Failure could lead to a swift decline to the next support near 2,825. So far, the 200-day MA has done a good job of holding. It should be noted that it is currently at 2,750. After testing that level a few times over the past several months, the next break of it could be of higher consequence.
© David Chapman
The small cap Russell 2000 didn’t fare all that well this past week. It fell 0.6 percent on the week. No new highs for them. We have often noted that small cap stocks do well in a bull market but do poorly in bear market. Could the Russell 2000 be giving us a signal? The Russell 2000 hasn’t actually broken down yet. But it appears to be clinging to that uptrend line and forming an ascending wedge formation. A breakdown under 1,700 could start a decline. But the 200-day MA is further below near 1,600. The Russell bears watching as a clue to what might happen to the large cap indices.
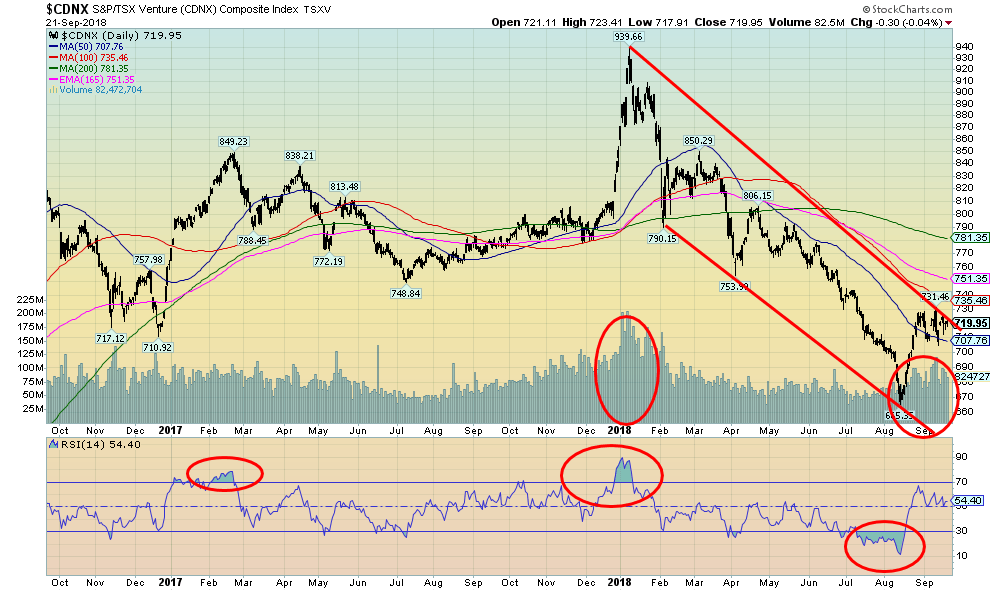
The TSX Venture Exchange (CDNX) put in a small 0.7 percent gain this past week. The CDNX is home to numerous junior mining exploration companies. They make up roughly 50 percent of the index. The junior gold miners have been, for the most part, a sorry lot. Many are trading below the value of what they have in the ground and there are even a number of them trading below their cash value. Now, that is really bad. They are cheap, cheap, cheap, but nobody cares. They make a positive announcement on drilling results, sometimes even eye-opener results, but nobody cares and the stock falls further.
This isn’t going to last forever. The CDNX has, as we have often pointed out, a wild history of ups and downs. We have been going through the downs. Get ready for the ups. We put in a nice little rally from the V bottom as the index gained 8 percent. Note that the volume increased on the rise, a positive sign. But then, we wonder, have we just formed another channel? We’ll feel better when the index takes out 730, but even than there are resistance points to the upside near 750 and 780 before something more sustained might get underway. We are not excited at the possible prospect that instead, it might be a bear channel and we fall back to its lows currently near 645. However, even if it did we would view as just another buying opportunity.
We do note there have been exceptions to the rule of the junior mining stocks. One that has been jumping this past week was RNC Minerals (RNX-TSX). With a find in its gold properties in Australia, this junior miner has leaped 700 percent since August 2018. We know it’s not listed on the CDNX, but the analogy is the same. A junior miner rising. This is how quickly these stocks can rise once they get going. Most people are leaping in at the top.
© David Chapman
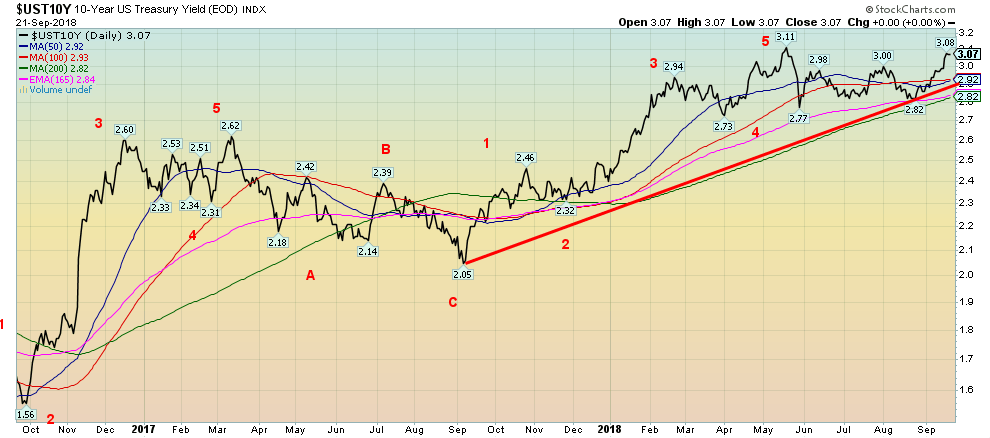
Bond yields surged this past week to their highest level since April. The 10-year U.S. Treasury note yield jumped to a high of 3.08 percent, just short of the previous high of 3.11 percent. Is it possible that our long-held target of 3.20 percent could still be achieved? We are not going to discount it. It is also possible that we are starting a new wave to the upside. The first wave up surged to 2.62 percent, topping in March 2017. A corrective wave followed, bottoming at 2.05 percent in September 2017. Wave 3 up topped in May 2018 followed by another corrective to the downside. The wave was quite shallow with a low at 2.77 percent. If there is another wave to the upside, then targets could be up to at least 3.45 percent. First, we have to break above 3.11 percent and set new highs.
Rates rose this past week pushed up by wage growth (August wage numbers were higher than expected), inflation fears, and concerns over the Fed and its rate hikes. As we have noted, it is expected that the Fed will hike the Fed rate to 2.25 percent at the meeting September 25–26. Markets tend to under-estimate the Fed. And, in turn, the Fed tends to hike rates higher and for longer than necessary. That is what turns markets to the downside. While 10-year yields jumped 8 bp on the week, the 2-year was relatively quiet, rising only 3 bp. That, in turn, widened the 2–10 spread we follow.
Recession watch spread
© David Chapman
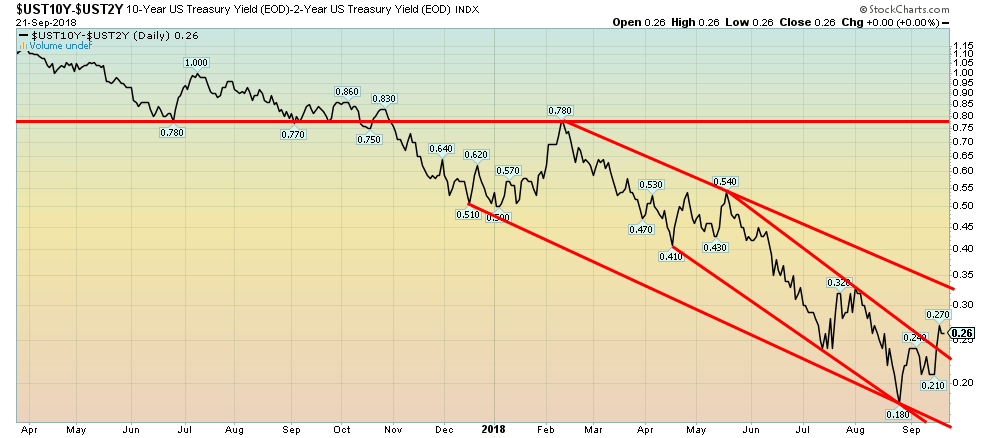
Given the jump in the 10-year U.S. Treasury Bond, the 2–10 spread leaped to 26 bp from 21 bp the previous week. The 2–10 spread broke a downtrend line. So, are thoughts of a potential recession off? Not really. As we have seen in the past, the spread doesn’t necessarily go down in a straight line. What needs to be kept in perspective is the direction, which remains down. The breakout was from a narrower bear channel seen since April 2018. A wider channel from the top in February 2018 suggests that the 2–10 spread could rise to just over 30 bp and still remain in a wider down channel. From our perspective, we remain on target for the potential start of a recession sometime in 2019.
© David Chapman
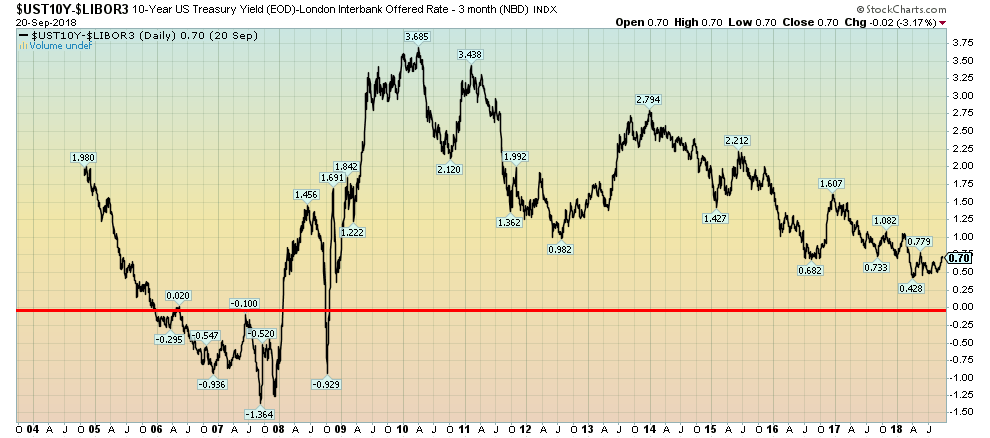
This is another twist on the 2–10 spread. This is the 3-month Libor—10-year spread. Data we have only goes back to 2004. We couldn’t help but notice the long period of a negative 3-month Libor—10-spread that persisted from 2006 through 2008. This spread, like the 2–10 spread, has been narrowing since 2010. At 70 bp it is not yet in danger of turning negative. The low so far was seen at 43 bp. We’ll keep an eye on this spread as well.
© David Chapman
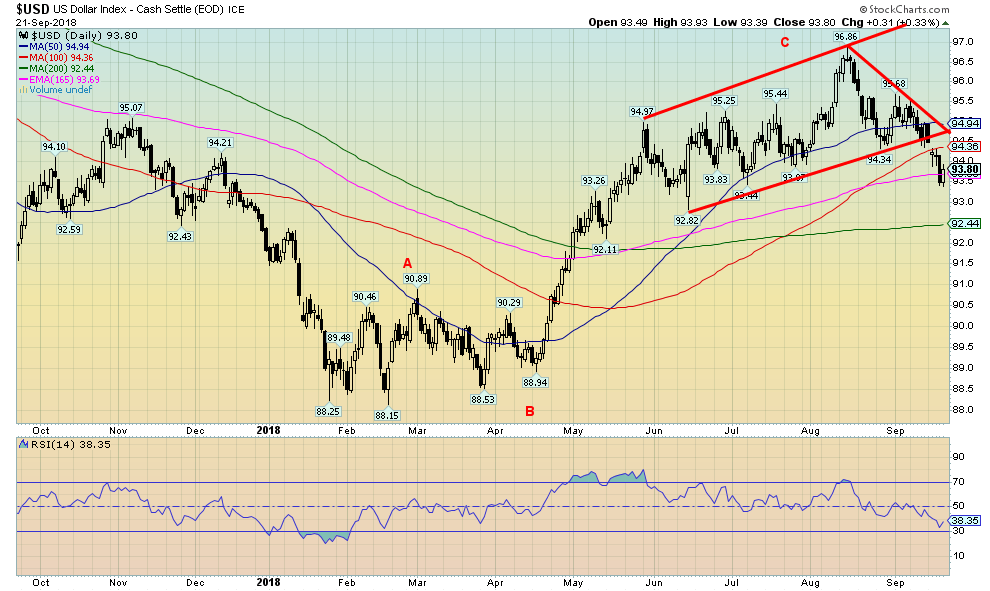
The stronger than expected manufacturing numbers on September 21 broke the down streak of the US$ Index this past week. The US$ Index finished the week down 1.2 percent. The main beneficiary was the euro that rose 1.1 percent. The Cdn$ was also up 1.1 percent as it was suspected that higher inflation numbers would force the BofC’s hand and prompt a rate hike. The pound sterling was flat after being up on the week following fears that the Brexit was going to turn into a hard Brexit with no deal. The Japanese yen was down 0.5 percent on the week.
The US$ Index appears to have broken down from a topping pattern that formed over the past four months. Note the small breakdown gap that occurred on September 18. That was followed by a sharp down day on the 20th. but the US$ Index bounced back strongly on Friday. Friday does qualify as a reversal day, given the index made a marginal new low from Thursday’s low. Note as well the US$ Index found support at the 165-day EMA. The 165-day EMA is not followed by many, but we have found it useful as a support/resistance zone. We don’t believe Friday’s up day should have much in the way of follow-through. Note resistance up to 94.35. We’d have to regain above 94.50 to suggest that the US$ Index might have more upside potential. The short-term trend has turned down. A break now back under 93.40 suggests a further decline to the 200-day MA near 92.45. The topping pattern suggests a potential decline to around 89.
© David Chapman
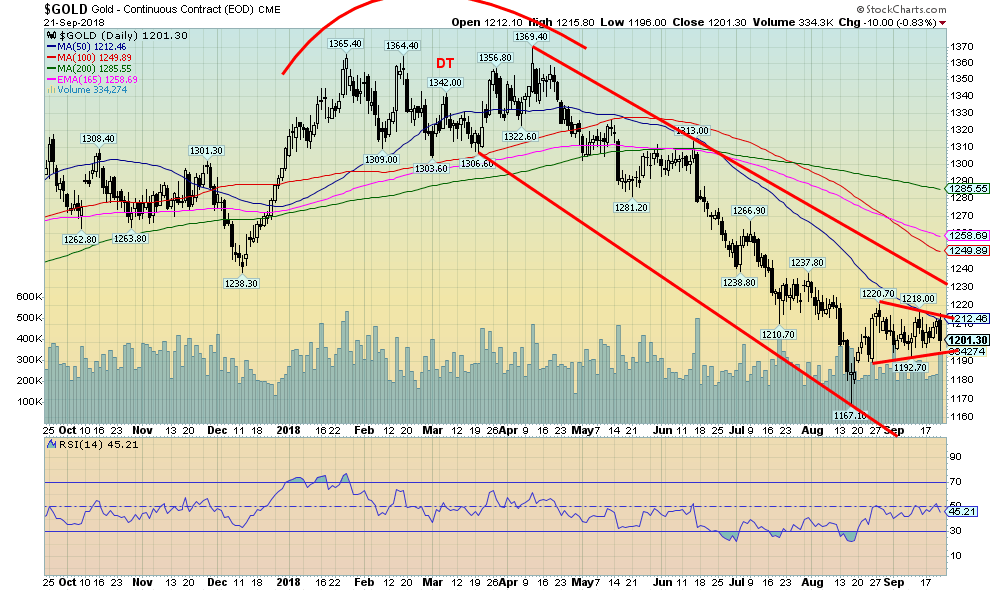
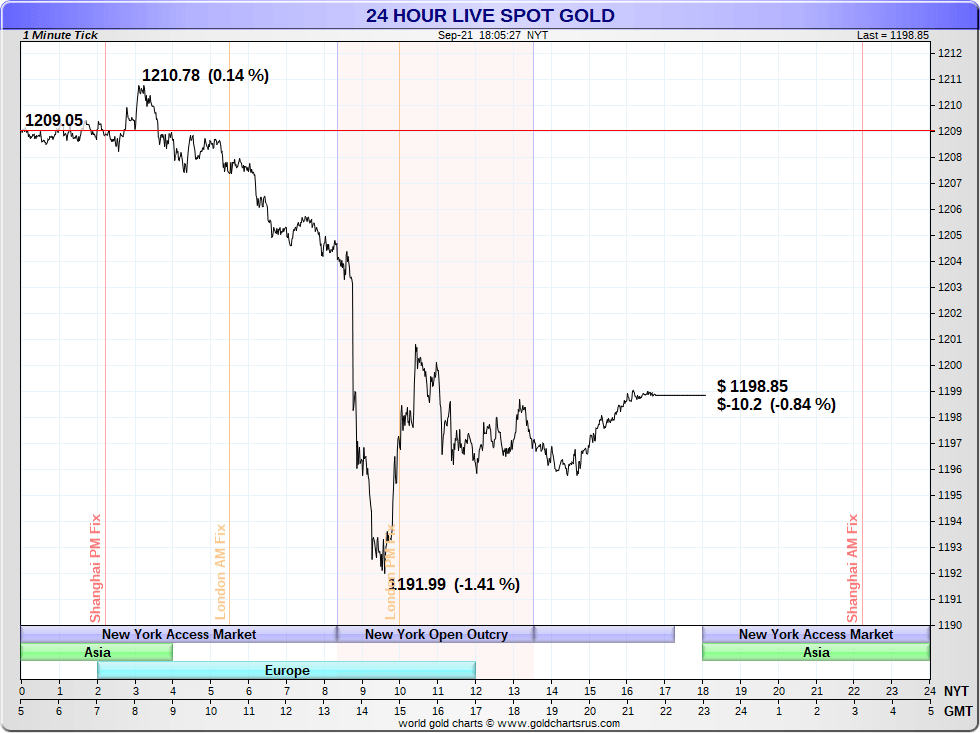
A bizarre sale of a million ounces at 8:45 am on Friday, September 21, sent gold prices reeling and down over 1 percent in a hurry (see chart below). The seller dumped 10,000 contracts (each contract worth 100 ounces) all at once. It is unknown who the seller was or why they did that. Nonetheless, gold more or less held its gains on the week. Gold was flat, although the actual was a gain of 0.02 percent or 20 cents rising to $1,201.30 from $1,201.10. While the other precious metals wavered, they held their gains. Silver was up 1.6 percent while platinum gained 3.9 percent (see chart below). Palladium, which contains some precious metals elements, had a good week, rising 7.7 percent. Copper, that many would not consider a precious metal, but is a leading metal, jumped 7.9 percent. Recall that copper has been money over the centuries. Nostalgia for the old Canadian penny. Gold appears to be forming an interesting pennant or flag pattern following the big jump seen on August 24. This formation should break to the upside and would suggest a move to at least $1,270. There is resistance up to $1,285 and the 200-day MA. We doubt the breakdown would be to the down side, but we can’t rule that out. A break under $1,190 would suggest a test of the $1,167 low and possible new lows.
Sentiment towards gold remains near record lows and as we note below the commercial COT remains quite positive for gold.
© David Chapman
Here’s a one-minute tick chart showing that drop early in NY time. This is not the first time we have seen this seemingly deliberate dumping of gold at or near the NY opening. Following the quick sell-off, gold recovered and traded higher for the rest of the day. With no follow-through, we believe that this is a one-off dump. Considering the other precious metals didn’t really follow that much, we are optimistic this should end in the coming week. Watch the Fed closely. Gold has some record of rallying out of Fed rate hikes.
© David Chapman
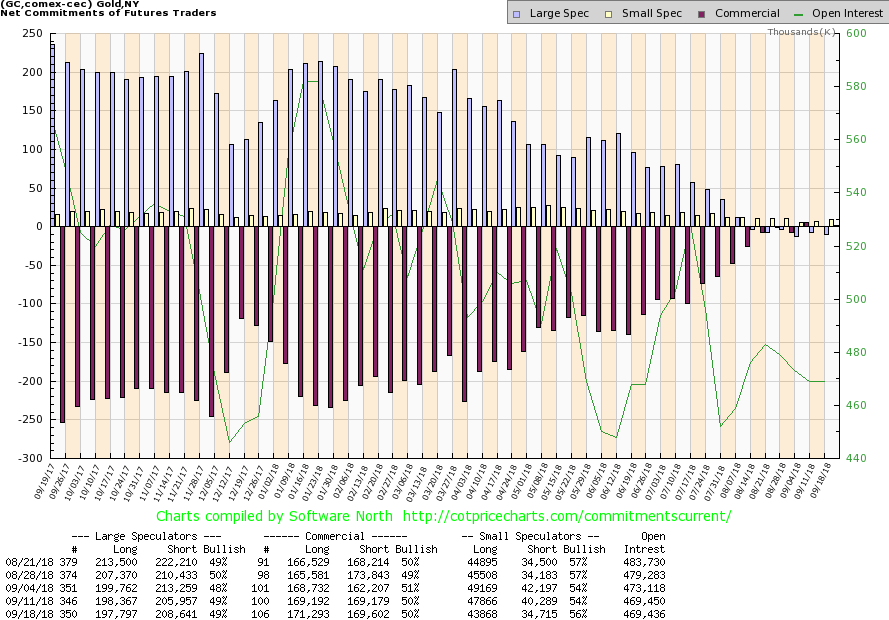
The gold commercial COT continues to be encouraging, coming in once again at 50 percent. There was very little change overall. Long open interest rose roughly 2,000 contracts while short open interest was only up about 500 contracts. Note that once again the longs exceed the shorts. Historically, the commercial COT has rarely, if ever, been positive. 2001 may have been the last time and that was a major low for gold. The large speculators continue to hold record shorts, particularly the managed futures. They came in once again at 49 percent. Historically, they are rarely, if ever, negative. All of this makes our outlook towards gold quite positive.
© David Chapman
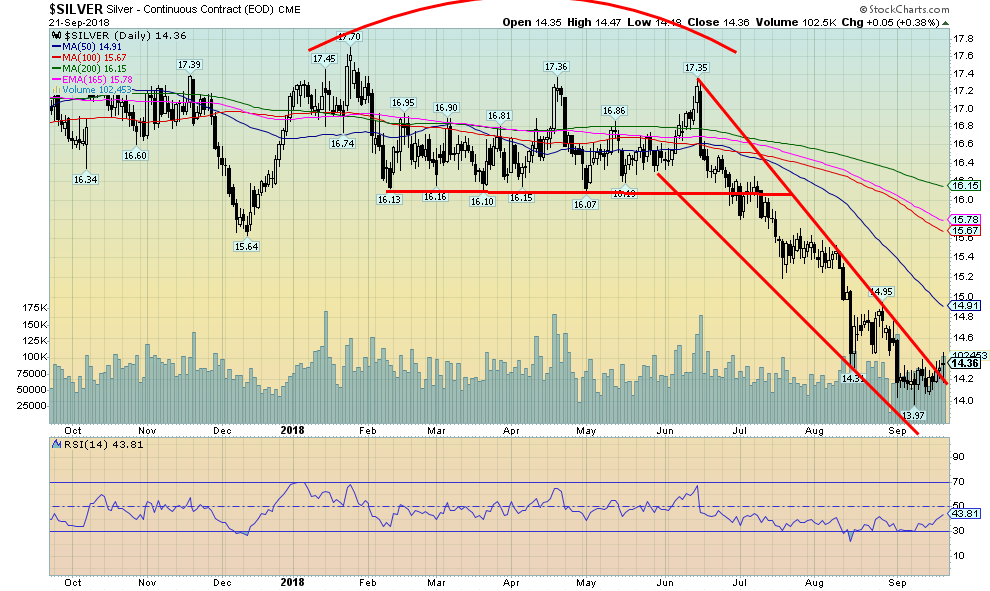
Gold may have finished the week unchanged, but silver bucked that trend by gaining 1.6 percent. On Friday, when gold was dumped silver initially followed, but the rebound on silver was stronger. Silver turned positive on the day and managed to hold that through the close. Gold lost 0.8 percent on Friday but silver gained 0.4 percent. We view that as positive. Still, silver has a lot of work to do. We view $15 as a level we need to regain to convince us firmly that a low is in. Once through that level, there is further resistance up through $15.65/$15.80. A more significant rally would get under way over $16. It is interesting to note that there was a surge of silver eagle buying in September as the price plunged. There had been supply restrictions at the U.S. Mint, but when they were removed sales soared. Sales had hit 1.9 million ounces up 28 percent from August. Even August sales were robust at over 1.5 million ounces. The low price was clearly very attractive to many. But it’s the paper market that drives the price, not the physical market. If the physical market was driving the price, the price of silver (and gold) would be a lot higher. This past week was encouraging for silver, but in closing at $14.36 it really wasn’t that far from the recent low at $13.97. Regaining $14.60 would be the first step in regaining confidence. And then after that regaining $15.
© David Chapman
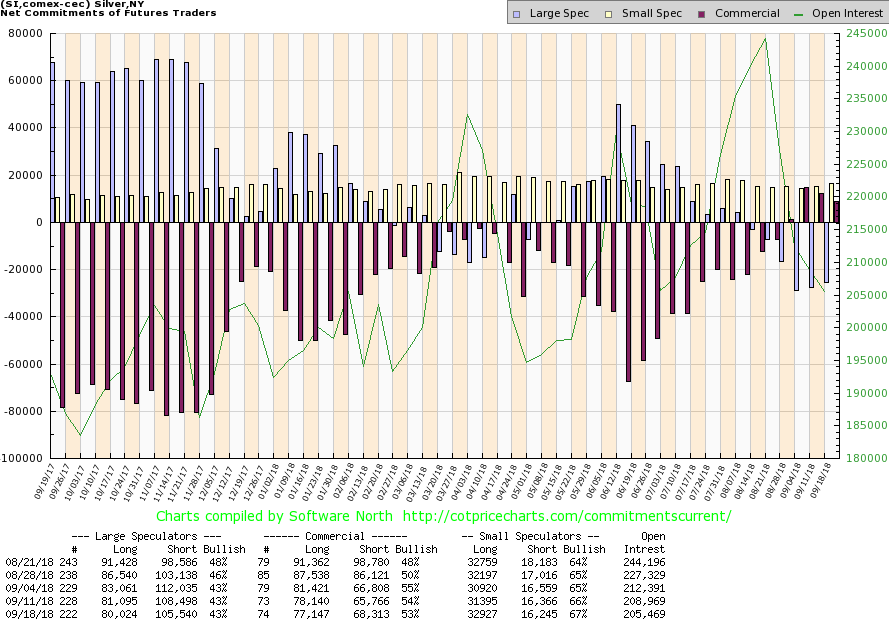
The commercial COT for silver remained quite positive this past week at 53 percent, continuing the recent streak of posting 50 percent or higher. Long open interest slipped roughly 1,000 contracts while short open interest did rise just under 3,000 contracts. The large speculators COT remained at 43 percent this past week, suggesting that the hedge funds and managed futures are maintaining their large short position. Like gold, it is extremely rare to see a positive commercial COT for silver. Our take on the silver COT is quite positive and with silver is not going to remain at such cheap prices for long.
© David Chapman
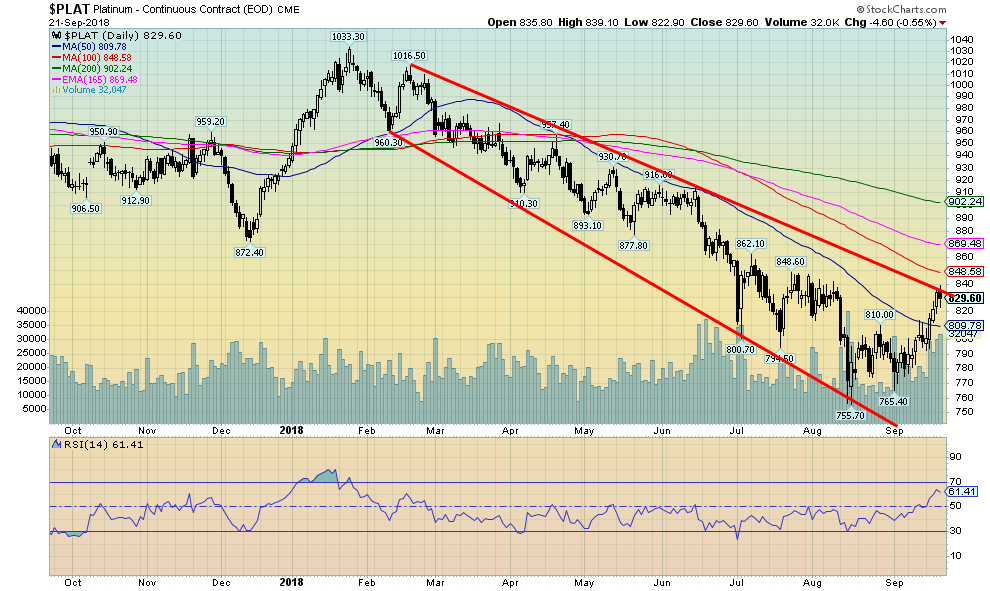
Platinum put in a good week, gaining 3.9 percent even as gold effectively stood still. Platinum is viewed as the rich man’s gold (silver is the poor man’s gold). Palladium, a metal associated more with industrial use jumped 7.7 percent and, as we noted earlier, copper leaped 7.9 percent. It may be both were responding to the positive manufacturing numbers seen during the week. Copper, however, is also viewed as a possible leader of gold prices. With platinum putting in a positive up week it too may be suggesting that gold could soon follow. Platinum is currently at resistance, but a leap over 848 could suggest that platinum’s low is in. We note a jump in volume in the past few days as well, another positive sign. The commercial COT for platinum is a positive 46 percent and has recently been as high as 55 percent. It is the most positive COT for platinum seen in some time.
© David Chapman
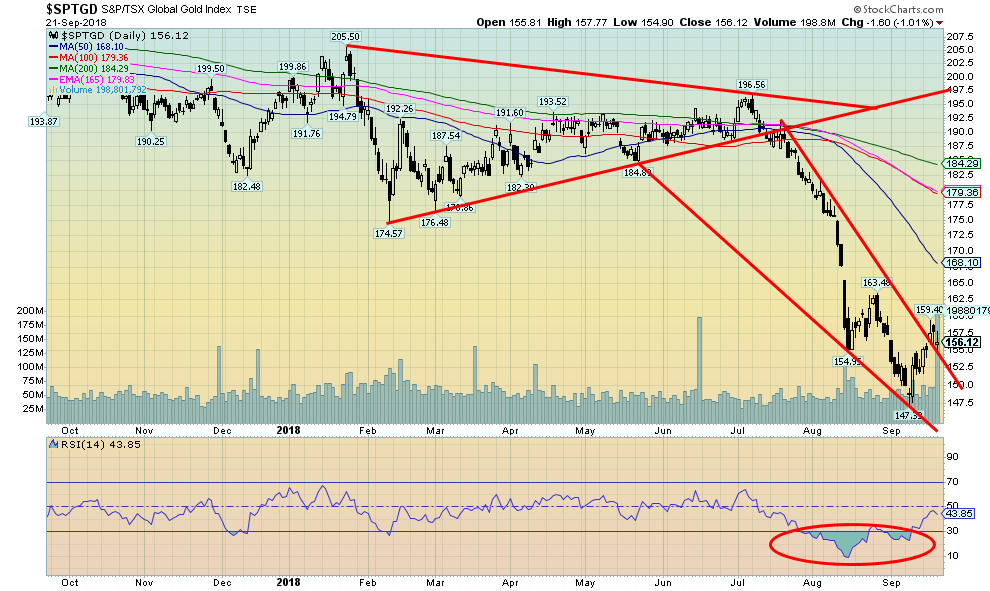
The gold stocks continue to be miserable, but we see some positive signs. First, we did put in a positive week with the TSX Gold Index (TGD) gaining 2.7 percent and the Gold Bugs Index (HUI) jumping 3.9 percent. It was the best performance in weeks. However, we won’t even pretend we are out of the woods.
While gold has been miserable so far in 2018, the gold stocks have been even more miserable. The Gold/HUI ratio, a measure of whether one should own gold or gold stocks remains at elevated levels associated with gold expensive/gold stocks cheap. It has been that way now for five years and has shown few signs of changing.
An exception was 2016, which seemed to promise to end the misery for gold stocks. At one point the TGD was up 150 percent and closed the year up 58 percent. Both 2017 and 2018 have been weak for gold stocks as once again gold has been favored over the stocks. We have never witnessed such a prolonged period of misery for the gold stocks vs. the metal.
The heady days of 2003–2008 seem but a distant memory, a period when the gold stocks were highly favored over gold. Not even during the dregs of 1999–2001 did the stocks stay as miserable compared to gold as they have this time. We do remain optimistic that the time for gold stocks will come, and negative cycles do not last forever. The first hurdle the TGD needs to take out is at 162.50, followed by regaining and holding above 168. Major resistance is up to 185, but above that level, things could look up. The fall from July through September was quite dramatic and even unexpected. There may be some more base building required before we do launch, but our sense is that we have seen the worst.
Friday was interesting because we had a high-volume day but the TGD didn’t move much, closing just above where it opened. A sign that there were a lot of players getting in while the bears were taking advantage of the bids and selling to them. Coming out of a low as we are we view that type of action as bullish.
© David Chapman
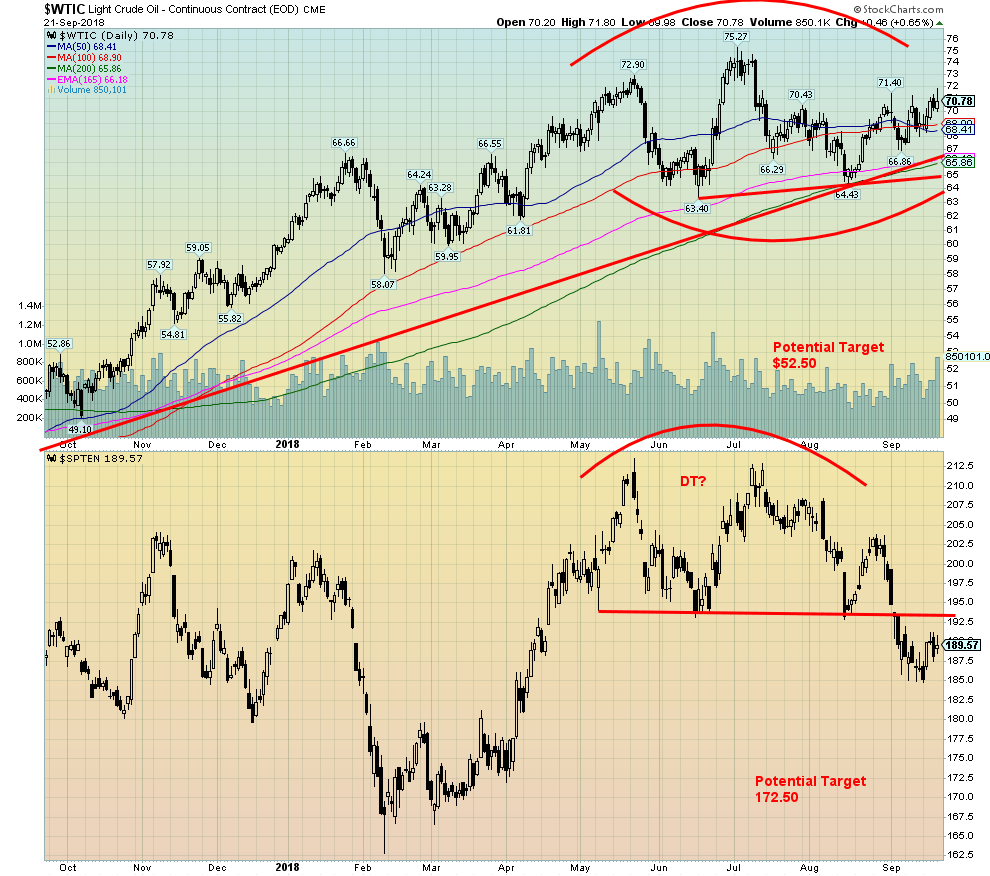
WTI oil jumped 2.6 percent this past week and is now in a position to suggest that the possible head and shoulders pattern may fail. Still, the pattern is in play until first we take out the previous right shoulder high at $71.40 and, more importantly, take out the left shoulder high of $72.90. A weaker US$ plays into higher oil prices. The sanctions on Iran that take effect on November 4 also play into higher prices.
There has been some volatility ahead of the OPEC meetings on September 23, even as some are expecting production hikes. But there are mixed feelings about production hikes as many countries want higher prices including Saudi Arabia. Saudi Arabia walks a fine line concerning production. They don’t want to hike too much so as to push oil prices sharply lower. As well, sanctions against Iran are dubious at best as China and some others seem prepared to ignore them.
The outlook from many analysts is also mixed with some expecting higher prices and others lower prices. That’s why the pattern we are looking is now becoming important. A firm breakdown under $65 could see WTI oil fall to $52.50. But taking out $72.90 would negate the pattern and new highs would likely lie ahead. It’s mixed as well for the TSX Energy Index (TEN). Regaining above 202.50 would end any thoughts of a breakdown.
Chart of the week
© David Chapman
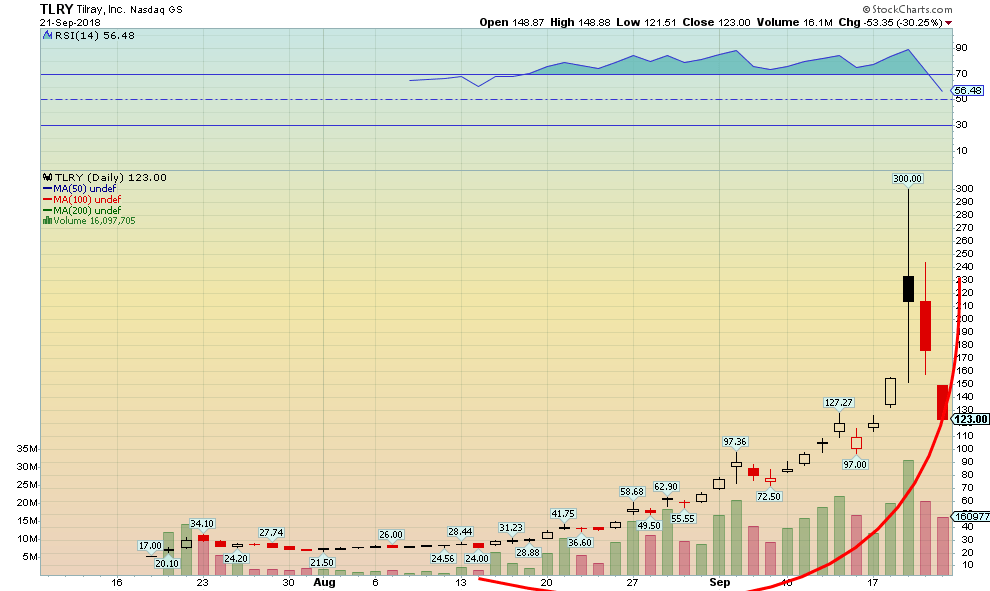
Up in smoke, or what are they smoking! Marijuana stocks have been in the news again and none more so than Tilray (TLRY-NASDAQ). Despite its NASDAQ listing, this company is actually based in Nanaimo, B.C. But this past week Tilray has been on a wild ride that must have sent its shareholders looking for a joint to calm their nerves. Tilray went public in July at $17. Since then the stock has gone “crazy.” It hit a high of $300 on September 19, 2018, a gain of over 1,600 percent. Its market cap had soared to roughly $23 billion making it bigger than many well-known Canadian companies. At that level, it was as big as Alimentation Couche-Tard or Power Financial or Magna International. A limited number of free trading stock coupled with a large number of shorts helped trigger a short squeeze and the meteoric rise.
Since then, however, it has been all down hill. Profit taking and a sense that this was “just nuts” have seen Tilray fall by over 50 percent in a hurry. If you bought at $300 you might need a toke to calm your nerves. Helping the spike was CEO Brendan Kennedy’s appearance on Jim Cramer’s Mad Money a couple of days before the stock took off. We didn’t see the show but, knowing Cramer, he swings into mega-hyperbole and most likely helped hype the stock. Cramer needs to take a toke just to bring him down from the ceiling. A reminder that Tilray doesn’t actually make much money and its revenues are still puny compared to its market cap. It all reminds us of the tech/dot.com mania at the end of the last century.
Will it recover and soar once again? Our thoughts are that Tilray, like many of the marijuana stocks such as Aurora Cannabis (ACB-TSX) (supposedly in talks with Coco-Cola but later the report was debunked), Canopy Growth (WEED-TSX) (got to love the symbol), and Cronos Group (CRON-TSX) (hooking up with Ginkgo Bioworks) may soon meet similar fates. The reality is proving to be a lot more sobering.
With legal marijuana barely a month away, a reminder that the U.S. border service has stated that employees of these companies face lifetime bans from the U.S. because of their association with a marijuana company, as marijuana remains illegal in the U.S. even though it is legal in many U.S. states. It extends to investing in them as well. We have read stories of marijuana company executives being banned even if their stock is listed on the NASDAQ.
All of this gives true meaning to marijuana stocks going up in smoke.
(All charts are courtesy of Stock Charts and COT Price Charts.)
(Featured image by DepositPhotos)
—
DISCLAIMER: David Chapman is not a registered advisory service and is not an exempt market dealer (EMD). We do not and cannot give individualized market advice. The information in this article is intended only for informational and educational purposes. It should not be considered a solicitation of an offer or sale of any security. The reader assumes all risk when trading in securities and David Chapman advises consulting a licensed professional financial advisor before proceeding with any trade or idea presented in this article. We share our ideas and opinions for informational and educational purposes only and expect the reader to perform due diligence before considering a position in any security. That includes consulting with your own licensed professional financial advisor.

-

 Cannabis1 week ago
KONOPEX Expo 2026: Celebrating Europe’s New Era of Legal Cannabis
-

 Impact Investing7 days ago
Inter IKEA Launches Electric Truck Fleet to Decarbonize Heavy-Duty Logistics in Italy
-

 Cannabis2 weeks ago
Snowtorious Krypton Enters the Polish Medical Cannabis Market
-

 Markets2 days ago
Cotton Market Weakens Amid Demand Concerns and Bearish Trends


You must be logged in to post a comment Login