Business
Dow Jones Daily Volatility’s 200D M/A Broke Below 0.50% this Week
Dow Jones bear markets are volatile markets, lots of days of extreme market volatility (Dow Jones 2% Days), days the Dow Jones moves +/- 2%, and much more from a previous day’s closing price. While Dow Jones bull markets are quiet markets, markets that march toward historic highs in baby steps, not giant bounds into market history.

This week on Thursday and Friday, the Dow Jones in its BEV chart below made its 20th & 21st BEV Zero of the rally. A rally that began last November when it closed in scoring position, a close above its -5% line, and the Dow Jones has stayed there since.
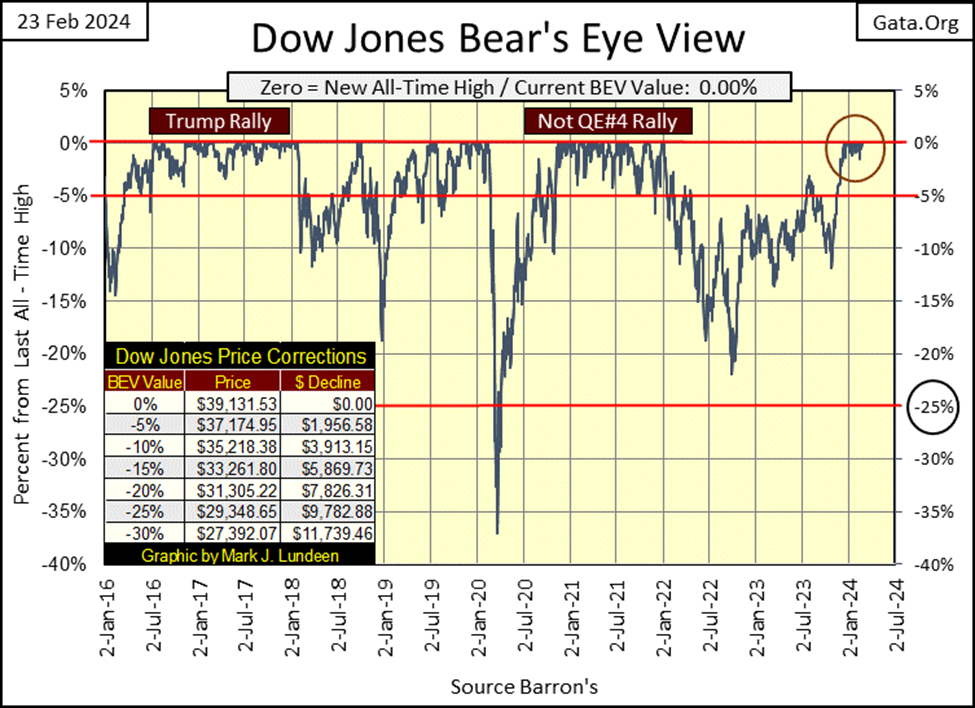
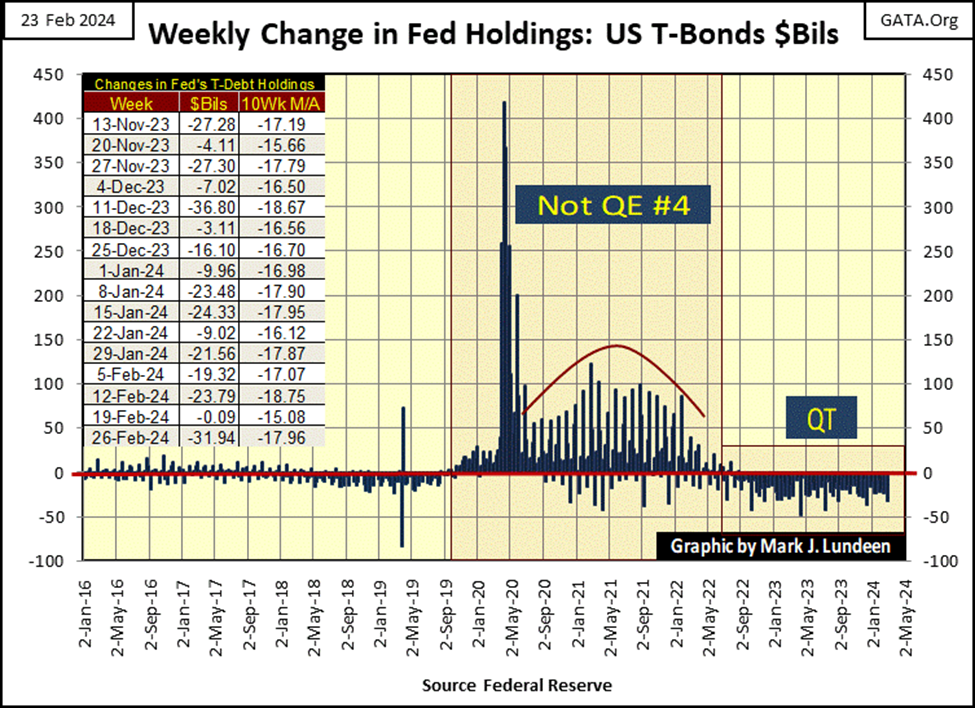
How long can the stock market rally? It shouldn’t be rallying at all, not with the idiots still shrinking their balance sheet, as they have since May 2022, as seen with the QT in the chart below. But somehow, someway, “liquidity” has been flowing into the stock market. So, the Dow Jones and other major market indexes are closing at new all-time highs once again.
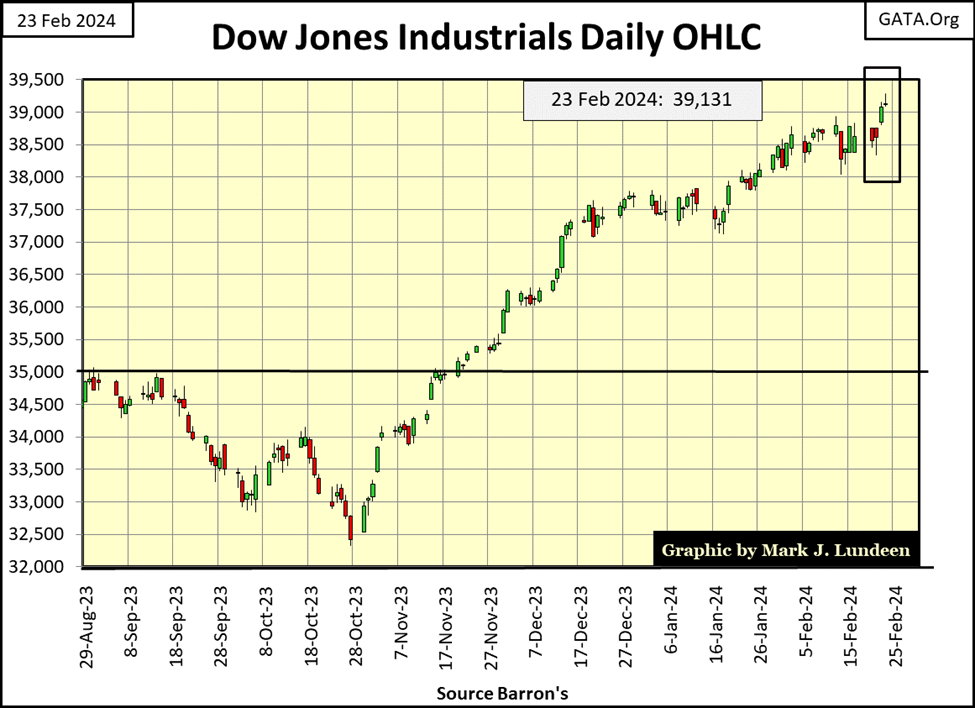
Here is the Dow Jones in daily bars below. Wednesday, I was going to call 39,000 the new line of resistance to the Dow Jones, like 38,000 was from mid-December to mid-January. Then came Thursday and Friday, and I now believe I’ll have to increase the Y-axis to something over 40,000 in the coming month.
It’s an election year. How shocking can it be that the stock market is going up?
So, is this a market people should buy into? You know my answer to that question – No! When the Dow Jones, or any market is making new all-time highs, market valuations are fully priced, because dumb money wants in at any price if the market is going up. These indexes can always go higher, and I suspect that will be true for the Dow Jones for the next few months too.
But buying into a market just because it’s making new all-time highs is coming late to the party, as it always has been, and always will be. The best gains always belong to those who buy when the market isn’t making new all-time highs, but bought when the market was trading at a discount.
The time to have entered this market was in September or October 2022, when in the BEV chart above the Dow Jones was closing with BEV values of -20% (sub 29,000). For those who did that, at the close of this week they would be sitting with a 34% gain for the last eighteen months.
I admit it; I was not recommending anyone buy way back in autumn 2022, as buying into the stock market when the idiots at the FOMC were talking about their QT, and their need to raise interest rates ever higher seemed a foolish thing to do.
The idiots’ QT is still very much going on, though now they are talking about lowering interest rates; I’m not going to buy just because the market is making new all-time highs. I’m going to wait until everyone is selling – at much reduced prices, before I begin to even think about buying.
This is a market I don’t understand. It’s doing things it shouldn’t be doing; advancing to new all-time highs as it approaches its second year of a massive QT, how is this possible? So far, the FOMC has reduced its balance sheet by $1.42 trillion dollars, a 16.75% reduction from May 2022. Why would I want to buy into that? So I’m out, and not losing any sleep because I’m out.
Next is my BEV table for the major-market indexes I follow. Eight of these indexes close the week at BEV Zeros (0.00% / New All-Time High), with the next four of them closing the week in scoring position (BEV of -0.01% to -4.99%), call them within 5% of making a new all-time high. This looks good, and I’m enjoying the show. What’s this? The NASDAQ Banking Index (#20) is down during a week that saw so many BEV Zeros? That can’t be good.
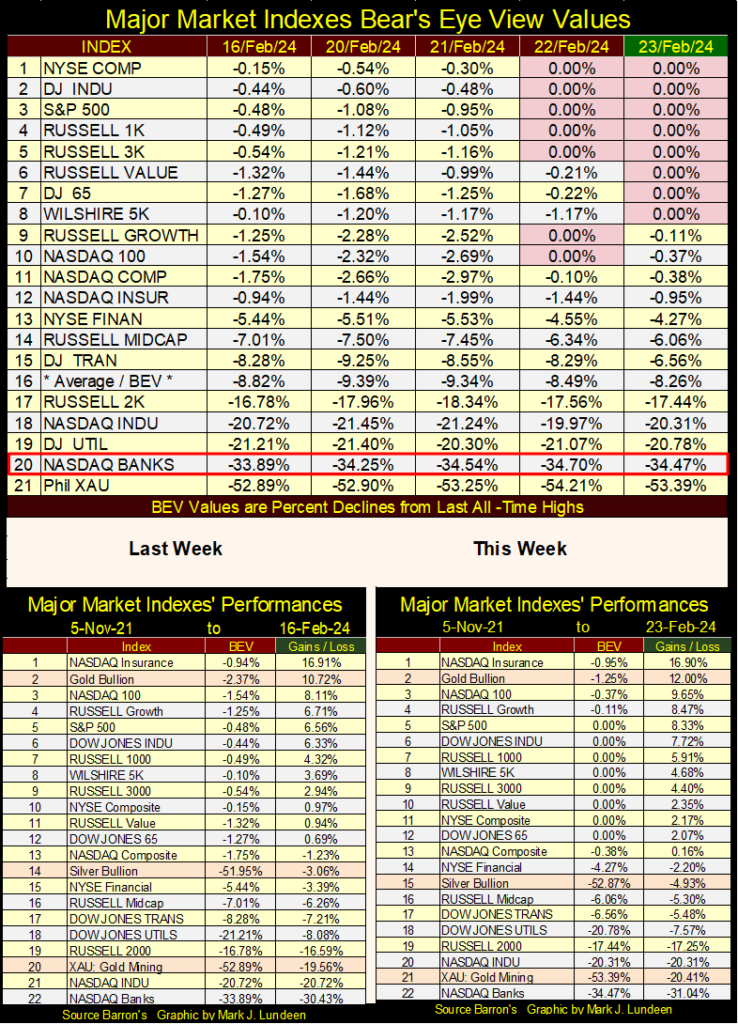
In the performance tables above, gold stubbornly refuses to lose its #2 position, while silver and the XAU each slipped down a row this past week. It’s been like this for a long time; strong gold with weak silver and the precious-metal miners. Ultimately, one of two things is going to happen. Either gold will slip down towards silver and the XAU in the weeks and months to come, or silver and the XAU will begin advancing toward gold.
I don’t care to predict which is going to happen. But as someone who refuses to buy when a market is making new all-time highs, you may have guessed I’m someone who thinks buying silver bullion and the gold miners in today’s market, is something people will be proud to have done in the years to come.
Note in the performance tables above, I use 05 November 2021 as my base date for the current market’s performance. I use 05 November 2021 as my base, as that was the top of the post March 2020 flash-crash rally, which looked like this; fifteen of the twenty indexes closed at an all-time high, with the next four in scoring position.
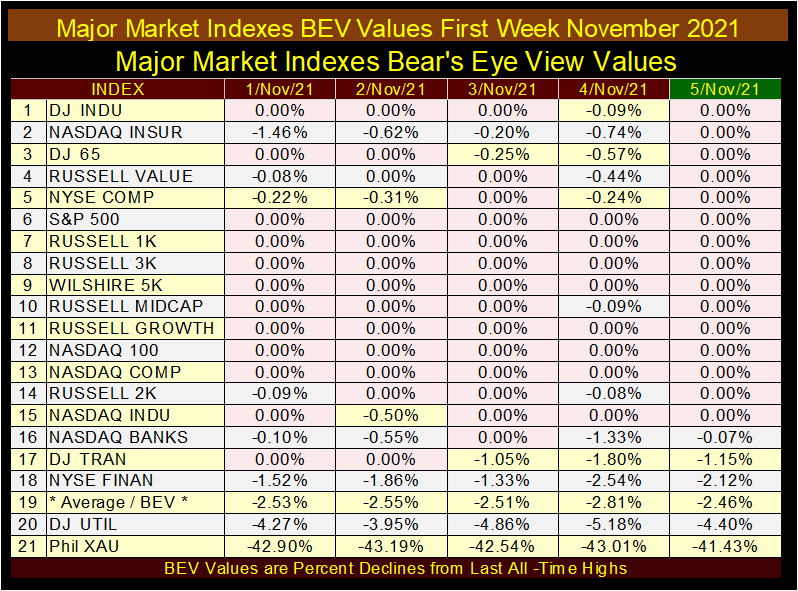
Except for the XAU, tail-end Charlie at (#21), whose last BEV Zero (0.00%) was in April 2011, things looked glorious on Wall Street in November 2021, just before it began a correction that bottomed in autumn 2022. Look at the NASDAQ Banking index (#16). Wednesday November 3rd was its last all-time high, and the banks have been lagging ever since.
Why are the banks doing so poorly on this advance? In November 2021, the banks were running with the big dogs at the head of the pack. In 2024, they’re now peeing with the puppies in the rear. I don’t like that.
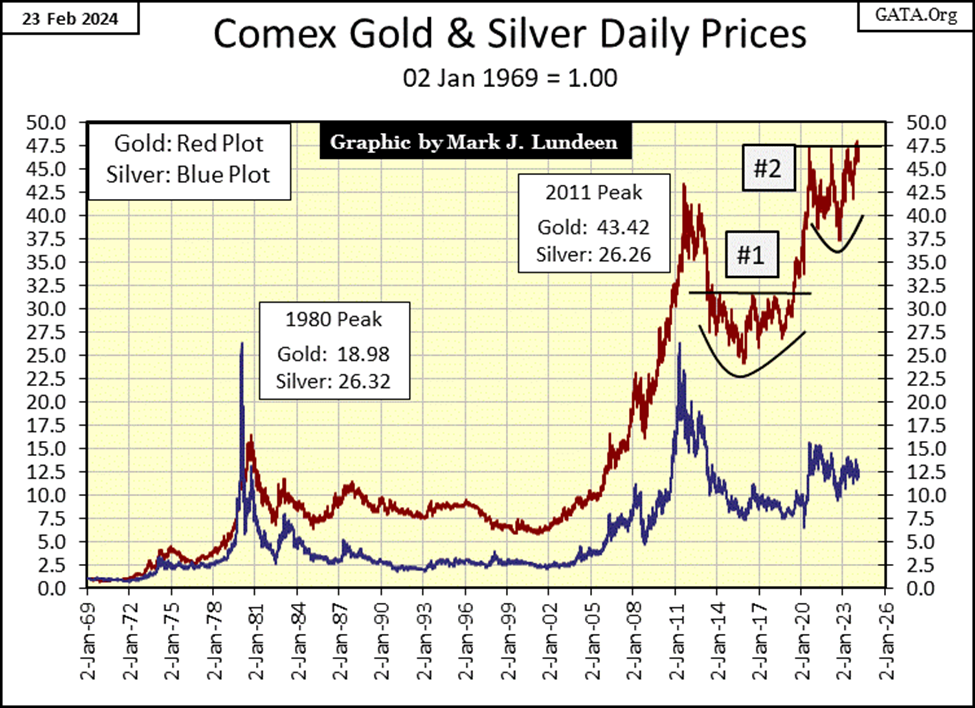
Look at the chart below plotting the indexed values of gold and silver going back to 1969. Since its high of the 1969 to 1980 bull market, gold (Red Plot) has advanced nicely, making many new all-time highs in the decades that followed.
Not so for silver, whose last all-time high remains in early January 1980! Silver, with this week’s BEV value of -52.87%, means silver closed the week 52.87% below that all-time high we see in the chart below from January 1980.
Do you want to buy cheap? Then buy silver. I, and many others have been saying that for decades. To the investment world, that today is grabbing up all the “bargains” seen trading on Wall Street, we’re looking pretty stupid for being bullish for all that time. But one of these days —!
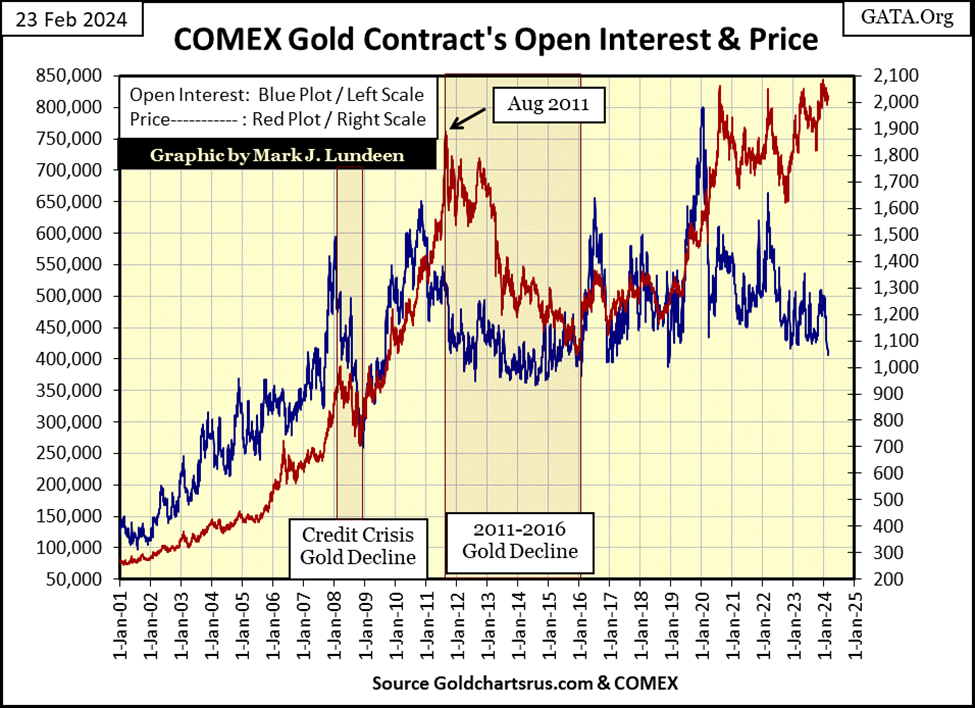
I see a lot of market commentary on the collapsing COMEX gold open interest, leading us to conclude that gold is going to do this, that, or something else. So, let’s look at COMEX futures market since January 2001, to see what happened in the past to the price of gold, when open interest increased or collapsed.
During the sub-prime mortgage (Credit Crisis) fiasco, from January – October 2008, the price of gold (Red Plot below) declined with COMEX open interest (Blue Plot), then rose when open interest rebounded from late 2008 to December 2010. Note how the price of gold continued going up until August 2011, at which point gold then followed open interest down, bottoming in December 2015.
Following gold’s December 2015 bottom, gold tracked closely with COMEX open interest; rising and falling with open interest, until January 2020, when the price of gold decoupled, and has remained decoupled from COMEX open interest since then.
For the past four years, the price of gold has been buoyant as COMEX open interest has trended downward to levels last seen during the 2011 to 2016 bear-market decline.
What does this all mean? I’m really not the guy to ask, as my professional background is in US Naval ships’ electrical systems. In my studies with the financial markets, I’m merely a market enthusiast, with a passion for compiling, and charting data from old issues of Barron’s, or other sources in the public domain.
Still, though my market background is a humble one, analyzing little squiggly lines in test equipment to see what in the hell happened in an electrical system on an aircraft carrier is something I do claim some expertise in. Looking at the squiggly lines in chart above, since January 2020, I believe something has changed in the gold market, where declining open interest is now a buoyant factor in the market.
I think the question of; what happens next to the price of gold should COMEX open interest continue collapsing is one the market still has not yet answered. Will the price of gold recouple downward, with collapsing open interest, as has been the pattern from 2001 to 2020? Or in 2024, will the price of gold finally break free from the malignant grasps of the COMEX goons trading gold contracts, with their worthless promises to deliver metal sometime in the future. Insincere promises to deliver tons of gold that doesn’t exist at the COMEX, or anywhere else, to suppress the price of gold.
Now that is the question I expect we’ll all find the answer to in 2024. For myself, I’d much prefer seeing the price of gold being fixed once again in the spot market, where actual gold is traded, and delivery taken in exchange for dollars. If that is what the current buoyant price of gold is signaling in the face of collapsing COMEX open interest, I’m all for it. If so, we can anticipate gold, and silver in the spot market to trade at multiples to what they currently do in the COMEX futures markets.
I haven’t look at commodity BEV values for awhile, so here they are below. My BEV table for stock indexes above are from daily data sets, but for commodities I only keep weekly prices in my files, and this file for commodities only goes back to 1993.
Cocoa has seen new all-time highs (0.00% / BEV Zeros) for the past four weeks, and feeder cattle two weeks ago. But everything else remains far below even scoring position, with sub -30% BEVs common. So, if inflation is making a comeback, it isn’t the producers of these commodities, like farmers and miners benefitting from these price increases.
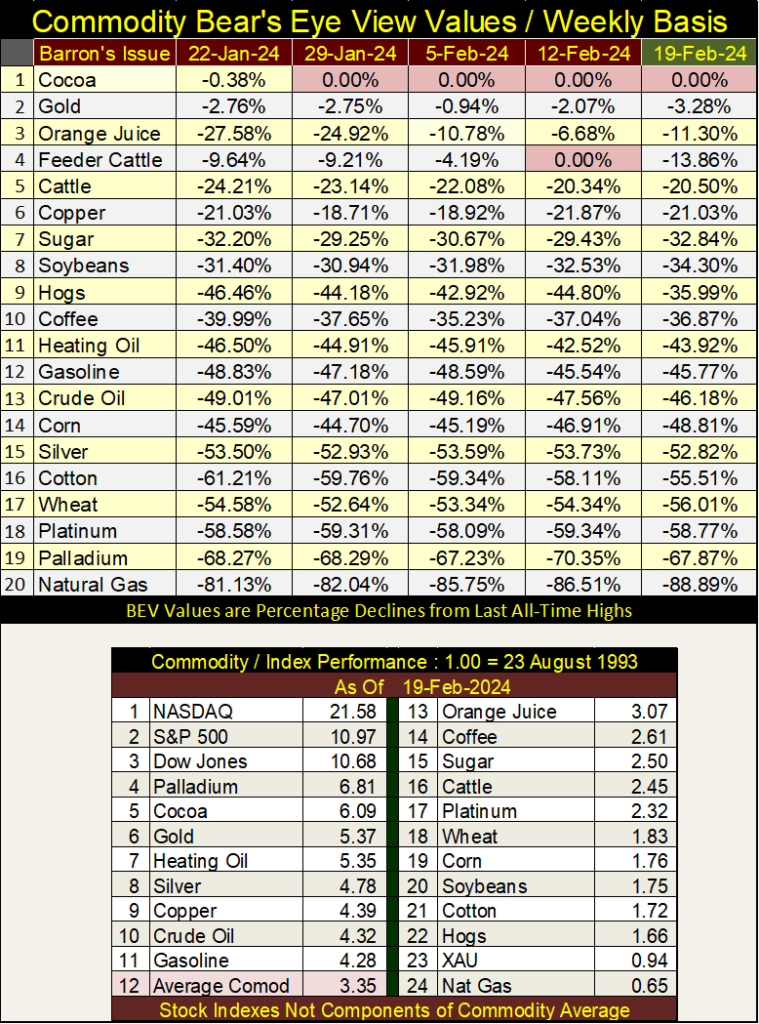
It’s the middlemen putting the squeeze on the public, and no, not the companies that provide the shops and stores the public shops at for food and other necessities. I wonder what Henry Kissinger would think about this situation?
Intellectuals are paid for thinking deep thoughts, like the quote below. But the boundary that separates good people from bad, when considering intellectuals, is the good ones realize a truth, as seen below, and use the truth to protect those who just want to work hard, raise a family, and have a happy life.
Jordan Peterson is an intellectual of the good kind.
The bad intellectuals would see a truth, as seen above, and use it to parlay power with a ruthless elite to dominate the world. Something that is happening right before our eyes, with the deep state’s endless wars, inflation, making life difficult for farmers to grow food, and their refusal to control violent crime on the streets of Europe and in North America.
Henry Kissinger passed away last November. During his life time he did some good, but I suspect he did more evil than good, based on what I’ve heard. He was key in selecting Klaus Schwab to Chair the World Economic Forum (WEF) in the early 1970s. That was very evil!
He has since gone on to meet his maker. I wonder how that interview with God went?
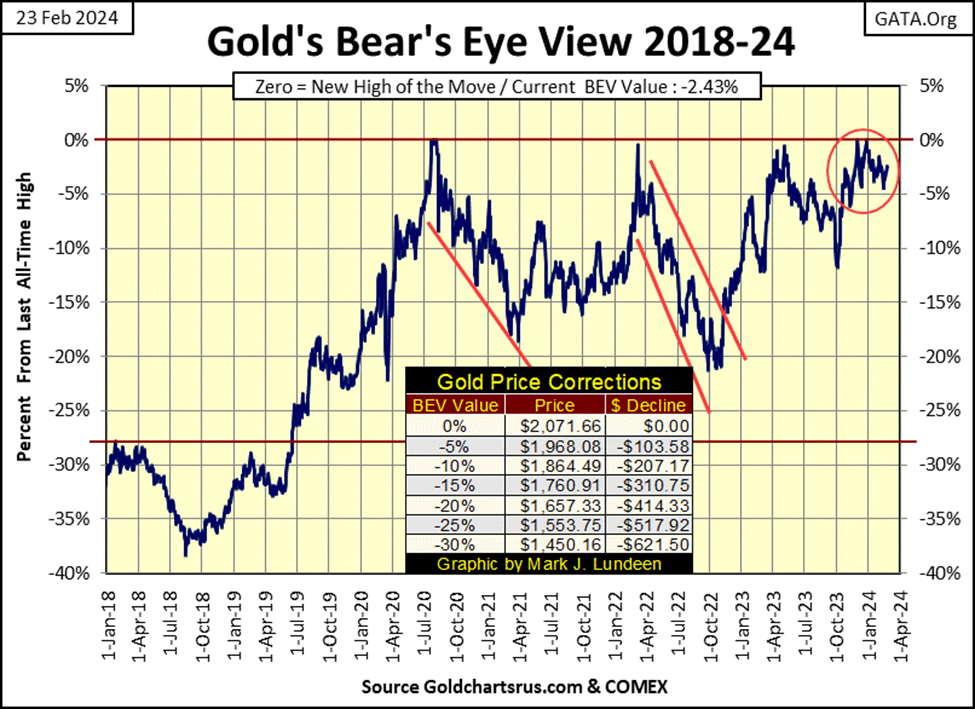
Like the Dow Jones, gold’s advance that began last November continues. I say gold’s advance only because gold’s BEV values refuse to fall below scoring position, below its BEV -5% line. But unlike the Dow Jones, where are all the BEV Zeros? Gold in this three-month advance has seen only two new all-time highs, which I find very odd.
Again this week, the steps sum tables below, for gold and the Dow Jones best illustrates the bull-market dichotomy between gold and the Dow Jones. Where are all the BEV Zeros for gold?
One problem for gold is its daily volatility’s 200D M/A continues declining. Bull markets for gold are volatile markets, with big daily percentage moves. This is because money flowing into gold and silver in their bull markets, is money fleeing deflation from other markets, making gold and silver very emotional markets when they advance or decline.
Seeing gold’s daily volatility come down from 0.57% to 0.54% in the table below, as gold continues closing daily in scoring position is an oddity, with or without BEV Zeros.
Not that such low volatility is odd, just gold’s refuses to break below scoring position, below its BEV -5% line with this low volatility during the past three months. Either gold is going to begin declining once again, or gold is going to advance to new all-time highs as its daily volatility once again begins advancing above its 1.00% level.
And what could make that happen? A massive market decline at the NYSE, or in the Treasury market, or both would do the trick!
Until we see another major market in a state of growing distress, I’m not going to get too excited, or depressed about anything happening in the gold and silver markets. In other words; the gold and silver markets are a buy-and-hold market, with little risk to the downside, but with enormous potential to the upside for those with the patience to wait for their big advances to come.
I want to see gold once again begin producing some days of extreme volatility; days gold moves of greater than +/- 3% from its previous day’s closing price, because that is what happens in bull markets for gold.
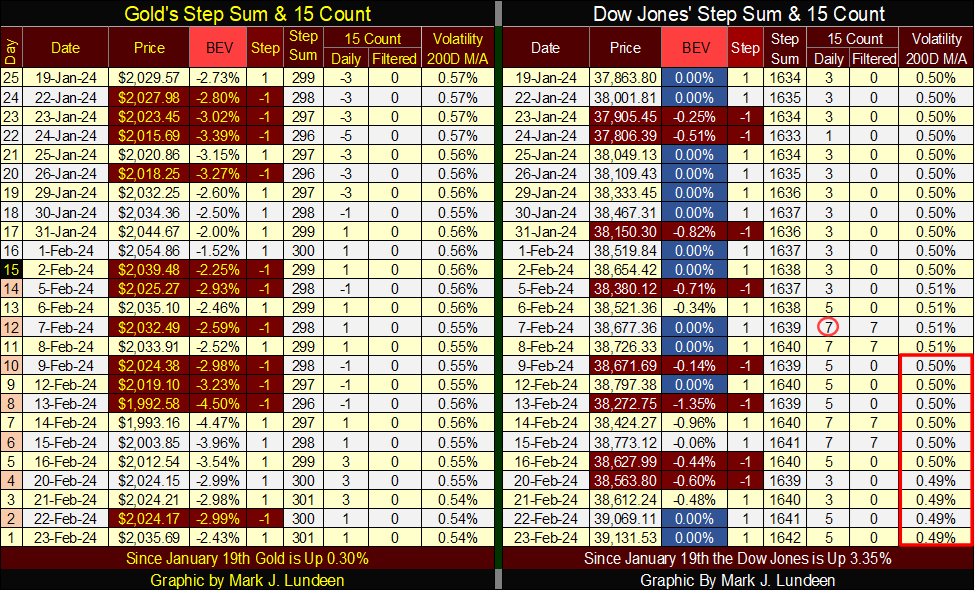
Look at all those blue BEV Zeros on the Dow Jones side of the table. For gold to close every day since November in scoring position, and only see two BEV Zeros, the last of them on December 27th, is very, very odd. It’s almost like gold is trading in a “regulated” market.
Dow Jones daily volatility’s 200D M/A broke below 0.50% this week. So what? It’s just that Dow Jones bear markets are volatile markets, lots of days of extreme market volatility (Dow Jones 2% Days), days the Dow Jones moves +/- 2%, and much more from a previous day’s closing price. While Dow Jones bull markets are quiet markets, markets that march toward historic highs in baby steps, not giant bounds into market history.
Below is chart plotting Dow Jones daily volatility’s 200D M/A going back to 1960. Every significant bear market bottom produced a volatility spike in the plot below, and the bigger the spike, the deeper the bear market.
Seeing the Dow Jones this week close with a daily volatility’s 200D M/A of 0.49% signifies the Dow Jones’ advance is close to a market top; a place where risks are maximum and the potential for reward minimum.
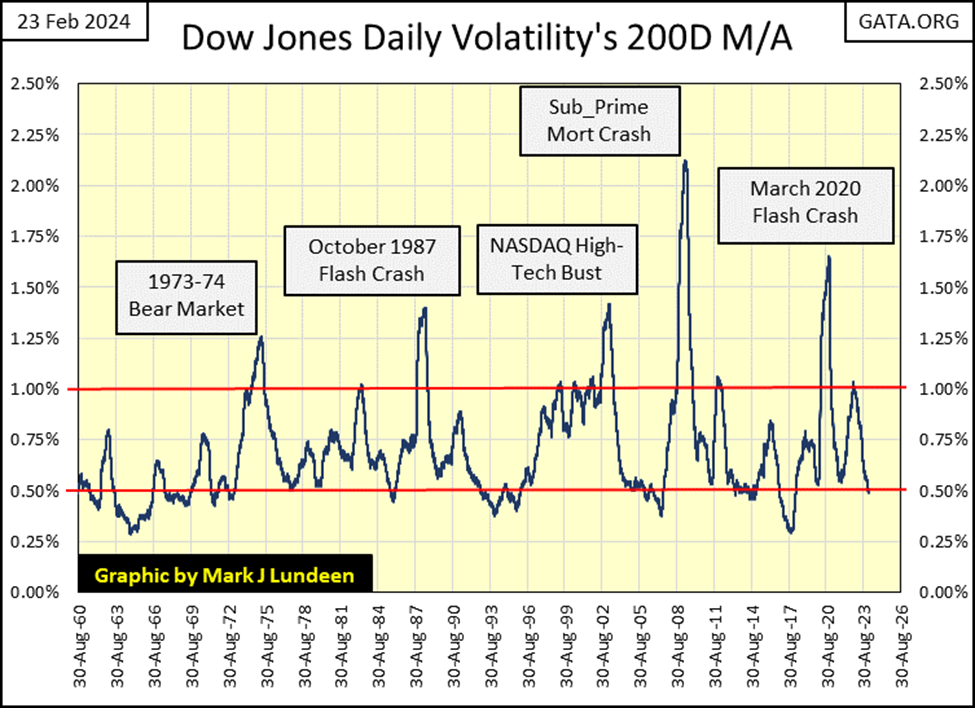
The way to use this data for profit in the stock market, is to wait until a volatility spike peaked. After daily volatility begins to decline, while the spike is still far above the 1.00% line – mortgage the farm, if not this month’s rent money, and use the proceeds to enter the market, because that is what the smart money does at bear-market bottoms.
Mind you, no one is going to tell you that mortgaging the farm, and then use the proceeds to enter the stock market at a bear market bottom is a good idea. That is because most people were buying at a market top, and held on during the bear market, and so are still licking their wounds Mr Bear inflicted on them.
But it is this lack of demand, and surplus of supply for what Wall Street is selling, that make bear-market bottoms such good times to enter a market. And if one insists on using leverage in the stock market, it’s at bear-market bottoms when buying on margin is the thing to do.
__
(Featured image by Chris Liverani via Unsplash)
DISCLAIMER: This article was written by a third party contributor and does not reflect the opinion of Born2Invest, its management, staff or its associates. Please review our disclaimer for more information.
This article may include forward-looking statements. These forward-looking statements generally are identified by the words “believe,” “project,” “estimate,” “become,” “plan,” “will,” and similar expressions. These forward-looking statements involve known and unknown risks as well as uncertainties, including those discussed in the following cautionary statements and elsewhere in this article and on this site. Although the Company may believe that its expectations are based on reasonable assumptions, the actual results that the Company may achieve may differ materially from any forward-looking statements, which reflect the opinions of the management of the Company only as of the date hereof. Additionally, please make sure to read these important disclosures.


Virginia Cannabis Market Could Reshape Regional Competition
Virginia’s planned recreational cannabis market could reshape the Washington region’s economic landscape. With nine million residents, it may draw consumers...

Bitcoin’s Price Drops as Investors Turn to Layer 2 Solutions
Bitcoin fell toward $63,000 after leveraged liquidations erased recent gains, while geopolitical tensions between the US and Iran pressured risk...


Emily.AI: Personalized Oxygen Therapy Earns Global AI Recognition
Emily.AI, Quirónsalud’s explainable AI medical device, became a global finalist at the AI for Good Summit 2026 after competing with...


Advanced Blockchain Under Pressure Amid Crypto Market Shifts
The crypto market shows diverging trends: Advanced Blockchain faces heavy pressure despite restructuring, weak finances, and ongoing transformation, though analysts...


Cannabis Regulation in Germany and Switzerland Shows Early Benefits of Legalization Models
Germany and Switzerland’s cannabis reforms suggest regulated access can reduce criminalization without increasing consumption. Germany saw fewer cannabis-related prosecutions, while...
 |
|
 |  |
 |
|
-

 Impact Investing1 week ago
ICSC Raises €500M Social Bond, Expanding Sustainable Investment Reach
-

 Fintech2 weeks ago
Swedish fintech Lysa is preparing to enter the European ETF market
-
 Fintech4 days ago
Withings Achieves Profitability in 2025 with 90% Growth Since 2018
-

 Biotech1 week ago
Circulating Tumor DNA Guides Chemotherapy Decisions in Colorectal Liver Metastases