Business
Echoes of 1929: Inflated Valuations and Warning Signs in Today’s Dow
Pearl Harbor barely moved the Dow because valuations were low after the Great Depression. In contrast, the 1929 crash followed years of Federal Reserve inflation in asset prices despite optimism exemplified by Irving Fisher’s famous statement. The author argues today’s markets resemble 1929: inflated valuations could trigger a sharp decline, with recent Dow weakness emerging.

As always, I’m going to begin with a BEV chart for the Dow Jones. But first, one thing I want to say up front; currently there are a lot of international actions happening that potentially could impact the markets. The US, and Israel are currently declawing Iran’s Islamic Republic. And I’m happy they are doing this.
This is only the latest military actions President Trump has implemented in his second term. How Trump’s latest exercise in military power could affect the markets, may best be seen by how far the Dow Jones fell from December 6th, 1941, the day before Pearl Harbor, and December 8th, the day after.
As seen below, following, Pearl Harbor on Sunday, December 7th, the Dow Jones was down 3.50%. Which is almost nothing, considering the global impact Pearl Harbor had on global political-economics since 1941.
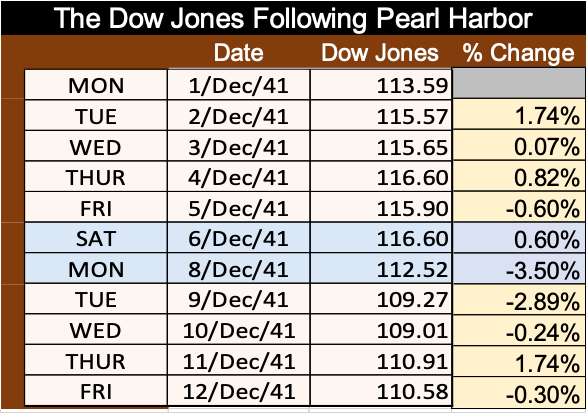
Why Pearl Harbor had so little effect on the Dow Jones, is because following the depressing 1930s’ Great Depression market crash, market valuations in the American stock market weren’t inflated to grotesques levels. So, massive deflation in market valuations in December, 1941, for even Pearl Harbor, were never a possibility.
Then take the Dow Jones’ last all-time high for the Roaring 1920s Bull Market on September 3rd, 1929. The world was at peace. There were no complex, diplomatic problems festering anywhere in the world. On September 3rd, 1929, there was nothing but blue birds and sunshine, for a far as the eyes could see.
In October 1929, just six days before the bottom fell out from under Wall Street, Irving Fisher, an economist from Yale University, who at that time had what we today would call “Rock-Star Status,” declared the follow.
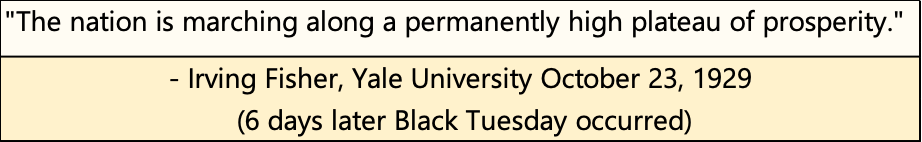
Yet, the Dow Jones still crashed by 89% at its Great Depression bottom on July 7th 1932.
Why? Because by September 1929, the idiots at the FOMC had since 1925, inflated market valuations grotesquely, making a market collapse of 89% in the next three years inevitable, independent of anything Washington did, or didn’t do in the early 1930s.
The question we should all ask ourselves is; in March 2026, are market valuations in financial assets, inflated to grotesques levels? To which I say; yes they are, and have been for decades, since Alan Greenspan became FOMC Idiot Primate in August 1987.
So, maybe something President Trump is doing may prove to be a triggering event, to something bad to the downside in the markets. But if an explosive deflationary event follows, it was because the idiots at the FOMC, had first inflated market valuation far above anything, economic, & monetary prudence would have allowed.
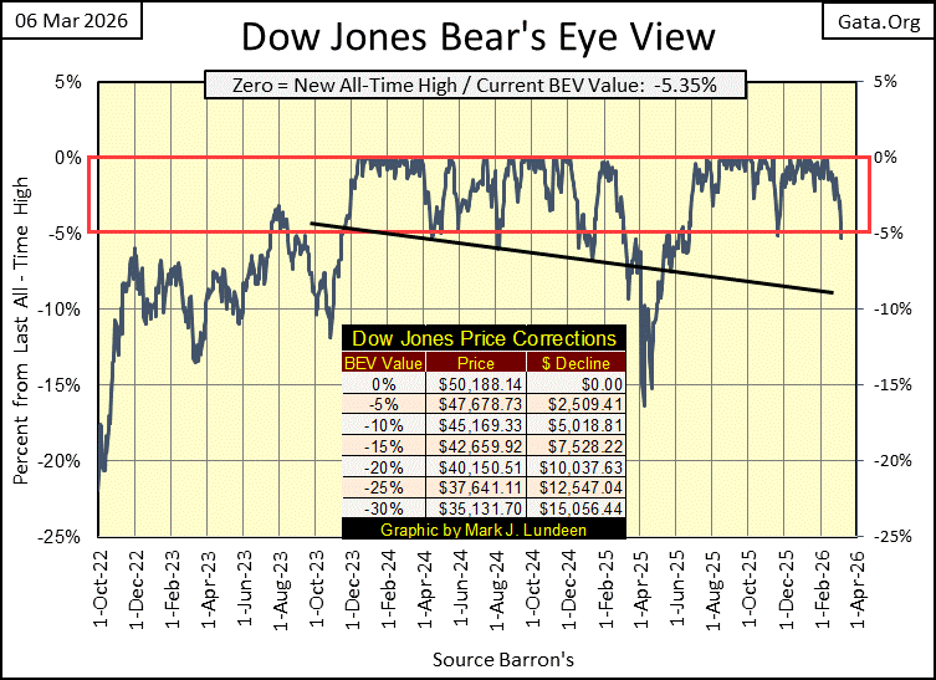
Okay, so we now take a look at the Dow Joens’ BEV Chart below. The Dow Jones last all-time high (BEV Zero = 0.0%), was on February 10th. In the sixteen trading days that followed, none closed more than 3% from the Dow Jones’ last all-time high, until Tuesday of this week, with a BEV of -3.36%. This is still inside scoring position, but the Dow Jones appeared to be losing steam.
Then came Thursday, which saw the Dow Jones close with a BEV of -4.45%. Again, inside of scoring position, but getting close to the Dow Jones BEV -5% line. On Friday’s close, the Dow Jones closed with a BEV of -5.35%, which is definitely outside of scoring position, but not something that is terminal to this bull market advance. Still, in this week’s BEV chart for the Dow Jones, we see the origins of something potentially bad for the stock market in the making.
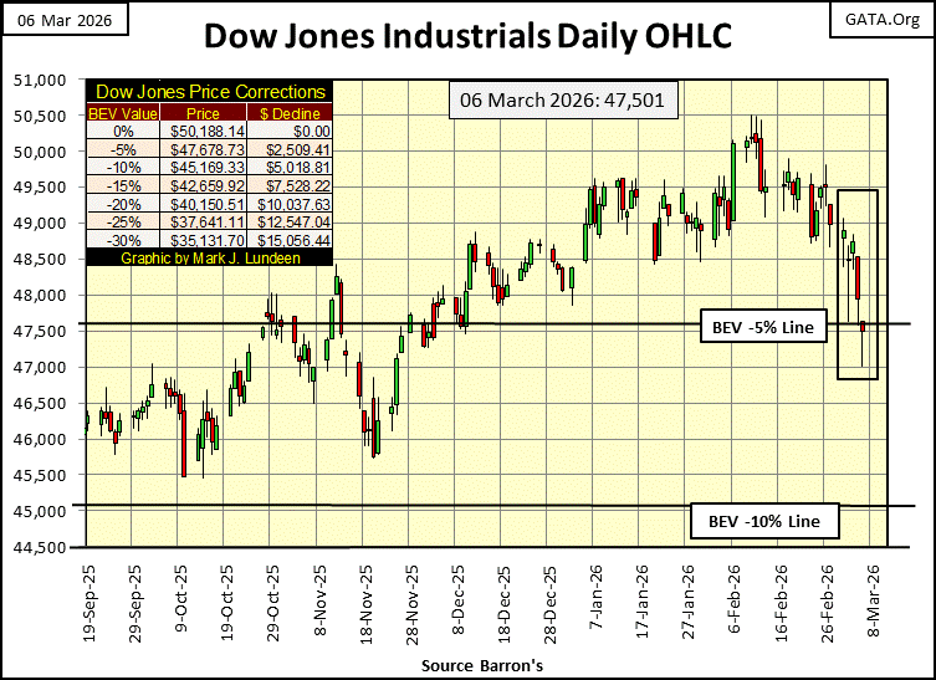
Below, the Dow Jones in daily bars, looks rather tired. I’ve stated that 60K on the Dow Jones is very possible, possibly inevitably should things as they are now, continue unchanged. Looking at the market action of the past few weeks, maybe the Dow Jones will first see 40K, before we see it at 60K.
But that is just me being pessimistic. I’m not going to think about this too much, and I’m going to keep it simple; is the Dow Jones trading inside of scoring position, somewhere between its last all-time high, and its BEV -5% line, within 5% from its last all-time high?
Not on this week’s close. That, plus on Tuesday this week, the Dow Jones in mid-day trading, broke fifty-dollars below its BEV -5% line at 47,678, on its daily low (47,628). It then closed up for the day by eight dollars, eight-dollars above where it opened the day at 48,493. Looking at the Dow Jones in its daily bar chart below, on Tuesday when the Dow Jones broke below its BEV -5% line, someone didn’t want the Dow closing below scoring position.
Then on Thursday, once again this week the Dow Jones traded below its BEV -5% line, before pulling back up, to close down, but still in scoring position for the day.
Then came Friday, where for most of the day the Dow Jones traded below its BEV -5% line at 47,678, the Dow Jones almost broke below 47,000!
Keep in mind, since the Dow Jones entered scoring position in November 2023, it has traded below its BEV -5% line before, only to then recover, and make additional new all-time highs.
I remember reading the old guys, before the 1970s, who wrote market commentary for anyone willing to listen. A point they would make, a point we today would do well to remember, was if someone could enter a bull market within 10% from a bear market’s bottom, and exit, sell all of it within 10% of a bull market top, they do better then 90% of the professional money managers.
That sounds like sound advice in March 2026. Based on the fact that one cannot go broke taking profits in the market, should the Dow Jones continue trending down to its BEV -10% line, it would be prudent to sell a good percentage of one’s positions in the market. The only exception to that, would be for any gold and silver miners you have in your account.
The Dow Jones, and everything else trading in the stock market has been going up since August 1982. This seem like a big-bull market to most people, and it is. But I think of this forty-four-year advance in the stock market, as only a huge inflationary bubble inflated into the stock market’s valuations.
How well did commodities do, compared to the stock market, say from August 1993 to this week? Why August 1993? That is when FOMC Idiot Primate Greenspan, first began inflating market valuations in the NASDAQ’s high-tech companies.
I keep a file for weekly closing prices for some commodities, as seen in chart below. I indexed these commodities to 1.00 = 23 August 1993, then average these weekly indexed values, from August 1993 to this week’s close. This commodity price average, does not include the stock averages seen in the chart’s table. At this week’s Thursday’s close, the average for these commodities (#11 in the table), was up by a factor of 5.24, since August 1993.
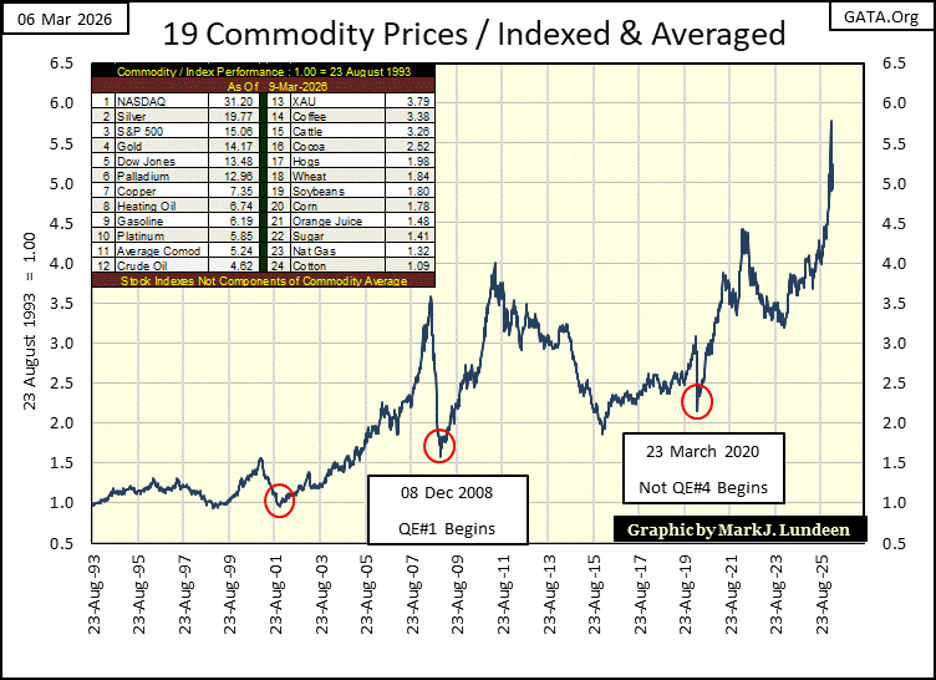
Which was a lot, when compared to the advances seen by agricultural commodities listed further down in the table. The energy complex was up slightly more than this average’s value of 5.24.
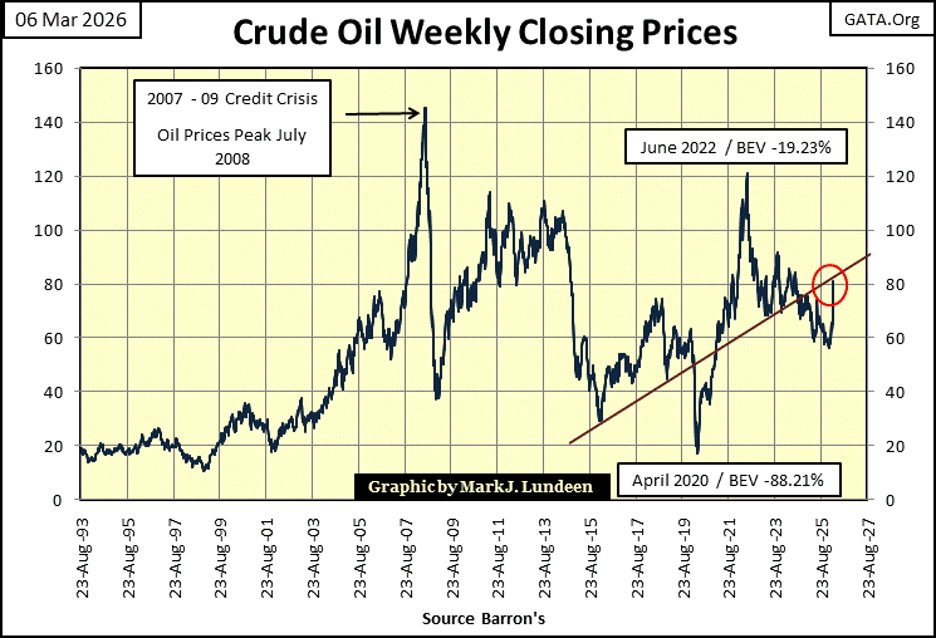
Here is a chart for crude oil. It’s about to break above its trend line that goes back to 2015. Is the market thinking of $100 a barrel crude oil?
What made this average of commodities prices rise so much since August 1993, were the gains see in the precious metals complex.
The NASDAQ Composite (#1), has increased by a factor of 31.20. But silver closed this week at #2, up by a factor of 19.77, better than the S&P500 and the Dow Jones. So, if the NASDAQ Composite, S&P500, and Dow Jones’ valuations have been inflated to bubble proportions, and at risk of deflating to levels far from where they are now; why can’t we say the same for gold and silver?
Because at a bull market top, assets become widely owned by the investment public. I can make a case that gold and silver have been advancing in a bull market since 2001, based on price action. But after a quarter of a century of advancing prices in the old monetary metals, can you make the case that everyone now owns some gold and silver in 2026?
The XAU (#13), the gold and silver mining index, remains cheap. This week it has increased by a factor of only 3.79 since August 1993. I had to double check that, and yes, the XAU is up by a factor of only 3.79 since August 1993.
I’m assuming, in March 2026, for most money managers, and individual investors, they would still rather drink poison, than buy a gold or silver miner. To my way of thinking about markets, that makes the gold and silver miners compelling market values, now in March 2026.
At the top of a bull market, when market valuations have inflated to their greatest extent, everyone is in the market. That is true for the stock market, especially so for the ever-popular NASDAQ High-Tech issues.
With every inflationary boom, comes the deflationary bust. This pending deflationary bust, will take a few tens-of-trillions-of-dollars in market capitalization down with it. At the bottom of such a bear market, will there be anything of value to be traded at the NYSE, or even the Treasury Bond Market? I hope so, but I wouldn’t guarantee it.
Let’s now look at my table listing BEV values for the major market indexes I follow. There were no new BEV Zeros this week, and only nine of these indexes closed in scoring position on Friday’s close. “Liquidity” is clearly draining from the market.
We’ve seen these indexes BEV values do exactly this on a few other occasions since the Dow Jones entered into scoring position in November 2023, and they have always recovered, and generated additional new all-time highs for this bull market advance. That may happen again, and then maybe not.
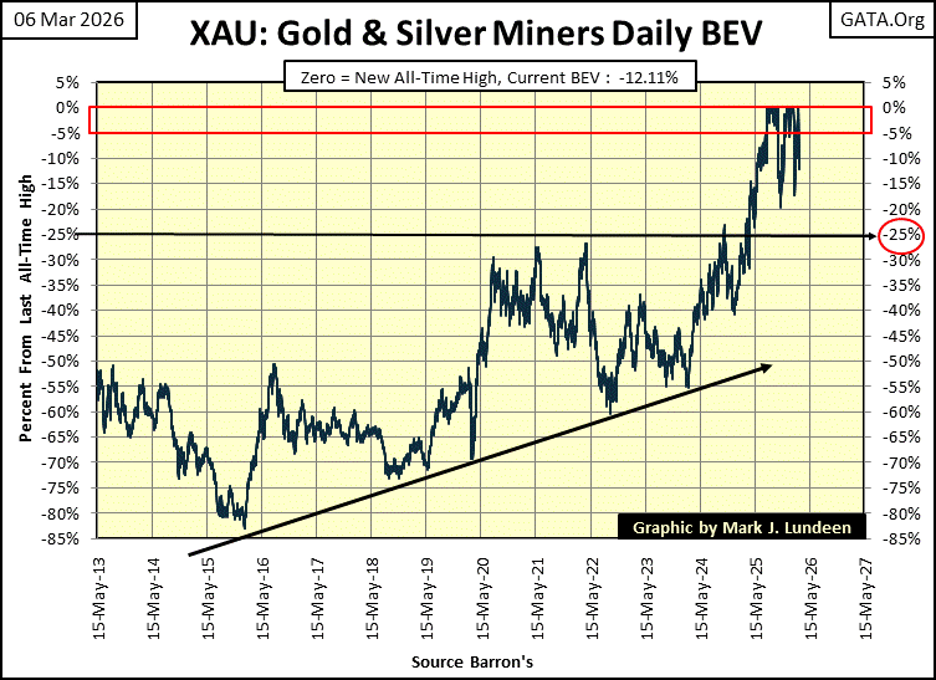
Look at the XAU at #20, it closed the week 12.11% below its last all-time high, which is exactly what a BEV of -12.11% means. But not seen this week, is on Thursday and Friday of last week, the XAU closed at BEV Zeros (0.0% = new all-time high). So, the gold and silver miners lost over 12% from an all-time in a single week!
Yes it did. But if you study the XAU’s BEV chart below, since the XAU began making new all-time highs again in August 2025, they have been very volatile. Seeing the XAU’s BEV value decline to -20% would not necessarily bearish for the gold miners. For the precious metal miners, maybe scoring position should be between the BEV Zero (0.0%), and their BEV -15% lines.
A huge factor for the gold and silver miners in the XAU, they are now bouncing off the bottom of an 80% bear market bottom from a decade ago, see BEV chart below. Since April 2011, they have made only a handful of new all-time highs, starting only six months ago. Unlike everything else trading in the stock market, the XAU remains cheap, and so are compelling market values. What can I say, but I like them.
In this week’s performance table, silver bullion, the XAU, and gold bullion remain in the top three spots, by significant margins. And I think that is how it will remain, for a long time to come.
Looking at the gold inventories held at the COMEX below, we see oddities; oversized swings in holding of gold at the COMEX. Starting in March 2020, gold holdings are either surging, or draining from the COMEX. What does all this mean? I haven’t a clue. But I like looking at market data for those times when extremes happen, exactly as seen below, as such extremes may prove to be precursors to bull or bear market’s top or bottom.
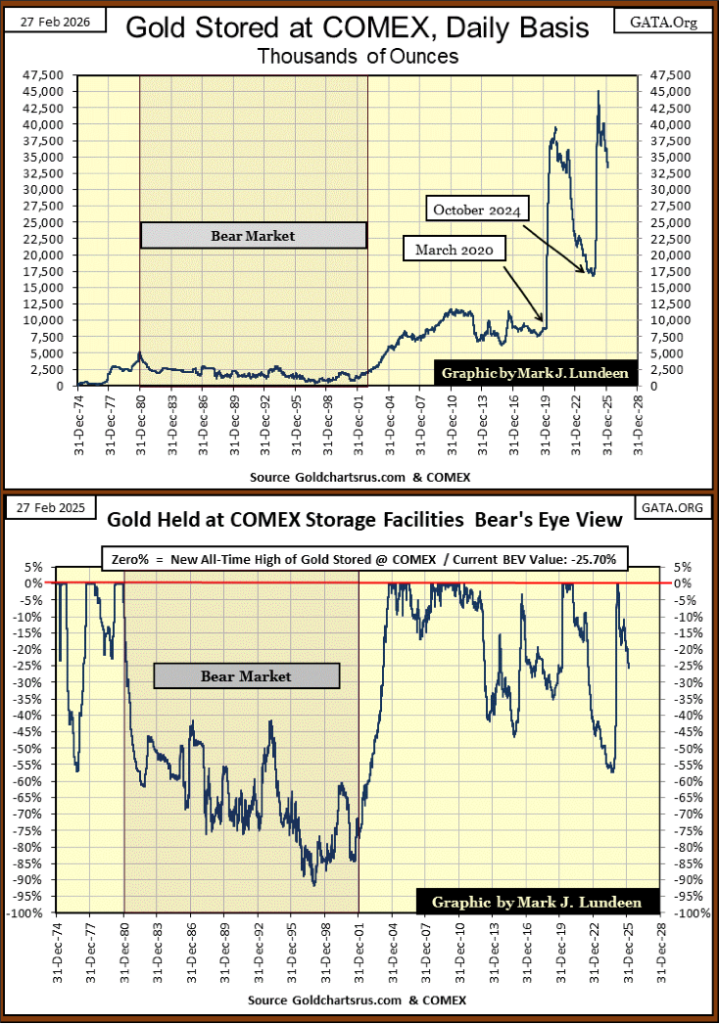
Below is the same data for the COMEX silver inventories. Gold and silver bullion, by the ton as seen above and below is very expensive to ship from one spot on planet Earth, to another, which is what we are seeing. Why are the owners of this gold and silver spending what, hundreds-of-thousands, or millions of dollars to first send their metal to the COMEX, and then ship it back out.
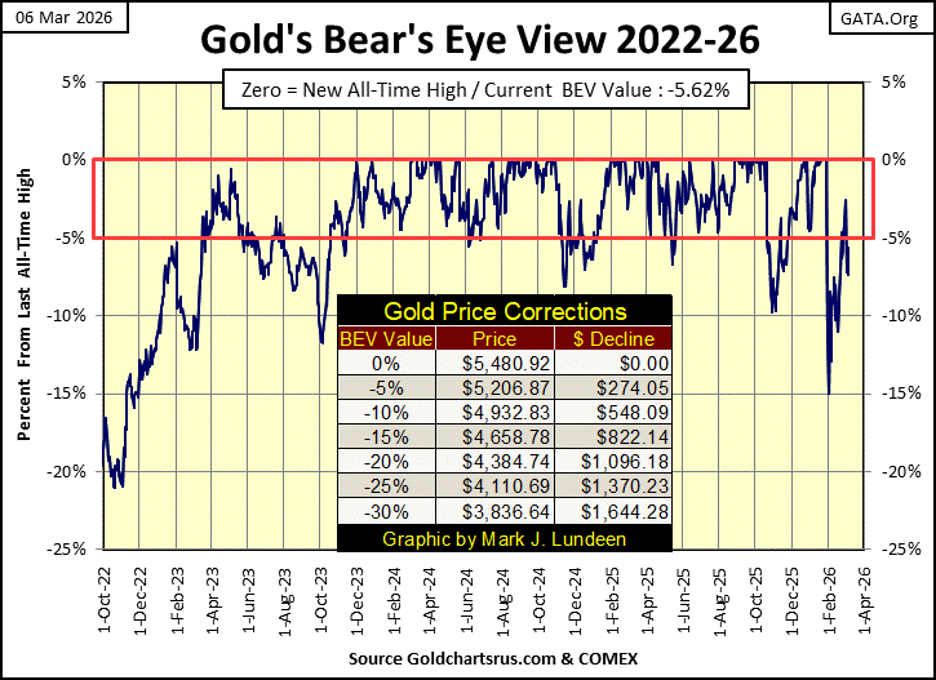
Here is gold’s BEV chart. From its last all-time high on January 28th, gold corrected to its BEV -15% line, in its BEV chart below, and has since fought its way back into scoring position for a couple of days, before falling back out of scoring position, below its BEV -5% line this week. In early March 2026, gold looks very positive, and we should see it trade at much higher prices as 2026 moves on towards 2027.
A big reason for me to think that, is seen in the chart below. Gold’s days of extreme volatility, days where gold moves more than +/- 3% from a previous day’s closing price, has jumped up greatly so far in 2026.
So far in 2026, gold has seen eleven days of extreme volatility. A volume of extreme days not seen since 2008, and we are only in the third month of 2026.
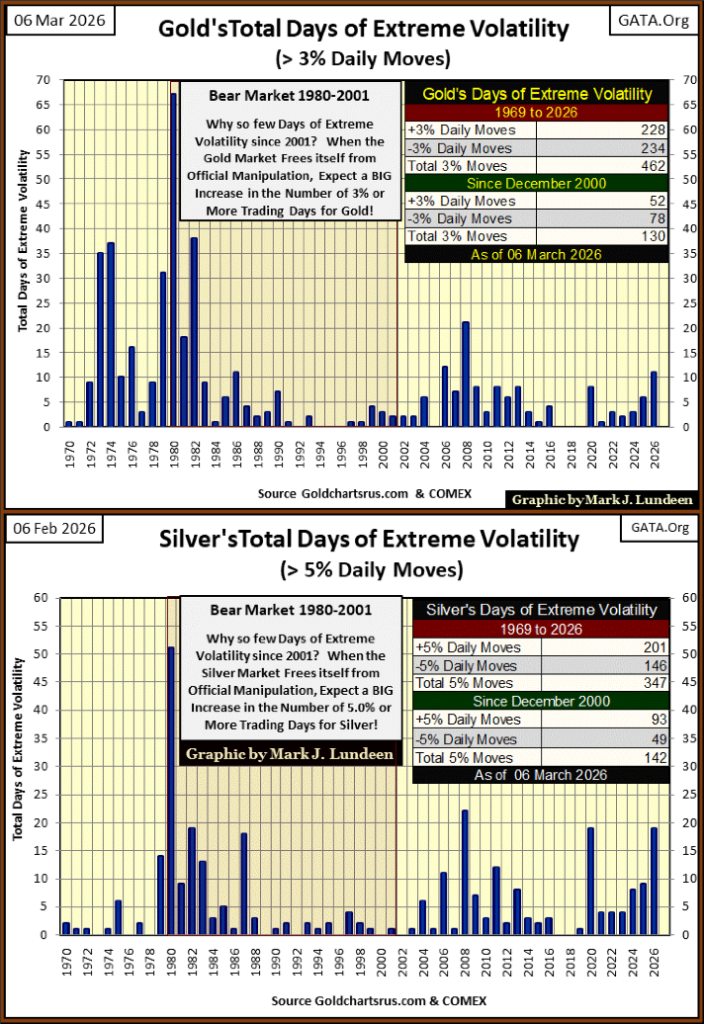
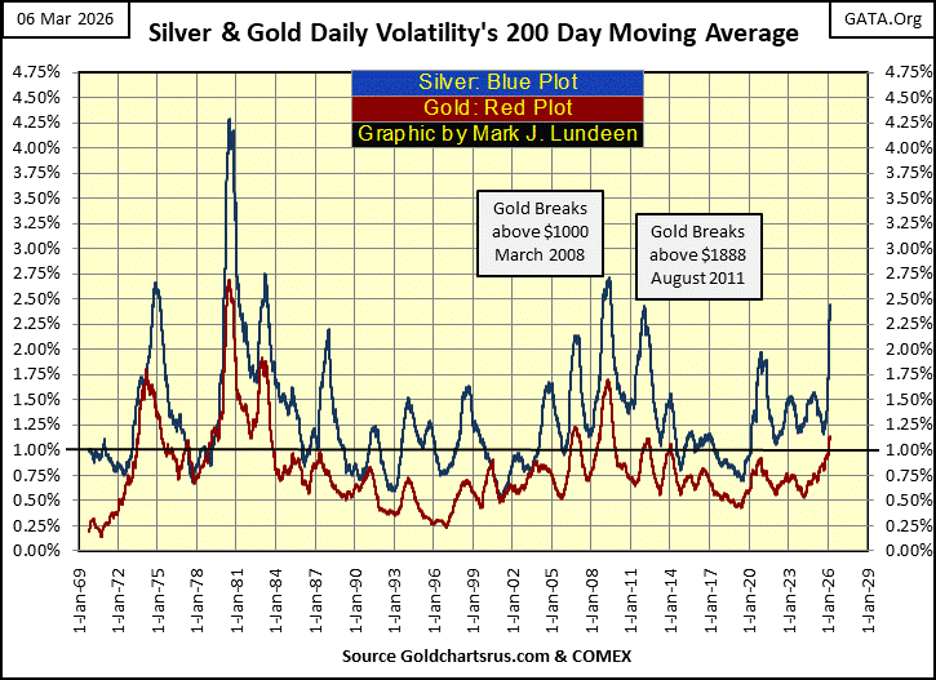
Silver, as seen above, has seen nineteen extreme days so far in 2026. Why daily volatility has increased as it has for gold and silver, as seen in their days of extreme volatility seen above, and in their Daily Volatility’s 200D M/A below, I don’t exactly know. But so far, this increase in daily volatility has proven to be bullish for the old monetary metals.
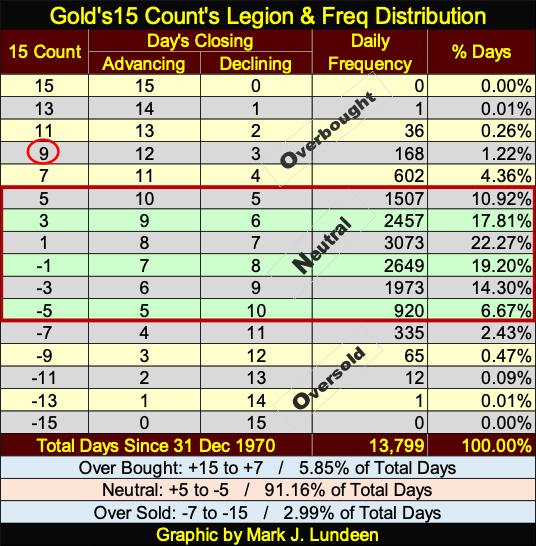
Now on to gold’s step sum table below. Last Friday, gold’s 15-count saw a +9, making gold a very overbought market, as seen in gold’s 15-count’s legion, & frequency distribution table below. Since 31 December 1970, gold has closed with a 15-count of +9, for only 168 (1.22%), of its 13,799 trading days.
That plus, since Thanks Givings in late November, gold’s 15-count has been positive, indicating advancing days outnumber daily declines, and gold’s 15-count has seen frequent +7s, indicating gold is an overbought market. Looking at the table below, a 15-count of +7 doesn’t happen very frequently.
Since late November, gold has seen eleven new all-time highs. The last of them happened on January 28th. Since then, gold’s 15-count has remained positive; more daily advances than declines, but no more new all-time highs. That plus, gold’s BEV has failed to remain in scoring position, even though gold is seeing more daily advances than declines. Yes, seeing so many more daily advances than declines below for gold, and gold can’t remain in scoring position, let alone make a new all-time high for over a month now, is very odd.
What should we make of this? That the bulls and the bears in the gold market, have been slugging it out for quite a while. But one of these days, either the bulls, or the bears are going to get tired and walk away from the fight. Should gold begin making a new series of new all-time highs, we’ll know the bulls won. If gold breaks below its BEV -15% line, we’ll know the bears won.
But should the bears win in this struggle in the gold market, their victory will be short-lived.
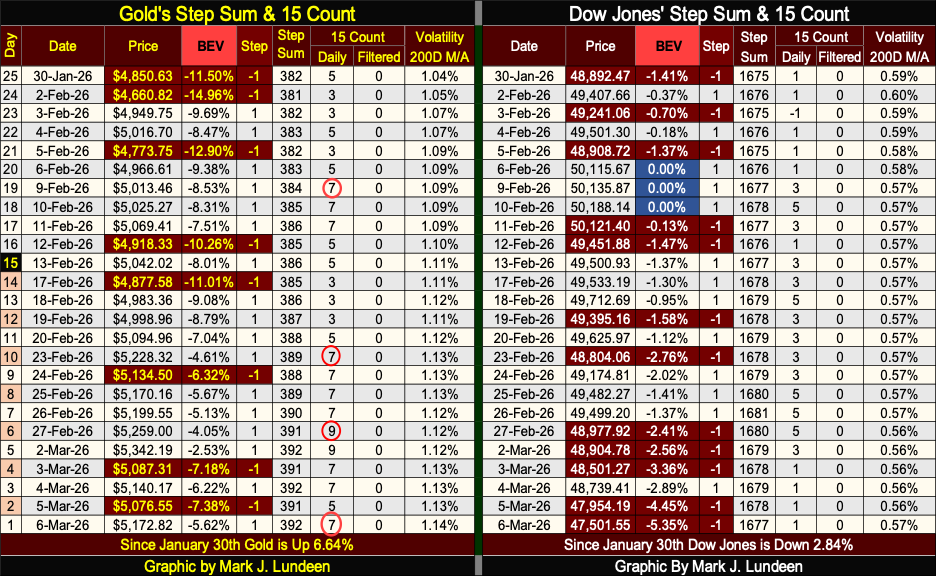
Unlike gold, the Dow Jones is seeing more daily declines, but not enough to drive its 15-count into negative territory. But since the Dow Jones last all-time high on February 10th, the Dow Jones remained in scoring position; within 5% of its last all-time high, until this week’s close on Friday. What is next for the Dow Jones? More weakness, or additional new all-time highs?
I’ll tell you all about it, come March 28th, three weeks from now.
__
(Featured image by Adeolu Eletu via Unsplash)
DISCLAIMER: This article was written by a third party contributor and does not reflect the opinion of Born2Invest, its management, staff or its associates. Please review our disclaimer for more information.
This article may include forward-looking statements. These forward-looking statements generally are identified by the words “believe,” “project,” “estimate,” “become,” “plan,” “will,” and similar expressions, including with regards to potential earnings in the Empire Flippers affiliate program. These forward-looking statements involve known and unknown risks as well as uncertainties, including those discussed in the following cautionary statements and elsewhere in this article and on this site. Although the Company may believe that its expectations are based on reasonable assumptions, the actual results that the Company may achieve may differ materially from any forward-looking statements, which reflect the opinions of the management of the Company only as of the date hereof. Additionally, please make sure to read these important disclosures.


Vexuvo Secures €7.4M to Boost Agrivoltaic and Storage Growth
Vexuvo and the Sella Group have reached 7.4 million euros in total funding to support renewable energy growth. A new...


CAR-T Cell Therapy Induces Remarkable Remission in Patient with Multiple Autoimmune Diseases
A 47-year-old woman with three severe autoimmune diseases received CAR-T cell therapy at a German hospital, achieving one-year remission without...


Markets Rebound Briefly as War Risks and Inflation Persist
Artemis II’s safe return contrasted with failed peace talks, ending hopes of a sustained ceasefire. Markets briefly rallied on optimism,...


Dow Jones Near Highs Amid Low Volatility but Caution Signals Emerging
The Dow Jones recently closed near record highs after only a mild 10% correction, suggesting market strength. However, a few...


The TopRanked.io Weekly Digest: What’s Hot in Affiliate Marketing [LiveChat Affiliates Review]
Quick Disclosure: We’re about to tell you how LiveChat Affiliates run a top-notch affiliate program. And we really mean it....
 |
|
 |  |
 |
|
-

 Crypto2 weeks ago
Bitcoin Slides, Ethereum EEZ Emerges, Worldcoin Hits Low
-

 Crypto3 days ago
Bitcoin Stalls as Geopolitical Risks and Crypto Industry Tensions Persist
-

 Africa1 week ago
Casablanca Stock Exchange Profits Surge in 2025 as Growth Momentum Strengthens
-
 Africa5 days ago
Foreign Exchange Markets Walk a Tightrope Amid Geopolitical Tensions and Policy Uncertainty