Markets
A Great Week for the Dow Jones. But What about Next week?
Following overwhelming selling in the Dow Jones in the two previous weeks, this week the bulls just began buying on this market weakness. That plus bond yields have come down a bit, something the stock market always likes to see. So, do the bulls continue to take the market higher? Or do the bears begin selling into the market strength?
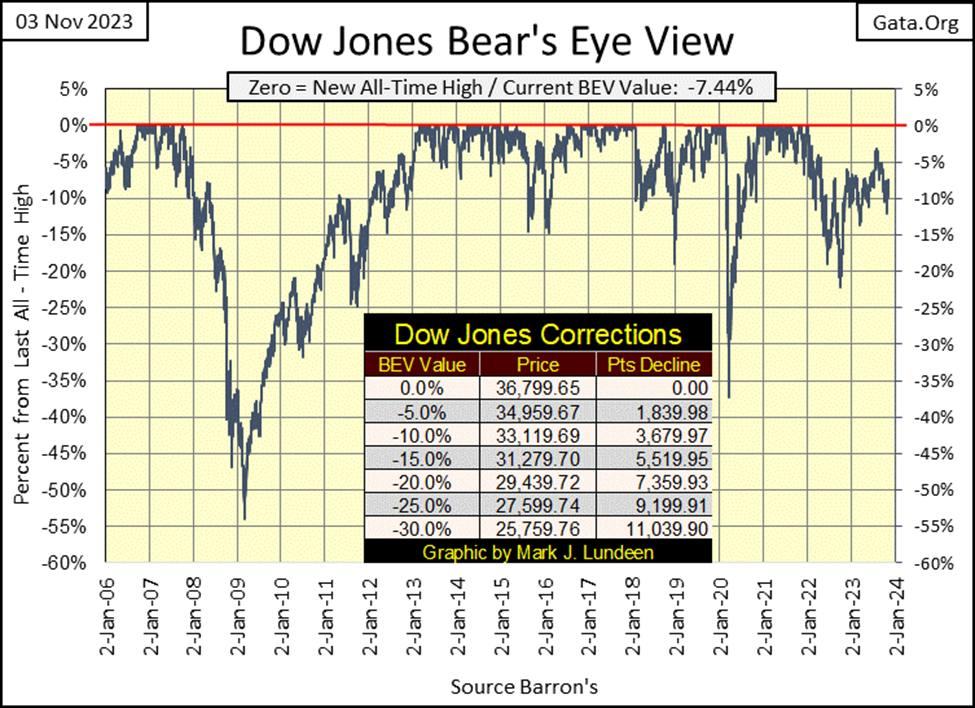
The stock market was remarkably strong this week; five daily advances lifted the Dow Jones up by 4.47BEV points in the chart below, or 1,644 points since last Friday. I’m not going to argue with success, it was a very good week for the Bulls. But what about next week?
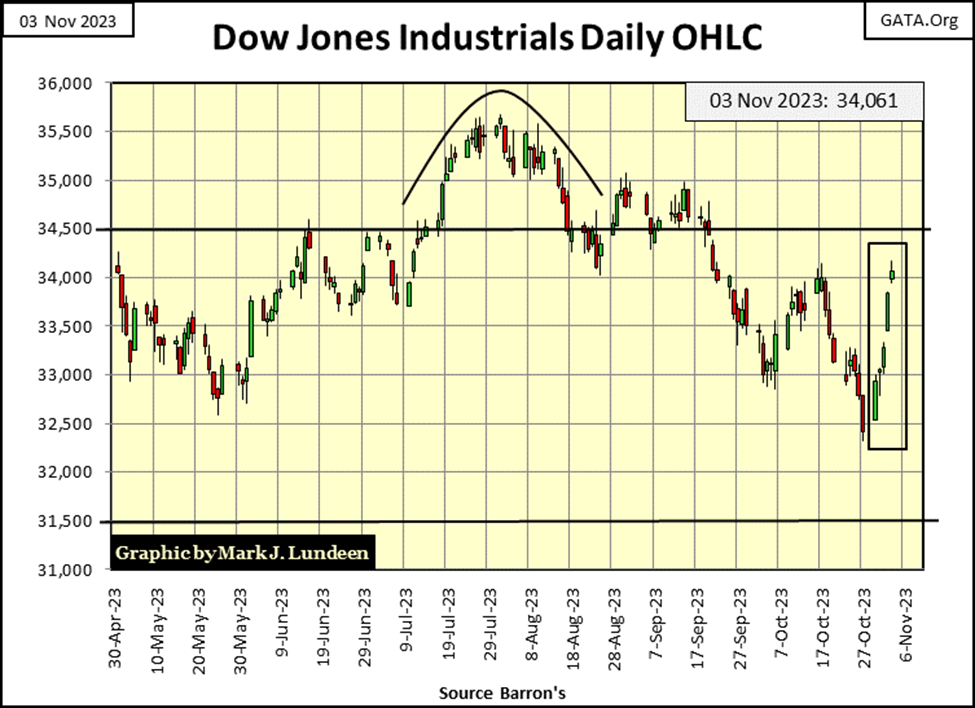
Looking at the Dow Jones in the daily bars below, I ask again; what about next week?
This week’s close at 34,061, wiped out all the losses of the past two weeks. We have to go back to late September to see the Dow Jones closing above 34,000, and all that this week, in only five trading days. That is the good news for the bulls. The bad news is with an advance such as we see below, Mr Bear will be eager to see how serious the bulls are, to advance the Dow Jones to higher levels. Can the bulls take it, as well as they dished it out?
Meaning I’m expecting a pullback, somewhere below 34,000 sometime next week, or the week after. Does this correction I’m anticipating to bottom around 33,500, before taking the Dow Jones to a new high of the move well above 34,000? That is what would happen in a bull market, for the bulls to begin buying on market weakness, as they did from the lows of last Friday.
Or do the gains we’ve seen this week only invite more selling, by those who want to lower the risk profile in their portfolio by selling into this week’s strength? That is what I’d expect to see if this is a bear market, for the Dow Jones to begin going down from the highs of this week, taking out all the gains of this week, and then some.
Moving on to my major market indexes BEV values below, every index below advanced this week, some by a lot. This data set’s average (#14), advanced by 3.48 BEV points from Monday to Friday’s close; that is big move for an average. The NASDAQ Banking index (#20) was up by 4.68 BEV points, the largest weekly advance of the indexes seen below. I wouldn’t put a dollar into the banks, but this week the bulls were big buyers of the banks.
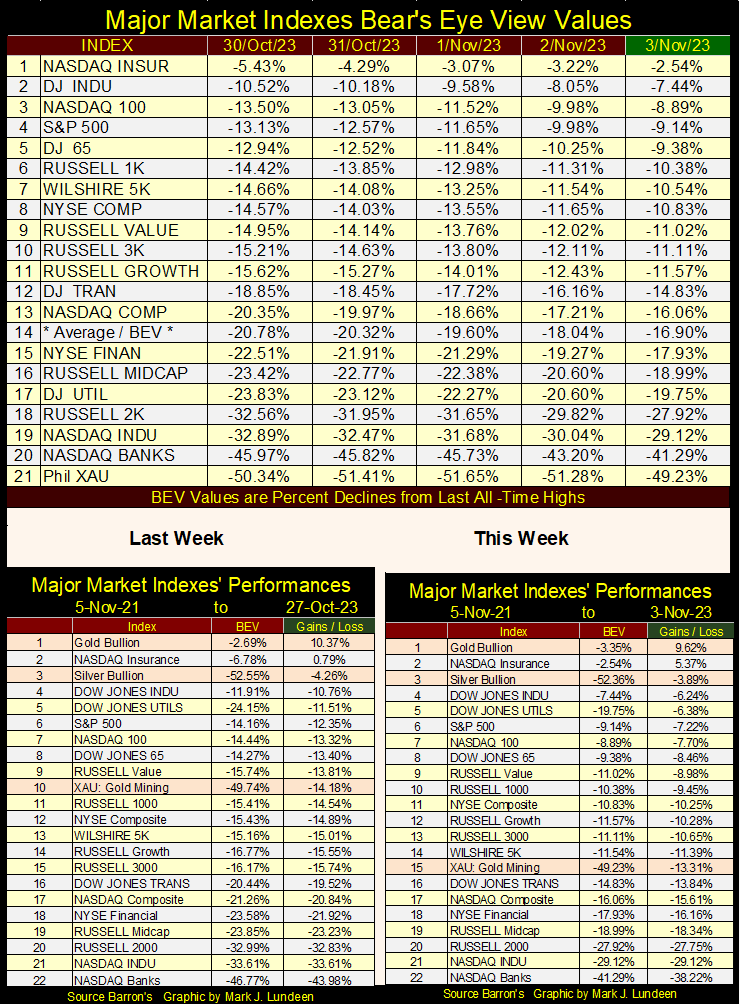
In the performance tables above, gold remains at the #1 spot, and silver at #3. The XAU fell back to #15, from last week’s #10. But the XAU was up for the week, just not as much as the other indexes that moved above it this week.
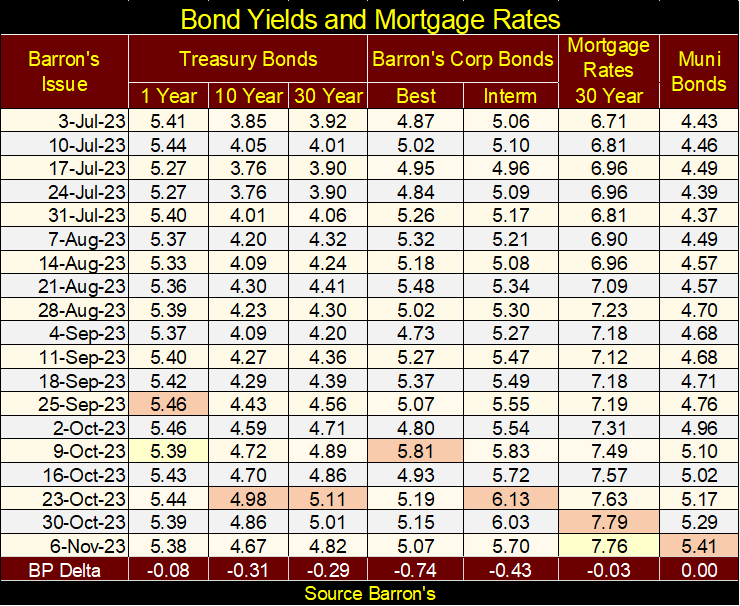
So, what got the stock market to move up as it did this week? Looking at the bond yields and mortgage rate table below, except for the muni bond, the other bond yields and mortgage rate have been declining for the past week or two. Stocks don’t like rising yields and interest rates, so I’m not surprised to see a big relief rally in the stock market after these yields have backed down a bit. And that is the key phrase to keep in mind; these bond yields have backed off by only a little bit from their recent highs.
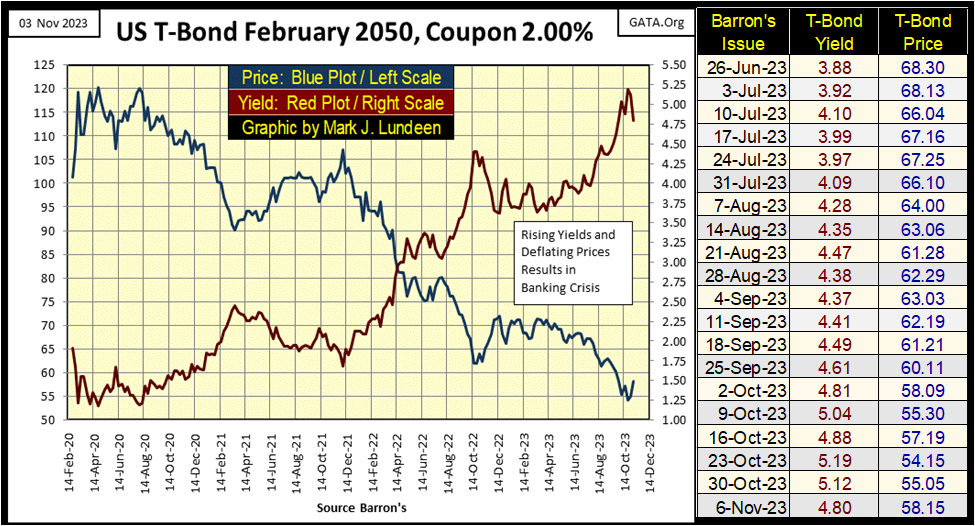
The question in my mind is; what are bond yields and the mortgage rate to do from here? For a larger perspective on this week’s trading, let’s look at my 30yr T-Bond below, issued in February 2020. Since last April, yields have been rising, and valuations deflating. So, it’s not surprising to have yields and rates backed off a bit this week, and we may see even deeper declines in yields before the New Year.
But for the longer term, the American debt market is for dummies, as their common denominator – the US dollar, is going extinct because of the criminal negligence of the people who issue it – the Federal Government, and those who control Washington’s bureaucracies.
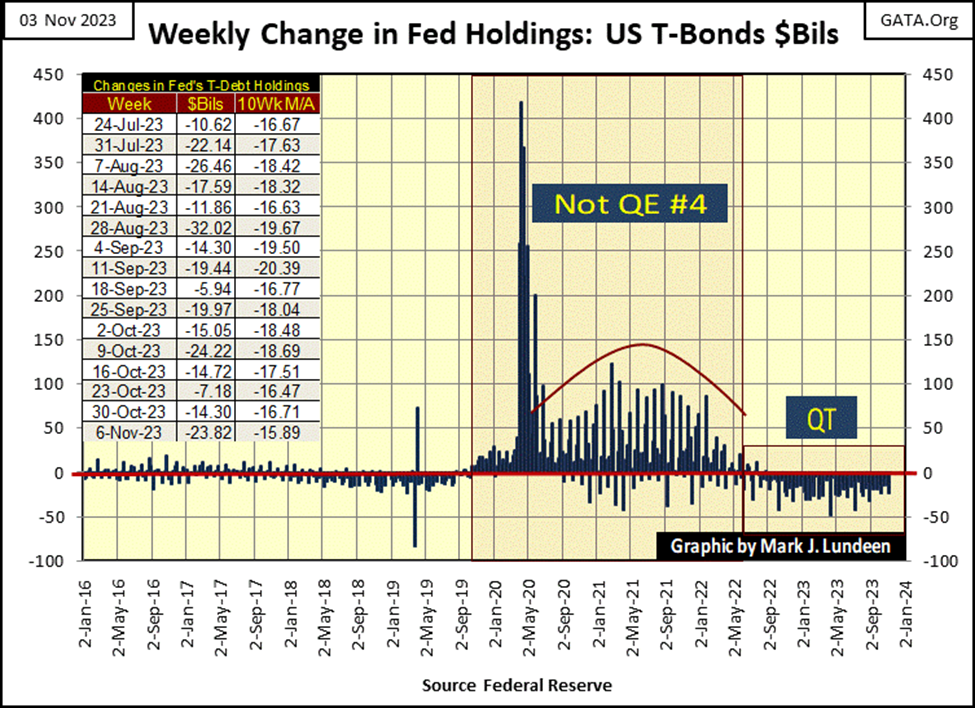
Here is what the idiots claim they did this week; they reduced their balance sheet by selling $23.82 billion of their Treasury debt into the bond market, as seen in the table below.
And it’s not just the idiots at the FOMC that are lightening their heavy load of T-debt. On a global basis, as seen in the table below, as of last July most countries have significantly reduced their holdings of US Treasury debt, as seen in the Percent From / Max Val column.
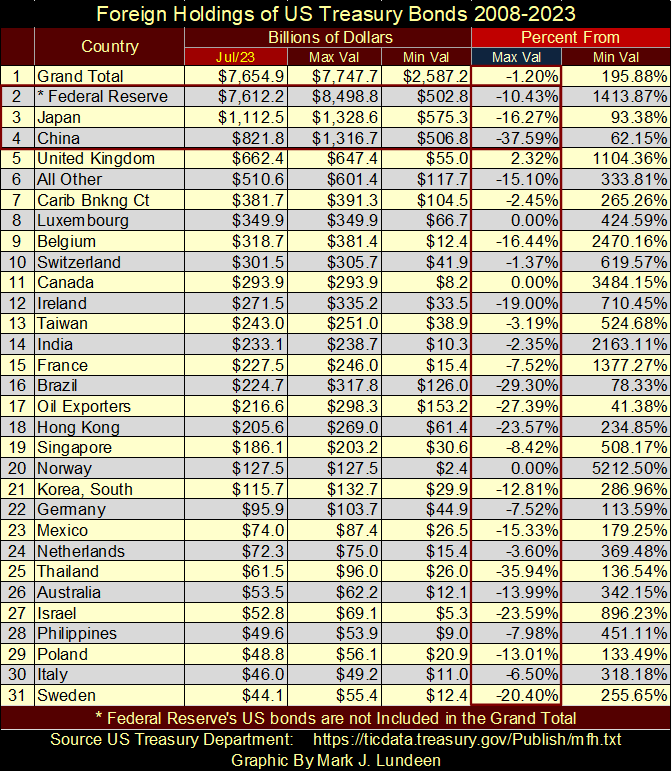
The FOMC and the majority of nations above are selling T-debt * PLUS * the US Treasury continues issuing new debt by the hundreds of billions of dollars. So, who is buying the T-debt, that all the above are selling in the Treasury market? Where is the buying coming from that caused T-bonds to recover, as they did this week?
Something is not right here; things are being done that are not spoken of, by government officials, or members of the financial media. But then in 2023, there are a lot of things happening that just aren’t right.
The “policymakers” want us to believe our (their) involvement in Ukraine, and now in the Gaza Strip is to defend some overriding international principle, or another high purpose, such as saving the planet. But all this takes money, and lots of it too. In Washington DC, anything worth doing, no matter how unproductive and pointless that “anything worth doing” may be, calls for spending a few hundreds of billions of dollars on.
I thought I’d revisit my comments on the US national debt I covered a few weeks ago, but this time with the addition of a new chart, that surprised me at first. But then I understood that to be something predictable.
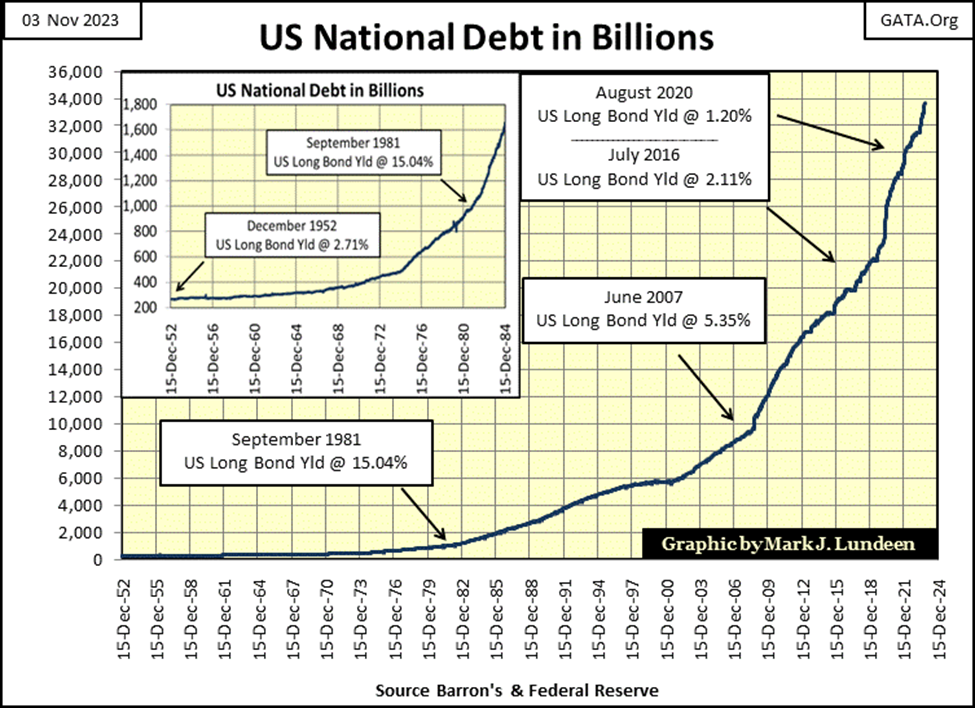
Here it is again, a chart plotting the US national debt going back to 1952 when the national debt was a then massive $267 billion dollars. A sum that is only 34.4% of what Washington intends to spend in the last three months of 2023, a fact that should not make any reasonable person happy.
That the current price of gold and silver is so low, considering the massive debts in dollars amassed below, tells us how effective our system of “higher education” has been in dumbing down generations of Americans attending colleges and universities. Thanks to our so-called educational system, and the mainstream media, people today really are clueless of the runaway freight train coming down the tracks – right at us.
Below is the new chart I just plotted; the percentage change in the growth in the national debt on a 52Wk basis. In other words, in percentage terms, how much larger, or smaller the national debt was from 52Wks before. This is spending by Washington’s politicians above, and beyond the tax receipts they receive from the Internal Revenue Service (IRS), and other sources of revenue available to the Federal Government.
From 1956 to 1983, this percentage of deficit spending by Washington only trended higher, peaking in the early years of the Reagan Administration, the same time the stock market began a bull market.
Washington’s deficit spending then trended down, until in the late years of the Clinton mis-administration, there was no growth in the national debt. I remember this period, and this was commented on by the financial media at the time. They attributed this lack of growth in the national debt to the immense flows of capital-gains taxes Washington received from the bull market on Wall Street.
That sounds about right, as beginning with the NASDAQ High-Tech Wreck (Bear Market of 2000 – 2002), once again the national debt and Washington’s deficit spending began growing.
I have two Red Circles (#1 & #2) in the chart, noting two deficit-spending spikes by Washington. Deficit-spending spike #1 occurred during the sub-prime mortgage debacle, and the FOMC’s QE#1, from September 2008, peaking in August 2009.
Deficit-spending spike #2 (January 2020 to February 2021) occurred during the March 2020 Flash Crash, as valuations for the Dow Jones and corporate bonds began melting down;
- From a new all-time high on February 12th, the Dow Jones deflated 37.09% on March 23rd. A 37% meltdown in blue-chip stocks * IN ONLY * 28 NYSE Trading Sessions. That has never happened before.
- Barron’s Best and Intermediate grade bond yields spiked from 1.88% to 4.01% for Best Grade, 3.06% to 5.37% for Intermediate Grade bonds, in only two weeks. FOMC idiot primate Powell soon announced the FOMC would begin monetizing corporate bonds to “stabilize” the bond market.
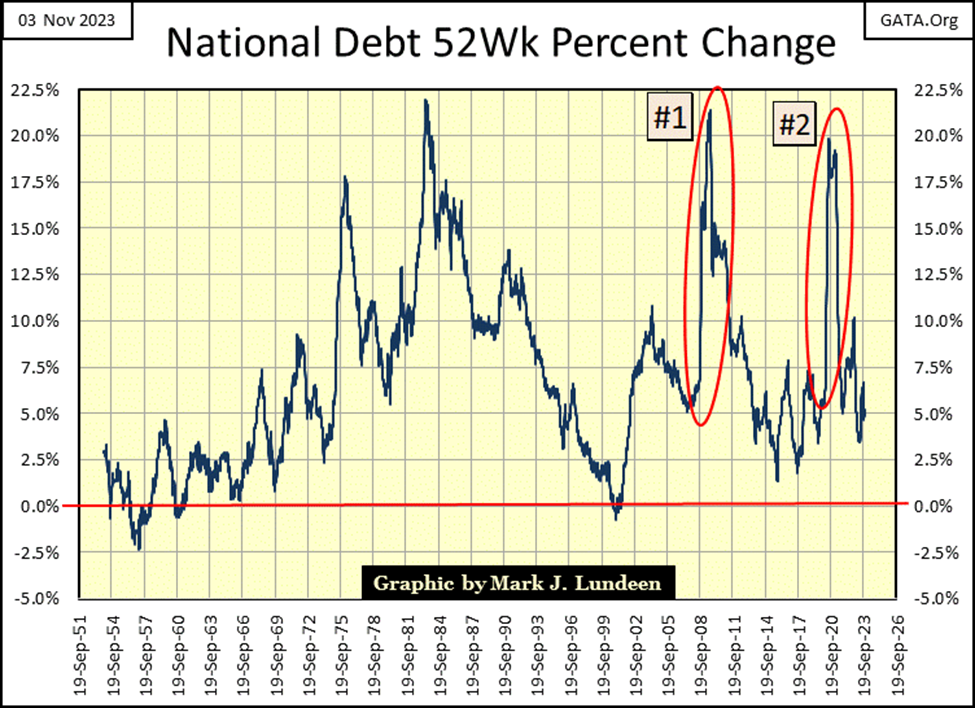
Note how deficit spending spike #1 occurred during Doctor Bernanke’s QE#1, the QE that placed a floor under the stock market collapse in March 2009. Deficit spending spike #2 occurred during Powell’s Not QE#4, which placed a floor under the March 2020 flash crash in stocks and corporate bonds.
So, what does all this mean? I don’t really know, except to verify the fact that the connections between Wall Street and Washington are closely intertwined, to a very unhealthy degree. To the point where Washington is willing to trash the creditworthiness of the US Treasury, should Wall Street require that from Washington’s politicians? How long before we see deficit-spending spike #3 in the chart above, and will America as we know it survives it?
So, what did gold do this week? To answer that, we now go to Gold’s BEV chart below.
Currently, not too many people are happy with the way gold is trading. Geeze Louise, it’s been over three years since gold has seen a new all-time high (BEV Zero) in the chart below, and gold isn’t in a hurry to make that happen again, or so that is how it feels.
But look at gold’s BEV chart below. Since it bottomed below its BEV -10% line in early October, look at how quickly it broke above its BEV -5% line. As far as advances go, gold for the past two months had done darn good for its ungrateful bulls, which I am one.
We’ve seen this before. Since August 2020, twice before gold almost hit its BEV Zero (0.0%) line, the new all-time high line in a BEV chart, only to turn around and go back down. Is gold now going to make this happen for a third time; coming close, but no cigar for the bulls? Until gold actually sees a new all-time high, I’m reserving my right to bitch, moan and groan about gold’s lousy market action.
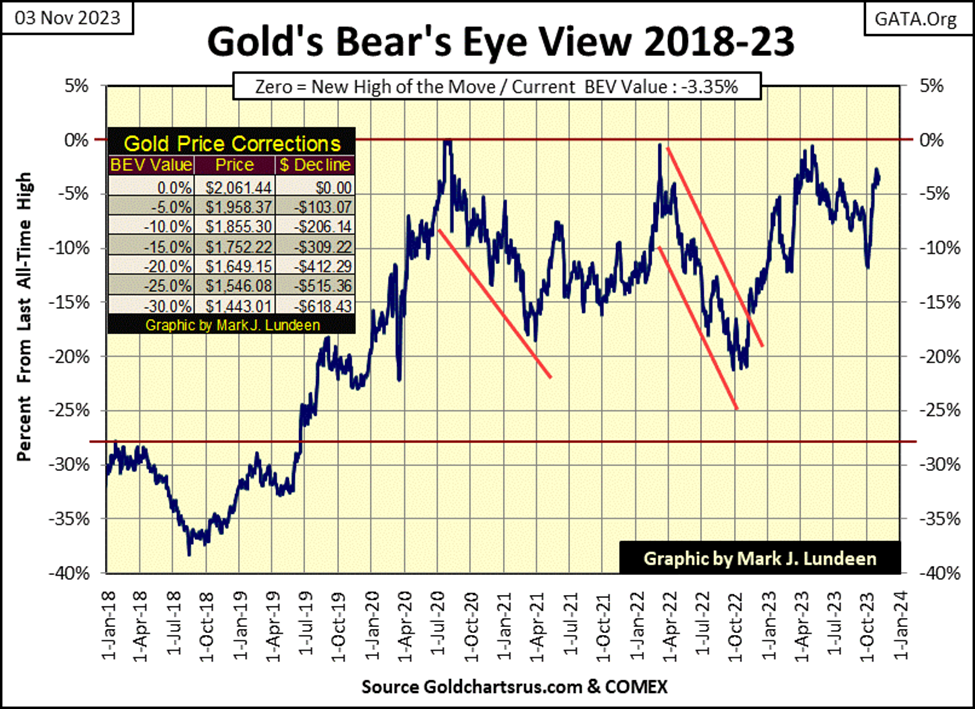
But deep down inside, I prefer to be optimistic. So, I’m expecting gold to make its first BEV Zero since August 2020, in the not-too-distant future, let’s say sometime in the next month. That gold has been closing in scoring position (daily BEV closes between -0.01% and -4.99%) every day since October 18th is worth noting.
As is noting gold closed this week only $69 from its last all-time high. One good day in the gold market would be all it would take for gold to once again close at a new all-time high. And with the world as it currently is, once gold begins making history to the upside, it may begin advancing to levels not believed possible to most people today.
In gold’s step sum table below, following October 19th, selling resumed in gold’s trenches at the COMEX. But even with this headwind, gold advanced from $1975 in mid-October, to today’s close at $1992. Not exactly a stellar performance for gold. But try as they might, the goons at the COMEX failed to force gold to go lower.
What gold, and silver really need is a BIG increase in daily volatility; days of extreme market volatility, which for gold are +/-3% daily moves from the previous days closing price, and +/-5% days for silver. For gold, so far in 2023, it has seen only two days of extreme volatility (chart below). Silver has seen only four 5% days so far in 2023.
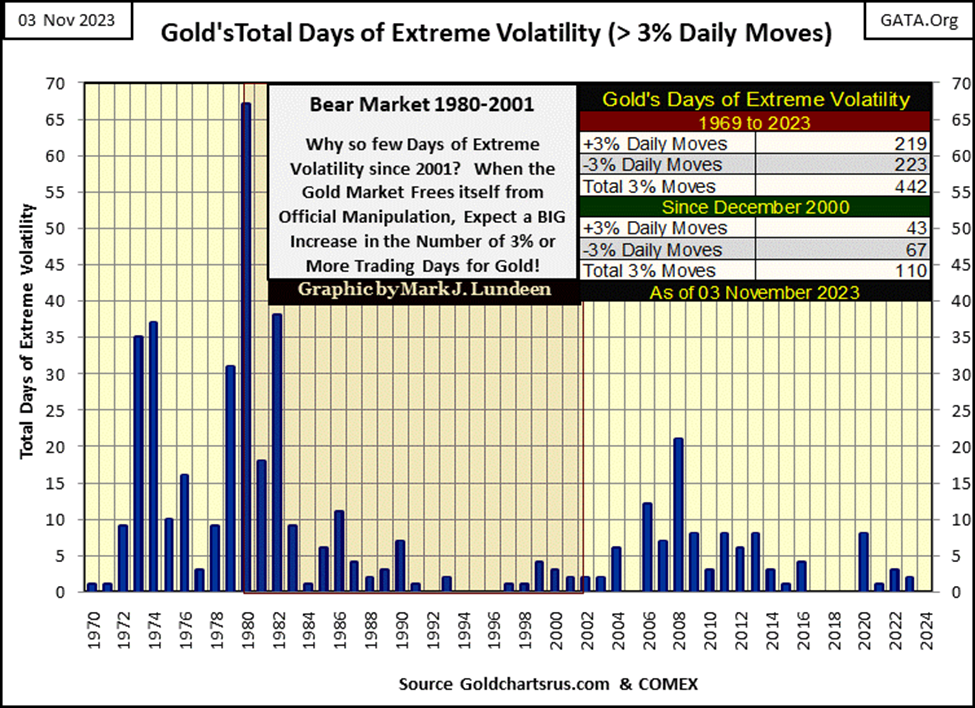
As seen in the chart above, when gold last made a new all-time high in 2020, gold in 2020 saw 8 days of extreme volatility; eight 3% days. Post 2020, such large daily swings in price for gold and silver have become rare-market events, is a problem for the bulls in the gold and silver markets.
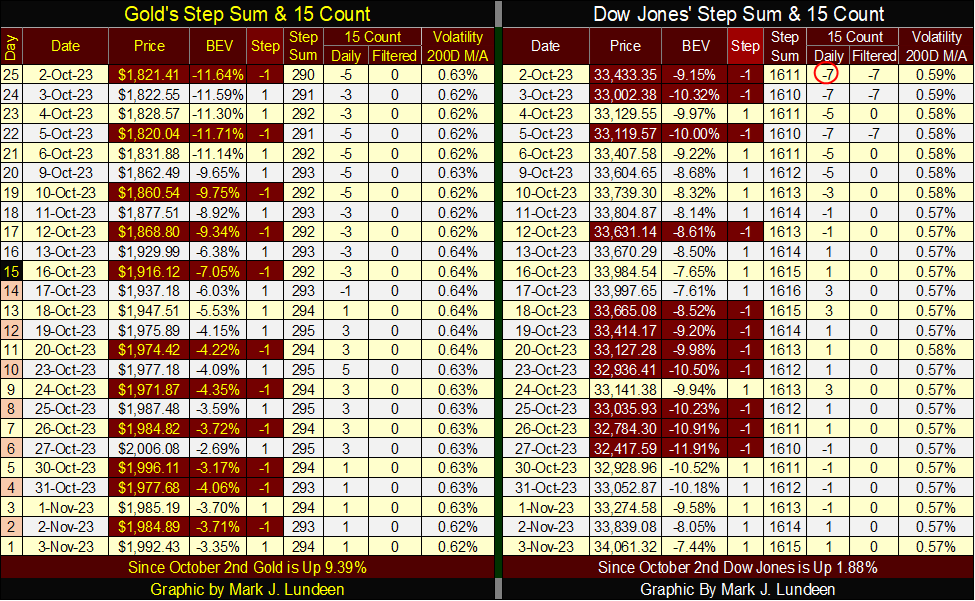
As for the step sum table for the Dow Jones above, what happened this week is on display. Following overwhelming selling in the Dow Jones in the two previous weeks, this week the bulls just began buying on this market weakness. That plus bond yields have come down a bit, something the stock market always likes to see.
So, do the bulls continue to take the market higher? Or, do the bears begin selling into the market strength seen above? I think the bulls have had their fun. I’m expecting the bears to dominate trading for the next two weeks.
But as my crystal ball keeps getting fogged up, peering into the future for the stock market has become impossible. So, like you, I’ll just have to wait to see what happens from here in the stock market.
__
(Featured image by 6499390 via Pixabay)
DISCLAIMER: This article was written by a third party contributor and does not reflect the opinion of Born2Invest, its management, staff or its associates. Please review our disclaimer for more information.
This article may include forward-looking statements. These forward-looking statements generally are identified by the words “believe,” “project,” “estimate,” “become,” “plan,” “will,” and similar expressions. These forward-looking statements involve known and unknown risks as well as uncertainties, including those discussed in the following cautionary statements and elsewhere in this article and on this site. Although the Company may believe that its expectations are based on reasonable assumptions, the actual results that the Company may achieve may differ materially from any forward-looking statements, which reflect the opinions of the management of the Company only as of the date hereof. Additionally, please make sure to read these important disclosures.


Ecobnb Turns Sustainable Tourism Into Measurable Impact
Ecobnb’s sustainable tourism platform generated significant environmental and social impact in 2025, avoiding 58,207 kg of CO₂ and adding 583...


Sugar Markets Balance Biofuel Demand and Global Supply
Sugar markets in New York and London were mostly unchanged as the Iran conflict renewed interest in biofuels. Drought concerns...


The $40 Trillion Trap: Disinflation Is Not Deliverance
U.S. debt has reached $40 trillion, with $24 billion weekly interest, while deficits accelerate. Despite disinflation in CPI, from cooling...


FinTech Matures as AI and Infrastructure Drive the Next Growth Phase
Fintech markets are entering a mature phase, shifting from rapid growth to consolidation, specialization, and sustainable business models. Zurich and...


Bitcoin, and Ethereum Rise, While Cardano Enters Transition
Bitcoin and Ethereum posted modest weekend gains, supported by ETF inflows. A new proposal may protect Bitcoin from quantum threats....
 |
|
 |  |
 |
|
-

 Crowdfunding2 weeks ago
Lemonaid Offers Shares to Consumers for the First Time
-

 Crypto5 days ago
Bitcoin’s Price Drops as Investors Turn to Layer 2 Solutions
-

 Crowdfunding2 weeks ago
East Crema Coffee Launches €3.5M Crowdfunding Campaign
-
 Markets8 hours ago
Sugar Markets Balance Biofuel Demand and Global Supply