Markets
Stock Markets Broke Support this Week as Geopolitical Events Dominated the News
Market crashes are not as unusual or rare as many would like to think. When we think of crashes the ones that quickly come to mind are 1929, 1987, 2008 and 2020. But there have been many others that just play out in a less dramatic fashion. Surprisingly the setup to a market crash is fairly similar. They often follow speculation and economic bubbles.

The Thucydides Trap has great application to the large power struggles going on today. In ancient times, it was the struggle for power between Athens and Sparta. Today, it is the power struggle between the U.S. and China. In ancient times it was the rising power, Athens, challenging the supremacy of the reigning power, Sparta. Today, China is the rising power and the U.S. the reigning power. While it can be argued that war is not destined between the powers, history has frequently shown that the stresses make war inevitable.
So, what has this got to do with technical analysis? In technical analysis there is a term known as a bull trap. There is also a bear trap. Bulls vs. the bears, and each one leading each other into a trap. A bull trap usually occurs when a stock or an index breaks above resistance, only to reverse (whipsaw?) and head right back down, taking out a previous low. A bear trap is the opposite. However, what we typically see is not a breakout but a rebound following a breakdown, only to have that rebound fail, then turn and take out the previous low. It traps the bulls (or bears, if it is the opposite pattern) and markets move lower. It is not unusual to see the bull trap turn into a crash.
Below, we offer some examples mostly of our second description of a bull trap. In almost all the cases we present, they also led to a crash.
Dow Jones Industrials (DJI) 1929
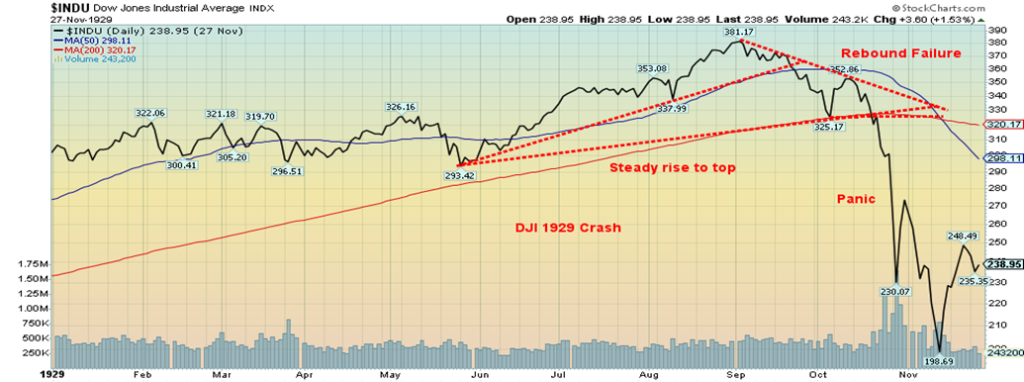
Our first example is the 1929 crash. In this case, following a steady rise from May 1929 to the top in September 1929, the DJI suffered a pullback that took out the uptrend line and previous lows. The DJI dropped 14.6%, the first-time finding support at the 200-day MA. The rebound rally failed to regain the 50-day MA, and when it broke the 200-day MA and the early October low, a panic set in. Ultimately, the DJI was down 50% from the high in a matter of weeks. The crash was a two-day affair October 28 and 29 as the DJI lost 25% over the two days.
Dow Jones Industrials (DJI) 1936–1937
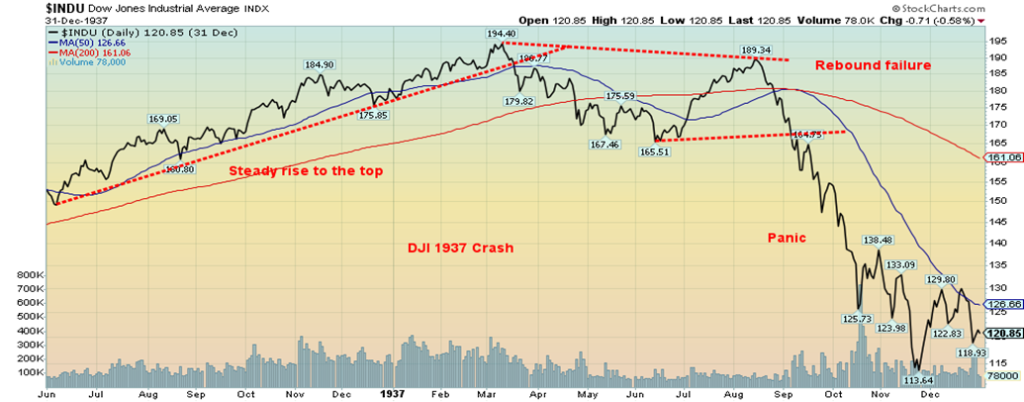
The 1937 crash had a similar look to the 1929 crash. The latter part of 1936 and early 1937 saw the DJI rise steadily to a top in March 1937. This was followed by a zig-zag pattern that actually took out the 200-day MA losing about 15%. The rebound rally not only regained the 200-day MA but also the 50-day MA, gaining an impressive 14.5%. But it failed, and when the market cracked and took out the June 1937 low, a panic set in. By the time the DJI bottomed in November 1937, the DJI had fallen about 42% from the high.
Dow Jones Industrials (DJI) 1971–1974
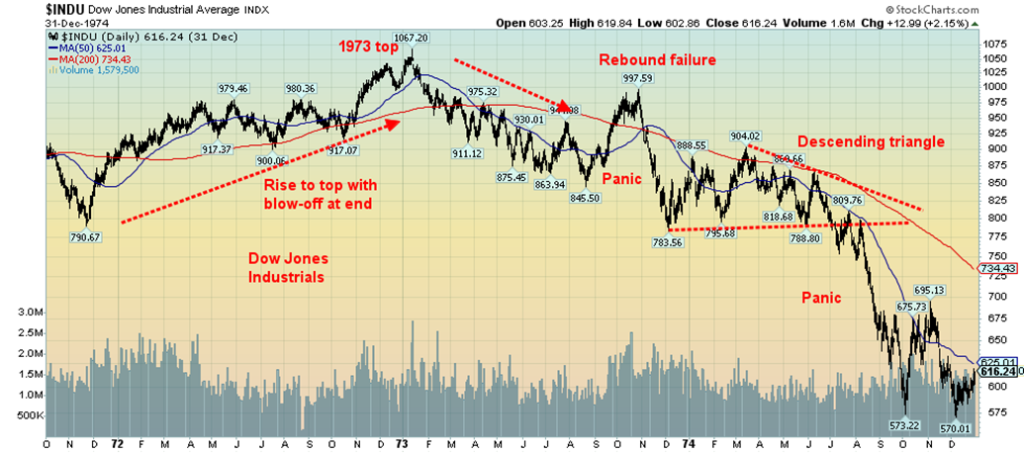
The 1973–1974 bear market played out slightly differently. From a low in 1971 the DJI jumped initially, then went through a period of consolidation that resembled a rising triangle. Then, in the latter part of 1972, it went into a blow-off move that became known as the “Nifty Fifty” rally. We topped in early January 1973, then began a choppy decline as the Watergate scandal began to emerge. Note how the low was November 1972 with the election of President Richard Nixon for a second term. A rally began in August 1973 that quickly took out the downtrend. Many thought things were returning to normal. Not so fast. October 1973 brought us the Yom Kippur War, the Saturday Night Massacre (Watergate), and the Arab oil embargo. The market panicked and in no time, we were making new lows. The market fell 21% in the first wave down.
Following a period of consolidation, the second panic set in and didn’t end, even when Richard Nixon resigned in August 1974. The final low came in December as a steep recession had unfolded. When the dust cleared, the DJI had fallen 45% from the January 1973 top. Other indices fell even further. Because of the Arab oil embargo oil exploded to the upside and gold also soared to new highs as the U.S. dollar fell.
Dow Jones Industrials (DJI) 1987
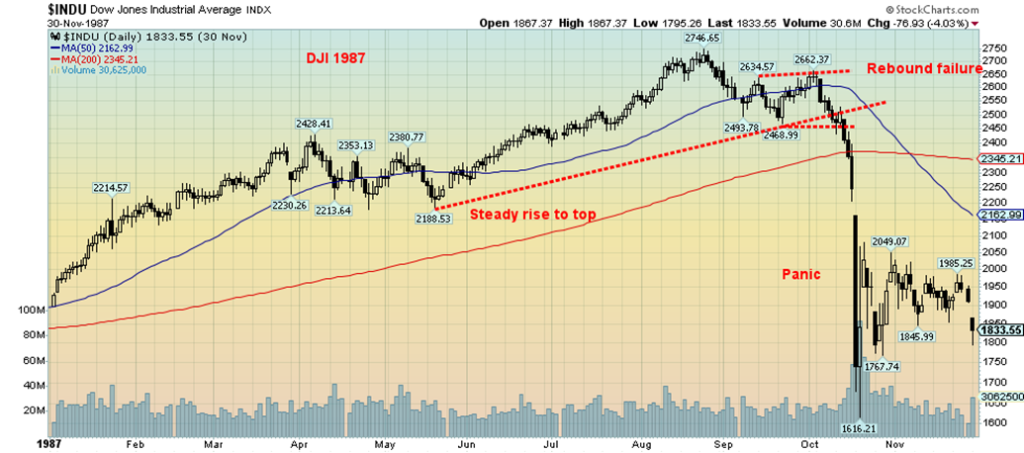
Yes, things do seem to repeat themselves. This is the 1987 stock market. Once again, the DJI made a steady rise from May 1987 to a top in August 1987. Then came the first drop that took out some previous lows. The DJI took out the 50-day MA but didn’t come close to the 200-day MA. The first drop from August into September saw the DJI lose just over 10%. The rebound rally to us back to just above the 50-day MA with a gain of just under 8%. It was during this period that many loaded up once again, figuring the DJI was headed to new highs. It was not to be. The DJI broke the September low, then almost immediately went into panic mode, resulting in the worst one-day crash in stock market history. October 19, 1987 saw the DJI fall 22.6% that is still a record. It was all over very quickly and the DJI that bottomed on October 20 losing 41% from the August top. Everyone thought the next great recession or even depression was upon us. In the end we didn’t even have a recession. The recession didn’t come until 1990.
NASDAQ 1999–2000
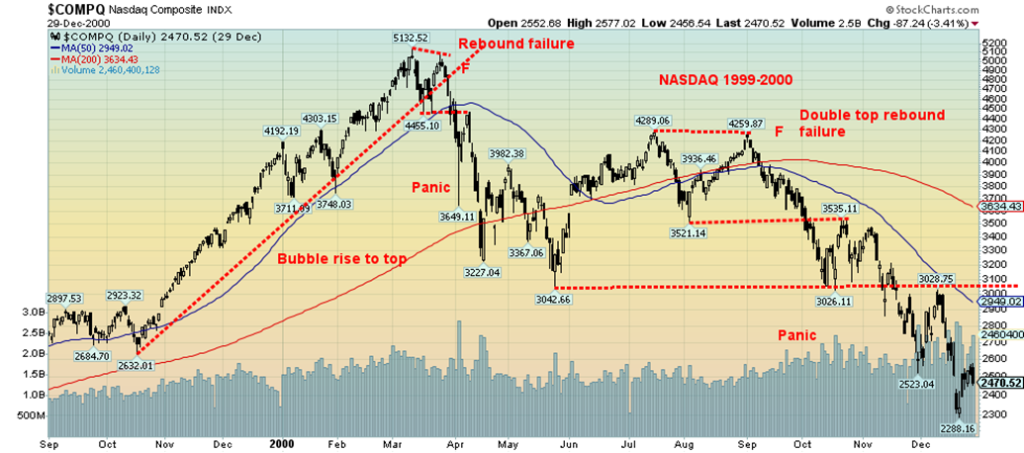
The NASDAQ didn’t just have a steady rise to the top in March 2000—it was a highly speculative bubble rise. Warning. There has never been a bubble that didn’t burst. The NASDAQ broke out what was (not shown) an ascending triangle and took off, gaining 95% from October 1999 to March 2000. The rise of the NASDAQ, which never made much sense from a fundamental standpoint, was, nonetheless, the talk of the airwaves throughout this period. Then came the reality check. In March 2000 the NASDAQ initially fell some 13% in a hurry, only to regain back almost to the previous high. That rebound failed, and when the NASDAQ took out the previous low, it fell swiftly to a low in May, losing 40.7% from March to May. A mini-crash?
We extended this one because it wasn’t over. The NASDAQ recovered into the summer, and in early September 2000 it made what proved to be a double top, just above the 50-day MA. It was still a long way from the March 2000 high. When the NASDAQ dropped below the August low, a mini-panic set in and the NASDAQ fell again, quickly losing 46.7% from that July 2000 top to the December 2000 low. That wasn’t the end of it and, following another rebound, the NASDAQ eventually lost over 78% before making its final low in October 2002. It was the most stunning bear market since the Great Depression crash of 1929–1932. The Great Depression crash lost 89% for the DJI.
Gold 2012–2013
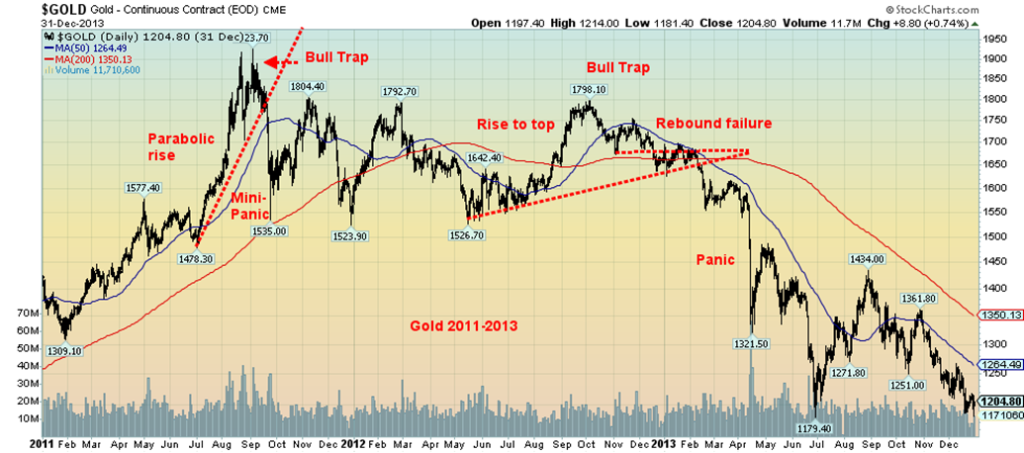
The gold crash of 2013 was one that caught the gold bugs completely by surprise. Gold topped in September 2011. Gold rose from a low of $681 in October 2008 to a high of $1,923 in September 2011, a gain of 182%. Gold rose because of the 2008 financial crash followed by the central banks of the world flooding the financial system with liquidity (quantitative easing or QE) and lowering interest rates to near zero. Perfect conditions for gold. It was a parabolic rise with the largest gain taking place from January 2011 as gold gained about 47% in the final run-up. It was a spectacular bull market. Even a bubble. Gold stocks as measured by the Gold Bugs Index (HUI) gained 326% during this period.
It came to an abrupt end in September 2011 when gold collapsed. Gold topped in August 2011 at $1,918, then pulled back, off just over 8%. Then gold rose again, making new highs in September at $1,923. It failed in classic bull trap fashion and fell sharply in the same month, losing just over 20% in a hurry. For the next year gold traded in a range between roughly $1,525 and $1,800. In August 2012 gold began a quick rise towards $1,800, gaining about 17% into October. Many believed gold was breaking out, even though silver was languishing and not breaking out nowhere near its previous high. It was a divergence that proved prophetic, turning into another bull trap. Gold started falling, with a few feeble rebounds giving rise to rebound failures. Then gold broke its uptrend in February. It tried to hold on, but the crash came on April 12–15 when gold fell an incredible $200+ in a mere two days.
Gold’s ultimate bottom came two years later in December 2015 at $1,045, a landmark low and price that has never been seen again. Altogether, gold fell about 46%, which didn’t seem like much; however, the gold stocks were decimated and still haven’t recovered. Silver also fell sharply, losing 72% from its 2011 high. Silver too has never recovered that level. The Gold Bugs Index (HUI) fell 84% and remains down 64% from its 2011 high. Only gold has gone on so far to make new all-time highs.
Bitcoin 2020–2022
We had to get Bitcoin in here because it has experienced rebound failures, bull traps, breakdowns, and panics.
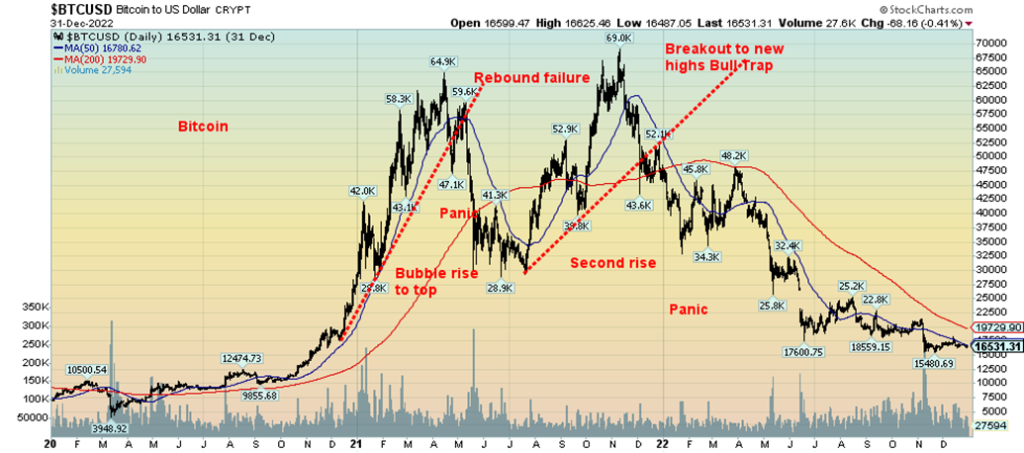
Starting innocently in March 2020 at the bottom of the pandemic, Bitcoin went on a parabolic rise from October 2020 to a top in April 2021—an incredible rise of well in excess of 1,500%. They’ll be writing about this one in a reboot of Extraordinary Popular Delusions and the Madness of Crowds, originally written in 1841 by Charles Mackay. From tulip mania to Bitcoin mania.
Bitcoin topped out near $64,900 in April 2021, then fell roughly 27%. Bitcoin tried to rebound but the rally failed, and then the panic was underway. When the dust cleared, Bitcoin had fallen 55% into a low in June 2021. No, Bitcoin wasn’t finished. It began another rise, this time leaping about 140% into a high in November 2021 and taking out the April 2021 high. A classic bull trap. Then the second panic set in, and by the time the dust cleared, Bitcoin had fallen 77.5% into a final low in November 2022. What goes up fast comes down even faster.
We also had the infamous meme stocks mania, led by GameStop (GME). GameStop rose a mind-boggling 18,000% plus from April 2020 to a peak in January 2021. It then fell promptly 92% a month later, and then rebounded 800%. It has since been a long downward drift and today sits 88% below that January 2021 high. Another candidate for Charles Mackay’s book. The book might want to add also the non-fungible tokens (NFTs) mania that occurred around the same time. NFTs are digital assets like a piece of art. The owner holds them in a blockchain. The trading of NFTs peaked in 2021 at around $17 billion up from $82 million a year earlier. Then in 2022 the market collapsed and an estimated 95% of all NFTs are now worthless. NFTs were a bubble and some even called them a Ponzi scheme.
S&P 500 2006–2009
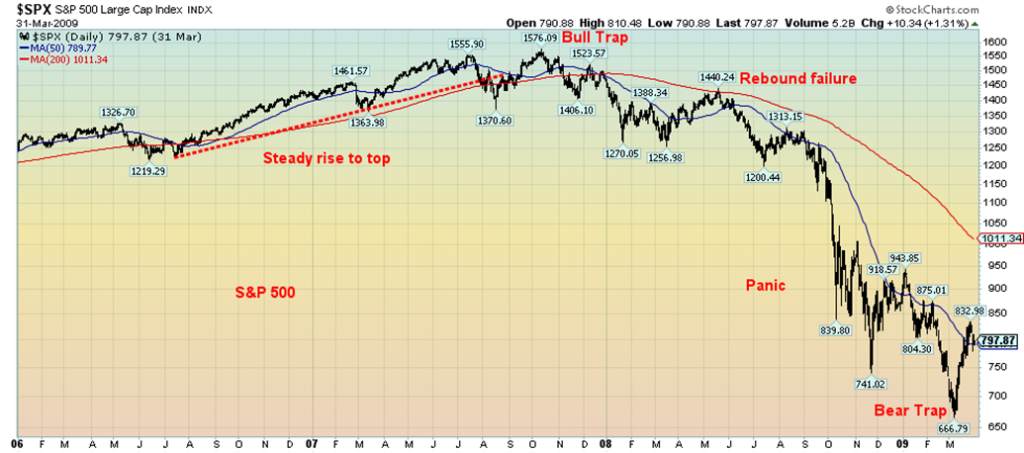
Somehow this wouldn’t be complete without the financial crisis collapse of 2008. We represent it here with the S&P 500. The dot.com/high-tech crash bottomed in October 2002. It was then the start of a five-year bull market that was often being hailed as the start of a new great bull market. It eventually proved to be a bull trap, albeit one that stretched out over five years. The final rise got underway in 2006, which was a classic steady rise to a top in July 2007. Then came the Bear Stearns funds collapse and the first real sign of trouble for the coming sub-prime loan collapse. The S&P 500 fell initially only about 12%, then recovered. By October 2007 the S&P 500 was making small new highs above July 2007. It was also only a small new high above the high seen in 2000.
In classic divergence fashion, the DJI was well above its 2000 high but the NASDAQ was nowhere near its 2000 high. Still, all was hailed as well; however, the jump to a small new high proved to be a classic bull trap. More than a few years passed before that high was seen again. Following a sell-off into March 2008 where the SPX lost just over 20%, the market rebounded into May. Many believed at the time that the worst was over. Instead, it was only the beginning.
The panic set in with the collapse of Lehman Brothers in September 2008 followed by the near collapse of American International Group (AIG) because of credit default swaps underwritten by its financial arm. It all sparked the greatest bailout in history, although matched or surpassed by the COVID pandemic in 2020. Quantitative easing (QE) and interest rates to zero and in some places below zero.
When the dust cleared, SPX had fallen 53% into a November 2008 low. A rebound followed, then another decline into March 2009. Only this time it was bear trap as the drop was not confirmed by a number of indices. By March 2009 the SPX was down over 57% from its October 2007 high.
A steady rise to the top. Sometimes a parabolic rise to the top. The top followed by a pullback. Then a rebound rally that fails to take out the previous high. Or, in some cases, we make small new highs. Either way, it is still a bull trap, followed by a drop that takes out the previous low and, in some cases, results in panic decline. Sometimes it is a bit more complicated than that, but that is generally the pattern. The pattern was also seen before the COVID crash of March 2020. But we have here excellent examples of the 1929 crash, the 1937 crash, the 1987 crash, the dot.com NASDAQ crash, the gold crash, and the Bitcoin crash. There are other examples, even if the drops weren’t quite as dramatic as those were.
So, what about today?
S&P 500 2022–present
We are loath to say the more things change, the more things remain the same. Different time, different market, but all the same similar patterns emerge, even if the time frame is different. Instead of one war we now have two. Both are global threats, even as they are also different in terms of their threat. We have the return of inflation, not dissimilar to the inflation of the 1970s. Much of the Western world is slowly falling into recession, but the largest economy, the U.S., so far shows no signs or at least few signs of a coming recession. The sell-off in 2022 saw the indices drop into a bear market. The S&P 500 fell 27.5% from the top in January 2022 to the low in October 2022. The Russia/Ukraine war broke out in February 2022 and the central banks of the world started hiking interest rates to bring down inflation in March 2022.
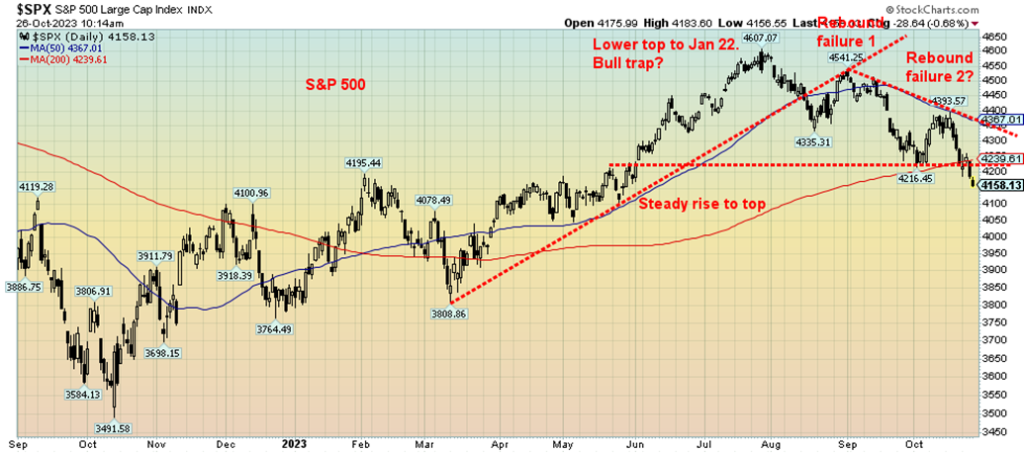
A rally started out of the low of October 2022. It was choppy and the first peak was seen in February 2023, followed by a 9% pullback into March 2023. Many thought we were re-entering the bear market. A bear trap? Then came the steady rise to the peak in August 2023 as the S&P 500 rose almost 21%. Happy days are here again? Many believed we were headed to fresh all time-highs. The level of bullishness rose sharply.
Instead, we may have seen once again formed a classic bull trap. No, we didn’t make new all-time highs, but expectations were high that we would. There was little to no impact on employment and monthly nonfarm payrolls sometimes beat expectations. Inflation was showing signs of retreating, thanks to interest rate hikes. A sell-off started, then we rebounded. Once again, expectations were that we were headed to new highs. But the rebound failed and we fell to new lows. Then another rebound got underway, and just as it appeared it might have legs, it too failed. Then, literally on the anniversary of the 1973 Yom Kippur War, the war between Israel and Hamas broke out.
Now we are breaking down once again and have fallen to new lows. Is a panic next?
While the patterns leading to a potential crash are different, they are also quite similar. A steady rise to a top or sometimes a parabolic rise to a top. A top followed by a drop, then an attempt to return to the top. Sometimes it does make new highs (classic bull trap), but more often it makes a lower top and then starts a decline once again. Sometimes the panic sets in right away and other times it falls, comes back, and then it repeats and we fall to new lows. Often then the panic sets in as the news turns negative and the bulls realize they are trapped.
So, what has all this have to do with the Thucydides Trap? Think of the bull market as the dominant power. They expect to defeat the upstart challenger—in this case, the emerging bear market. Inevitably, as with the Thucydides Trap, they underestimate the power of their challenger. And that is when the panic sets in and the challenger overwhelms the one in power or, in this case, the bear overwhelms the bull.
No, we don’t know whether we’ll see a crash. But the setup and patterns bear similarities. And the background is not friendly for the bulls, despite some decent economic numbers. Caveat emptor.
Chart of the Week
Jamie Dimon, CEO of JP Morgan Chase (JPM) is selling stock. It is a very un-Buffett like move for Dimon. No, he is not selling immediately. Instead, he’ll do it in 2024. The market appears to be prepping for him. Dimon holds roughly 8.6 million shares of JPM and plans on selling one-million of them for financial diversification and tax-planning. He might have been better off doing it then telling everyone. When the boss is selling his stock is there any reason that anyone else should continue to stay in the stock? Dimon had never sold any of his stock before. Stating that the “company’s prospects remain very strong…” is not very reassuring when you’re dumping your own company.
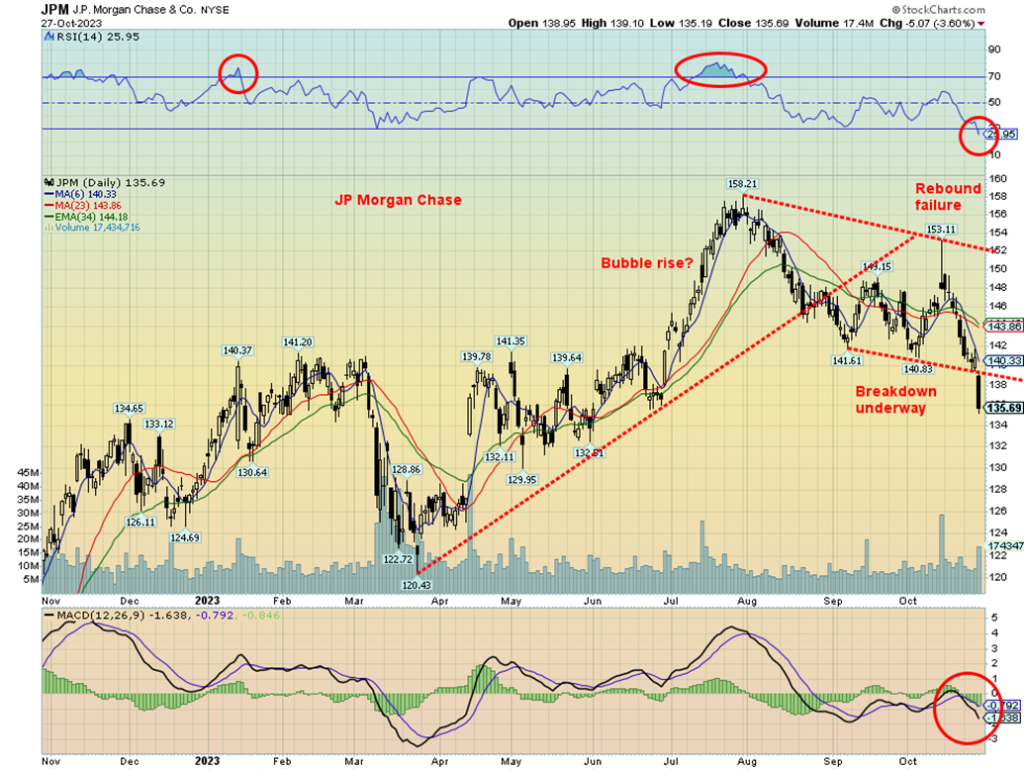
Nonetheless this announcement caught the attention of the market. JPM plunged and is now down 14% from the July 2023 top. Breaking down as it did on Friday October 27 is not very comforting for holders of JPM. Could a bigger plunge be in store?
JPM came out of the depths of the 2022 bear market rising steadily into June 2023. The final thrust from June 2023 to the July 2023 top saw JPM gain 17% very quickly. Almost in bubble-like fashion. Then the decline came. And in classic bull-trap fashion JPM rebounded only to fail. Now the breakdown is underway. A decline to at least $125 appears to be a fairly safe bet.
We shouldn’t feel too bad for Jamie as he still holds over 500,000 shares unvested and rights to another 1.5 million shares. Maybe Jamie took his prognostications seriously. He felt interest rates would rise further to 7%. He believed new Basel III capital rules would make bank stocks almost uninvestible.
JPM has been one of the best performing bank stocks. Maybe not any longer. If the boss is selling, is there any reason to hold it?
Short-term we are becoming oversold so a rebound bounce may develop at any time.
Markets & Trends
| % Gains (Losses) Trends | ||||||||
| Close Dec 31/22 | Close Oct 27, 2023 | Week | YTD | Daily (Short Term) | Weekly (Intermediate) | Monthly (Long Term) | ||
| Stock Market Indices | ||||||||
| S&P 500 | 3,839.50 | 4,117.37 | (2.5)% | 7.2% | down | down (weak) | up (weak) | |
| Dow Jones Industrials | 33,147.25 | 32,417.59 | (2.1)% | (2.2)% | down | down | neutral | |
| Dow Jones Transport | 13,391.91 | 13,556.07 | (6.2)% | 1.2% | down | down | neutral | |
| NASDAQ | 10,466.48 | 12,643.01 | (2.6)% | 20.8% | down | neutral | neutral | |
| S&P/TSX Composite | 19,384.92 | 18,737.39 | (2.0)% | (3.3)% | down | down | neutral | |
| S&P/TSX Venture (CDNX) | 570.27 | 520.51 | flat | (8.7)% | down | down | down | |
| S&P 600 (small) | 1,157.53 | 1,068.80 | (2.3)% | (7.7)% | down | down | down | |
| MSCI World | 1,977.74 | 1,957.90 | (2.0)% | (1.0)% | down | down | down | |
| Bitcoin | 16,531.31 | 33,831.09 | 14.4% | 104.7% | up | up | neutral | |
| Gold Mining Stock Indices | ||||||||
| Gold Bugs Index (HUI) | 229.75 | 225.87 | (1.2)% | (1.7)% | up (weak) | down | down | |
| TSX Gold Index (TGD) | 277.68 | 280.45 | (0.3)% | 1.0% | up | down (weak) | down | |
| % | ||||||||
| U.S. 10-Year Treasury Bond yield | 3.88% | 4.83% | (1.6)% | 24.5% | ||||
| Cdn. 10-Year Bond CGB yield | 3.29% | 3.98% | (2.5)% | 21.0% | ||||
| Recession Watch Spreads | ||||||||
| U.S. 2-year 10-year Treasury spread | (0.55)% | (0.17)% | (6.3)% | (69.1)% | ||||
| Cdn 2-year 10-year CGB spread | (0.76)% | (0.61)% | 12.9% | (19.7)% | ||||
| Currencies | ||||||||
| US$ Index | 103.27 | 106.58 | 0.4% | 3.2% | up | up | up | |
| Canadian $ | 73.92 | 72.10 | (1.3)% | (2.5)% | down | down | down | |
| Euro | 107.04 | 105.68 | (0.2)% | (1.3)% | down (weak) | down | down | |
| Swiss Franc | 108.15 | 110.94 | (1.0)% | 2.6% | neutral | neutral | up | |
| British Pound | 120.96 | 121.23 | (0.3)% | 0.2% | down | down | neutral | |
| Japanese Yen | 76.27 | 66.84 | 0.2% | (12.4)% | down | down | down | |
| Precious Metals | ||||||||
| Gold | 1,826.20 | 1,998.50 | 0.2% | 9.4% | up | up | up | |
| Silver | 24.04 | 22.89 | (2.6)% | (4.8)% | neutral | down (weak) | neutral | |
| Platinum | 1,082.90 | 905.80 | 0.1% | (16.4)% | neutral | down | down | |
| Base Metals | ||||||||
| Palladium | 1,798.00 | 1,130.20 | 1.7% | (37.1)% | down | down | down | |
| Copper | 3.81 | 3.65 | 2.5% | (4.2)% | down (weak) | down | neutral | |
| Energy | ||||||||
| WTI Oil | 80.26 | 85.54 | (2.9)% | 6.6% | down | up | up | |
| Nat Gas | 4.48 | 3.48 | 20.0% | (22.3)% | up | up | down (weak) | |
New highs/lows refer to new 52-week highs/lows and, in some cases, all-time highs.
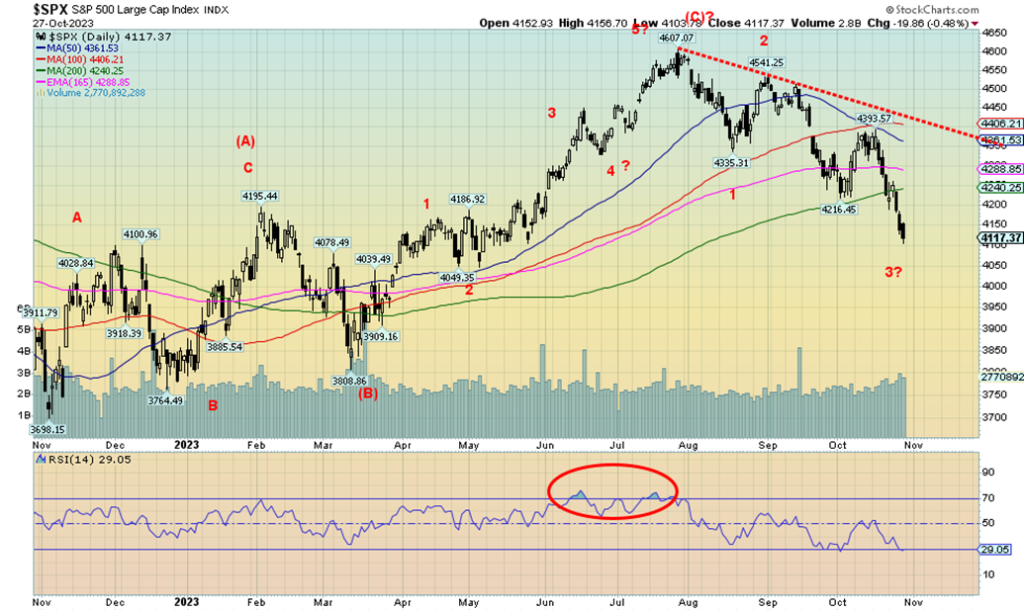
Have we entered the next phase of the bear market? The S&P 500 is now down 10.6% from the July top and we have broken below the 200-day MA. Once we took out 4,200 the market has accelerated to the downside, setting up a potential washout when we open on Monday morning. With an RSI now down to 29, we are into oversold territory, but a reminder oversold is just a state and not an indication that we have made a bottom. We are, we believe, in the throes of our third wave to the downside. The drop is being led by fears of recession, despite the strong GDP numbers this past week and the spreading war in the Middle East where a ground invasion is under way and all communications, aid, and more have been cut off into the Gaza strip.
On the week, the S&P 500 (SPX) lost 2.5%, the Dow Jones Industrials (DJI) fell 2.1% and is now down 2.2% in 2023, the Dow Jones Transportations (DJT) was beaten down, off 6.2%, while the NASDAQ was saved by Amazon but still fell 2.6%. The S&P 400 (MID) fell 2.8% and is down 4.3% on the year and the S&P 600 (Small) dropped 2.3% and is down 7.7% on the year. SPX clings to a 7.2% gain on the year. Gold is now outperforming, up 9.4% in 2023. Got gold? Or maybe Bitcoin, as Bitcoin was up 14.4%, hitting $35,000 thanks to all the noise over the ETF and SEC interest. But Bitcoin a safe haven? Buy the rumour, sell the news? Short covering is also driving Bitcoin higher and not all cryptos are participating.
In Canada, the TSX Composite fell 2.0% while the TSX Venture Exchange (CDNX) was flat. In the EU, the London FTSE fell 1.5%, the EuroNext was down 0.3%, the Paris CAC 40 was off 0.3%, and the German DAX fell 0.8%. In Asia, China’s Shanghai Index (SSEC) was up 1.2% as was Hong Kong’s Hang Seng Index (HSI), up 1.3%. But Tokyo’s Nikkei Dow fell 2.1%. The World MSCI Index fell about 2.0%. Little joy anywhere.
The drop through SPX 4,200 was a point we’d mentioned before in this write-up. Expectations were that once through 4,200, the drop could accelerate and so far, that’s what has happened. Also, during the week, the markets would try to rally early in the day (buy the dip mentality alive and well) but fall late in the day, turning an up day into a downside rout. Could Monday open very sloppy and we suffer a washout or a mini-crash? It’s possible as fear grabs the market. It’s no surprise that the Fear indices are now registering fear and the market is becoming oversold. We may be near a low, but it may only be a rebound low, not a final bottom. Targets are at least 4,000 for the SPX and possibly 3,800. If we break down through 3,800, the odds increase that the October 2022 low of just under 3,500 could be in jeopardy.
Currently, we do not see much in the way of positives for the market. The Mid-East war is driving a lot of fear and the Russia/Ukraine war could also deepen. As well, there is fear of defaults, especially in the commercial real estate market and a still overvalued housing market. Fear of a recession, despite the decent GDP numbers, is also rising. This past week Q3 GDP numbers were reported at +4.9% above the expected 4.0% and above the last report at +2.1%. Then the Michigan Consumer Sentiment Index was reported at 63.8, down from 68 the previous month but roughly on expectations. PCE prices came in at 3.4%, somewhat higher than the expected 3.2% and the same as last month. Inflation is still sticky and interest rates should remain high for longer.
The big events for the coming week are the FOMC meeting on October 31–November 1 where the Fed is widely expected to stand pat at 5.5%. On Friday we get the October job numbers. The nonfarm payrolls are expected at 190,000, down from last month’s 336,000. The unemployment rate (U3) is expected to remain unchanged at 3.8%. Canada also reports on Friday and jobs are expected to rise 14,000 vs. the gangbuster number of the previous month of 63,800. The unemployment rate is expected to be unchanged at 5.5%.
We have a very nervous market against the backdrop of continued bad news, especially with the war expanding and amidst deeply divided opinions of the war in Western economies. The real fear with this war is expansion and the potential to drag in the U.S. That in turn could draw in other big powers such as China or Russia, especially if Iran were to be dragged into the war, sparking a sharp rise in oil prices.
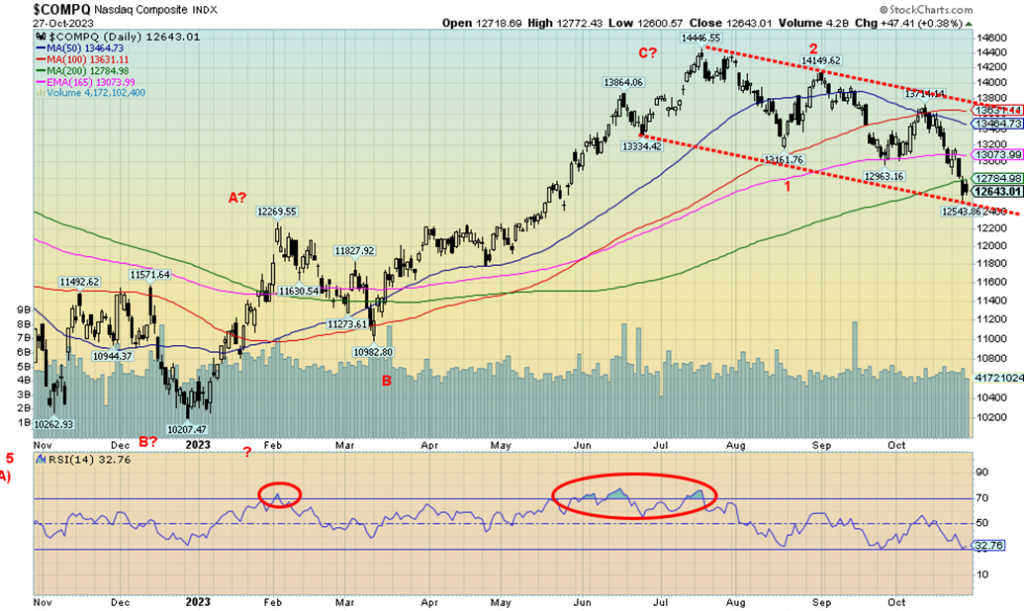
Thanks to stellar results from Amazon, the NASDAQ managed to escape yet another down day on Friday. Still, the NASDAQ lost 2.6% on the week. The NY FANG Index, a component of the NASDAQ, lost 2.4%. Leading the FAANG onslaught was Google, down 9.8%. Amazon gained 2.1% on the week. Not everybody fell as Microsoft +1.0%, Baidu +0.6%, and Alibaba +3.6% helped. AMD dropped 5.3% and Meta (Facebook) fell 3.8%. The NASDAQ took out the 200-day MA, signalling, like the SPX, that we may have entered a bear market. The NASDAQ is down 12.5% from that top in July. Only regaining above 13,000 and especially above 14,000 might save this market. Potential targets are 11,800 once we break to new lows below 12,500.
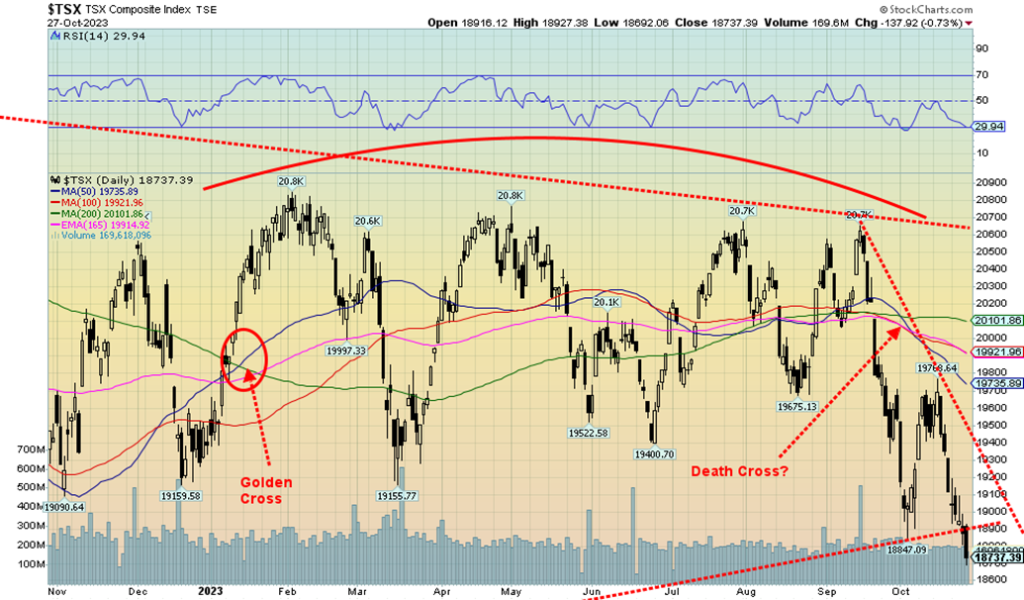
The TSX Composite is breaking down. This past week we knocked out the uptrend line from the October 2022 low for the second time. On the week the TSX lost 2.0%. All those rises we’ve seen over the past year have formed a series of tops, and we are now breaking down from them. Potential targets are between 17,900 and 18,200 as a minimum. Only three of 14 sub-indices managed a gain this past week. Metals & Mining (TGM) was the best, up 1.9%. Telecommunications (TTS) was up a small 0.1% and Utilities (TUT) gained a bit better +0.3%. Leading the way to the downside was Health Care (THC), down 5.3%. But THC is a small component. More important was Information Technology (TTK), down 4.9%, Financials (TFS), off 2.1%, and Industrials (TIN), down 2.3%. Income Trusts (TCM) was also a big loser, off 3.6%. The chart does not look hopeful and we appear to be in the throes of a meltdown. Regaining 19,000 would be helpful but we are a long way off from declaring a low.
Ten of the fourteen sub-indices are negative on the year led by Income Trusts (TCM) down 18.8%. Telecommunications (TTS) is down 16.5% in 2023. The best? Information Technology (TKK) is up 22.1% but is now fading fast. Energy (TEN) is up 9.3% in 2023.
Showing a bit of life was the horribly performing TSX Venture Exchange (CDNX). The CDNX was flat this week, ending a losing streak. The CDNX is down 8.7% on the year vs. the TSX down 3.3%. Both poor performers and no joy for stockholders. With the breakdown this past week, our expectation is lower prices but we are also approaching oversold so a bounce could materialize anytime.
U.S. 10-year Treasury Bond/Canadian 10-year Government Bond (CGB)
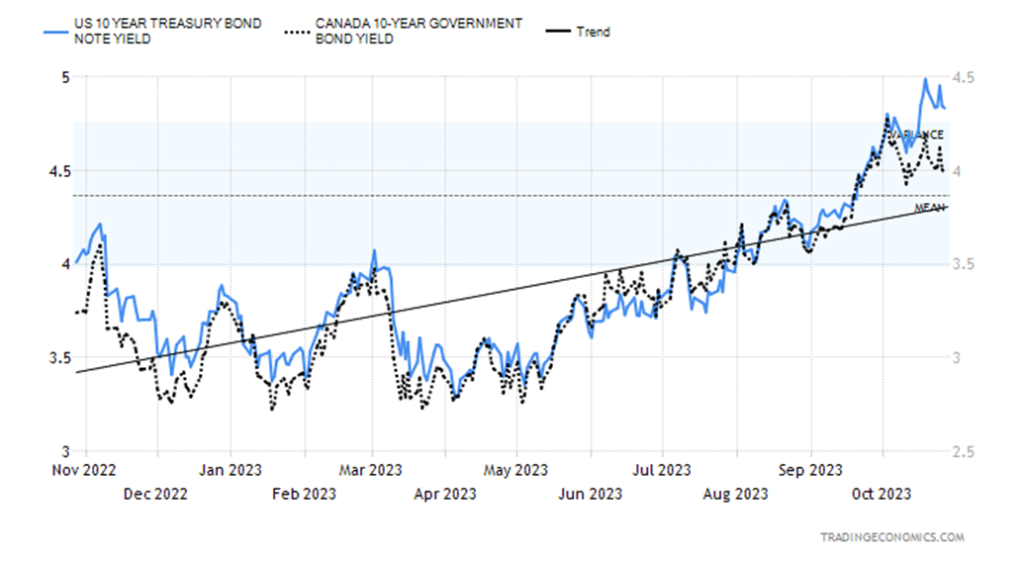
The bond market may be in its worst bear market since the late 1970s, but we note we still haven’t had a bond blow-up. Recent U.S. bond auctions have been decidedly sloppy and the 10-year U.S. treasury note recently jumped above 5% for the first time since 2007, but still there has been no major bond collapse—yet. We’ve been asked who buys all these bonds, notes, and bills.
Central banks, pension funds, private equity funds, hedge funds, banks, insurance companies, fiduciaries, corporations, broker dealers, sovereign funds, and intra-governmental agencies (i.e., Social Security, Fannie Mae, Freddie Mac, Military Retirement, Medicare, etc.) Oh yes, the public, but they may hold them in mutual funds and ETFs rather than directly. With US$33.6 trillion outstanding for U.S. federal debt, plus another $4 trillion of U.S. state and municipality debt, someone has to buy all this.
The Fed would be a last resort. But given the Fed has been conducting quantitative tightening (QT), they are not buying U.S. treasuries much these days but still hold some $3 trillion of U.S. treasuries. Some central banks like China are trying to get rid of U.S. treasuries, given the rising tension between the U.S. and China. The recent tic-data numbers show that China shed another $16.4 billion of U.S. treasuries in August. The public—meaning, all non-U.S. government agencies—holds roughly $26 trillion of U.S. federal debt, with U.S. intra-governmental agencies holding the rest.
The 10-year U.S. treasury bond saw yields fall this past week, down 8 bp to 4.83%. In Canada, the 10-year Government of Canada bond (CGB) fell to 3.98%, off 10 bp. The U.S. 2–10 spread was at 17 bp, up 1 bp, while in Canada it fell to 61 bp from 70 bp. The inverted curve continues to point to a recession, and with the spread narrowing, it suggests to us we are getting closer. Yields fell this past week as funds fled from elsewhere and they buy U.S. treasuries. Some are wondering if yields have peaked, but we need to see them fall under 4.50% to really suggest they’ve peaked.
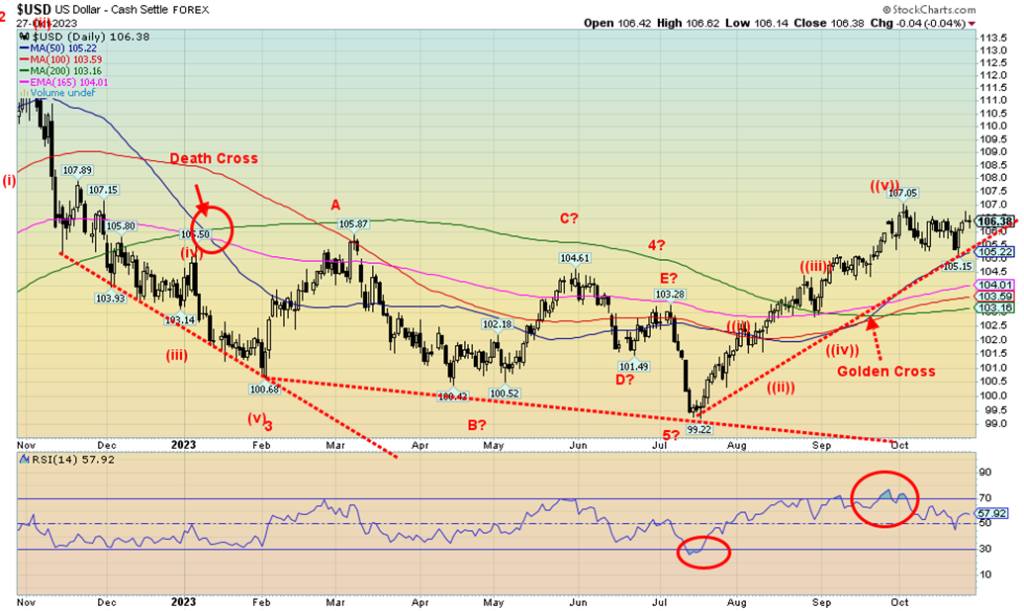
For the past few weeks, the US$ Index (USDX) has waffled, following its run-up to a peak of 107.05. On the week USDX was up 0.4%. The euro was off 0.2%, the Swiss franc pulled back, losing 1.0%, the pound sterling was down 0.3%, but the Japanese yen finally eked out a gain of just under 0.2%. The Canadian dollar was a loser as the Bank of Canada stood pat on interest rates. The Cdn$ lost 1.3%. The U.S. dollar continues to be a safe haven as money flees lower interest rates in the EU and Japan, and war continues in the Middle East and Russia/Ukraine and threatens between China/U.S./Taiwan. There has been, apparently, considerable fleeing of funds in Israel as the war intensifies. The choice, of course, is the U.S. dollar and purchasing U.S. treasury securities.
Normally with a strong US$ Index, gold and precious metals suffer. Not this time as gold is a safe haven and considered even safer than U.S. treasuries. Except there are a lot of U.S. treasuries and not much gold. USDX may be poised to move to new highs above 107. If so, the next targets could be up to 109. A drop under 105, however, might end that thought and under 104 USDX could start to break down. Given that funds are fleeing to the safety of U.S. dollars and U.S. treasuries, we don’t expect to break down but will watch those breakdown points. This may be a fourth wave correction and we could break out above 107.
Israeli Shekel US$1=
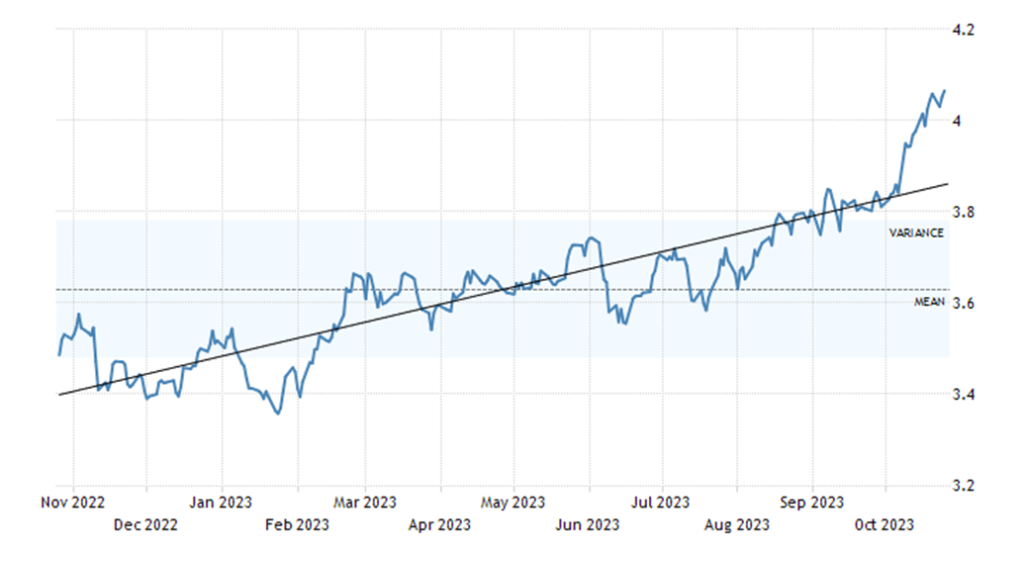
The Israel shekel has been sinking. The above chart shows the number of shekels that U.S. $1 will purchase. U.S.$1 = shekels 4.06. The inverse is Israel 1 shekel = U.S.$0.246 or about 25 cents. Back in January 2023, one shekel could purchase U.S.$0.30. Since then, the shekel has deteriorated by 18%. The economy is barely growing and rating agencies have put Israel on credit watch for the purpose of debt downgrade. Inflation has also been rising, as is unemployment. Thousands have been taken out of the Israeli economy as reservists in the army. It is putting the Israeli economy at risk.
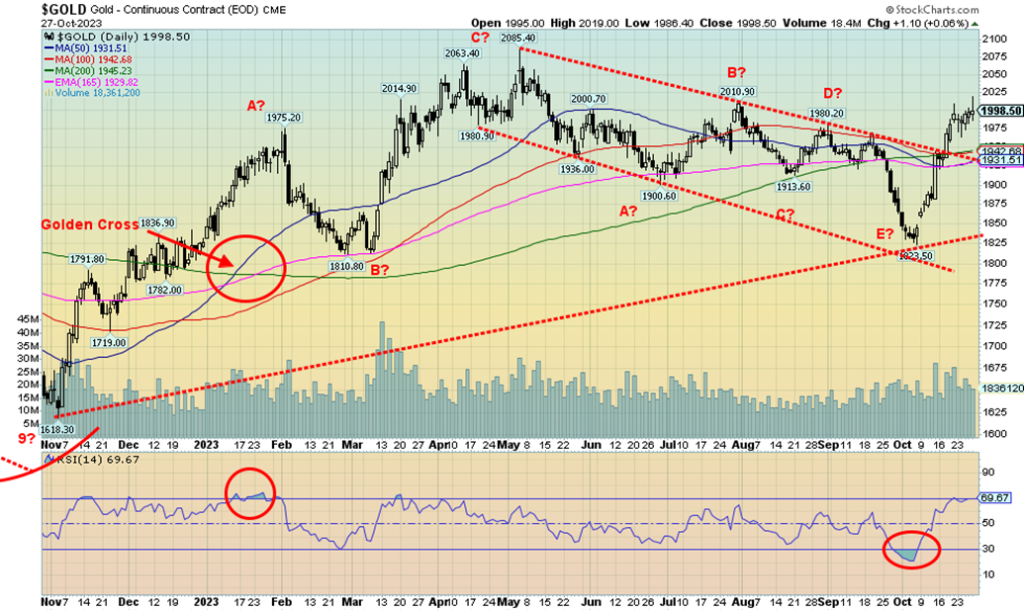
Thanks to the war in the Middle East—with the onset of a ground invasion, the complete cut-off of the Gaza strip in terms of aid, electricity, and communications, the threat of the war spreading on the Northern border with Hezbollah and in the West Bank along with attacks on U.S. military bases in Syria and Iraq and U.S. retaliation—gold, a safe haven, is finding its footing. The December futures closed just under $2,000 this past week, but by all indications, given what cash gold did following the close of futures, gold should open higher on Monday.
The war in the Middle East is intensifying, potentially entering an extremely dangerous phase that could bring in a lot more players. Even Egyptian Red Sea towns were hit by missiles (didn’t say which ones), so could another front open up? All this is good for gold, despite continued high interest rates and a strong US$ Index. As well, U.S. GDP figures came in above expectations. Despite all these negatives, gold rose.
Overall, gold gained only 0.2% on the week while silver actually fell 2.6%. The gold stocks had a strong up day on Friday but closed the week down, with the Gold Bugs Index (HUI) losing 1.2% and the TSX Gold Index (TGD) off 0.3%. With gold breaking through $2,000, our next barrier is at $2,025, then $2,050. Above $2,050, the odds sharply increase that we’ll see new highs above $2,089.
As we have noted, gold appeared to have made a triple top at $2,089, $2,078, and $2,085 but triple tops are extremely rare. The odds instead favour an upside breakout, which we could then target gold to rise to $2,500 or higher. Many are calling for this breakout, but despite that, the broader market doesn’t own gold or at least not much. If the broader market jumps in, as one pundit cracked, it is like trying to squeeze the water behind the Hoover Dam through a garden hose.
Gold has support down to $1,975, then down to $1,930/$1,940. A drop under $1,925 would be dangerous. However, given the current conditions, we believe the odds of that happening are extremely low to nil. The prime reason is the loss of faith in governments, the growing conflicts in the Middle East, and the now- overlooked war between Russia/Ukraine.
As well, tensions continue between the U.S. and China with yet another near miss in the South China Sea. Gold is the ultimate safe haven, given that it has no liability and that it’s durable, consistent, divisible, and convenient. It is protection against depreciating fiat currencies. And, given the monstrous amount of debt outstanding, it is protection against debt collapse.
Over the past few years, we’ve had a bubble in stocks and the housing market, manias in cryptocurrencies, meme stocks, and non-fungible tokens (NFTs), but no mania in gold and precious metals. Are we overdue?
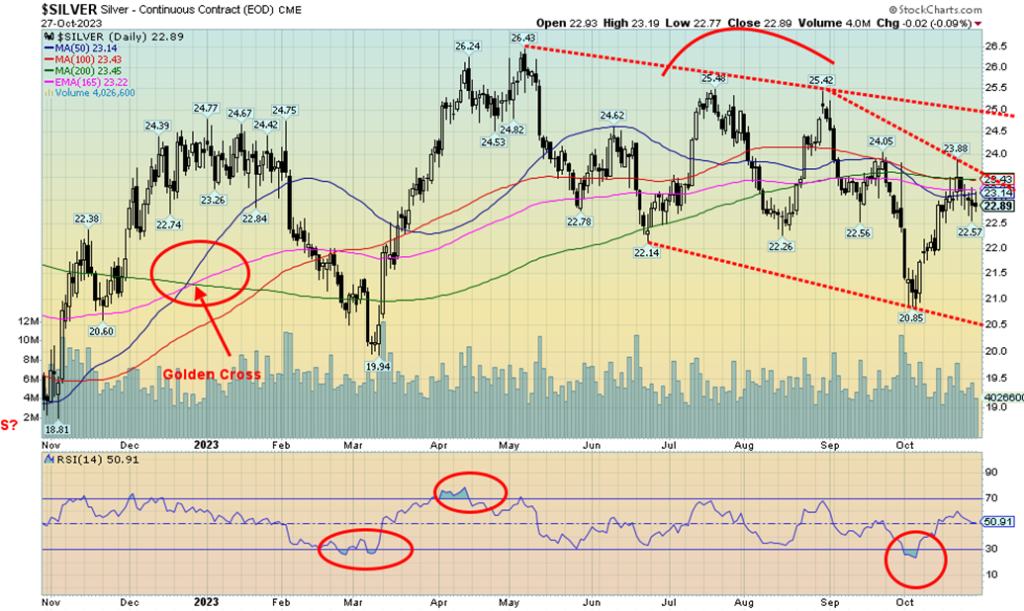
Silver prices can’t seem to get out of the way of themselves. While gold exploded to new highs for the current move this past week, finally breaking above $2,000 (cash basis), silver continues to languish. Silver couldn’t even gain on Friday when gold broke to the upside. We don’t like that action as our preference is that silver leads. Silver on the week lost 2.6%, even as gold gained. $23 is proving to be difficult to break through.
As if $23 isn’t tough resistance, there is further resistance above. Until we take out $25 and preferably $26, silver bulls will be watching nervously. Despite the poor week, silver has gained almost 11% from the earlier low at $20.85. After peaking at $26.43 back in May 2023, silver went into what appears to be an ABCDE-type of corrective pattern. The E wave should have been completed at the $20.85 low. The recent pullback for silver appears to be a normal correction following a rise of over 14%. With an RSI at 51, we have plenty of room to move higher. Once through $23 we can focus on $24, but the reality is we need silver to break above $25/$26 to convince us that we are moving higher. Silver also needs to lead gold.
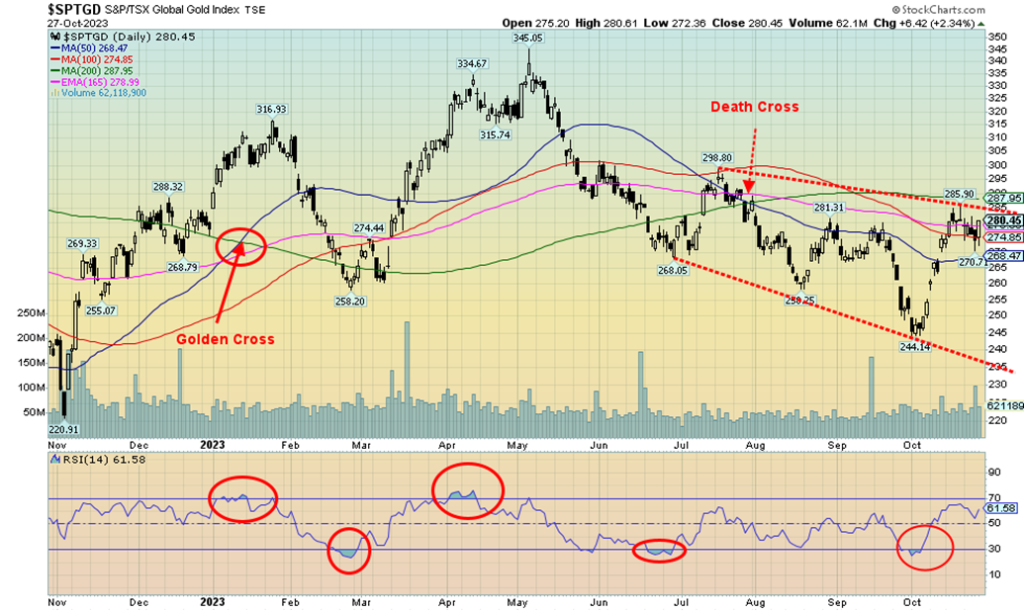
The TSX Gold Index (TGD) ran into resistance around 286 and then pulled back. With Friday’s strong up day against the grain with the stock market falling the TGD appears poised to potentially breakout over major resistance at 288. Once above that level, the next resistance level of 300 needs to be overhauled. The gold stock indices did not fare well this past week, with the TGD losing 0.3% while the Gold Bugs Index (HUI) fell 1.2%.
Friday’s strong up day saved them. Compared to the broader market, they did well and both rose sharply on Friday as gold prices jumped through $2,000 and the Middle East war was threatening to spread as the Israeli ground invasion appeared to be getting underway. The Gold Miners Bullish Percent Index (BPGDM) remains low, around 18, so it has plenty of room to move higher. The short-term (daily) trend has turned up for both indices and we have a few buy signals. However, the intermediate (weekly) and long-term (monthly) trends remain down.
Our key point to take out is at 300. Once that goes, we should continue higher. Above 320, new highs above 345 become possible. Support is seen at 275 and down to 268. Below 260 the market has trouble and could focus on the recent low at 244. With gold breaking above $2,000 and its view as a safe haven the gold stocks should follow, if not lead higher, once the market realizes that gold is going higher.
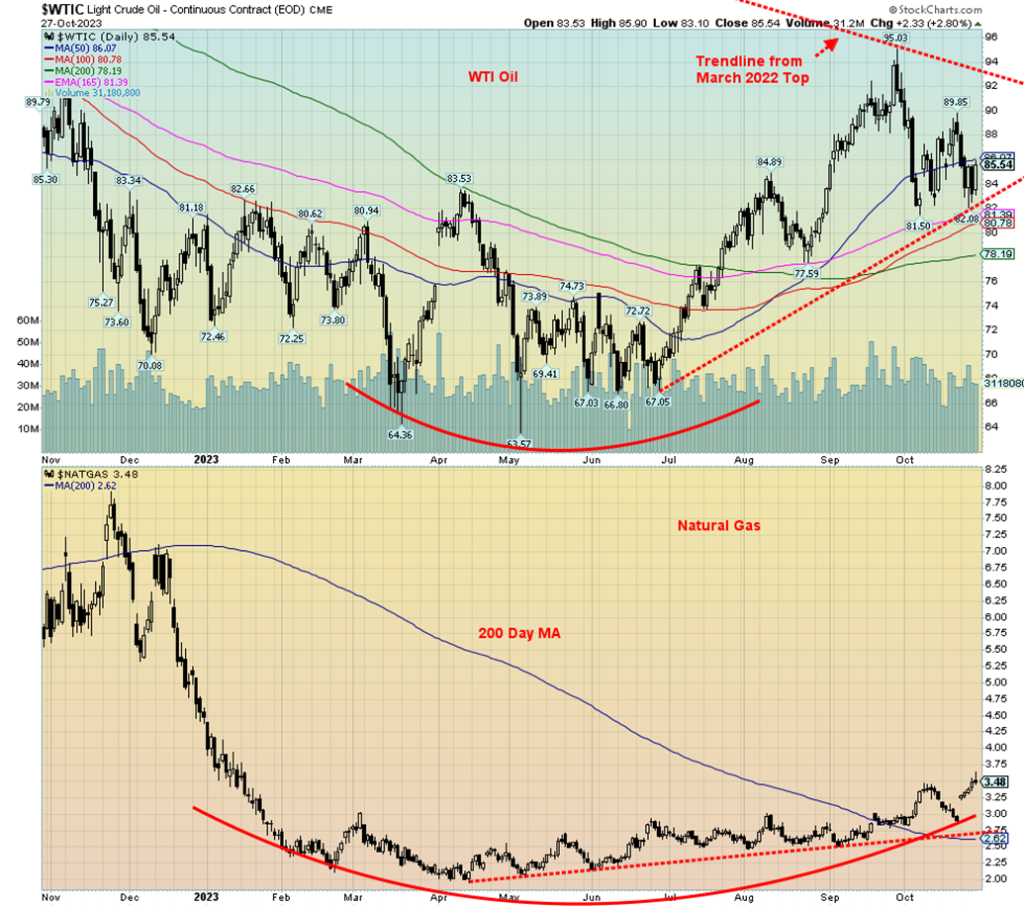
A bizarre week for oil prices as they were battered back and forth by fears of a recession (economic) and fears of how war (geopolitical risk) might impact the price of oil. In the end, fears of war won out but not before the fears of recession had already done their job to knock oil prices back. On the week, WTI oil lost 2.9%. It would have been worse except for the 2.8% gain seen on Friday. Brent crude fell 3.2%.
The recovery on Friday came after the U.S. bombed alleged Iranian assets in Syria, after attacks on U.S. bases in both Syria and Iraq. The question some are asking is, will Iran strike back? Probably not directly. But attacks on U.S. bases in Syria and Iraq most likely will continue. The Syrian government considers the U.S. base in Northern Syria to be illegal on occupied Syrian territory and the Iraqi parliament also voted to expel U.S. troops from Iraq, even as the vote was non-binding. Whether it all spreads into a wider war to include Iran is open to question.
Natural gas (NG) was mixed. Henry Hub NG rose 20% on increased demand and lower inventories. It was the highest level seen in almost a year, closing at $3.48. EU Dutch Hub NG fell 1.1% as warmer weather impacted demand, offsetting the shutting of a gas field off Israel and negative impact on Egyptian LNG exports. The energy stocks appeared to mostly follow the stock market lower this past week as the ARCA Oil & Gas Index (XOI) lost 5.6%, although Canada’s TSX Energy Index (TEN) fared better, off 2.5%.
U.S. stocks in the Strategic Petroleum Reserve (SPR) still need to be replenished, although gasoline stocks have been rising. The need to refill the SPR should help buoy prices, but any outbreak of war in the Middle East that brings in Iran could send prices soaring. NG prices appear poised to move higher, although backing and filling would not be surprising. WTI oil has resistance up to $90 but a breakout over that level and especially over $94 ensures that we should take out the earlier $95 high. The recent corrective appears to have unfolded in an almost perfect ABC flat. As noted, once $94 is taken out, the odds increase that new highs could be seen over $100. Support appears to be strong down to $92.
__
(Featured image by Anna Keibalo via Unsplash)
DISCLAIMER: This article was written by a third party contributor and does not reflect the opinion of Born2Invest, its management, staff or its associates. Please review our disclaimer for more information.
This article may include forward-looking statements. These forward-looking statements generally are identified by the words “believe,” “project,” “estimate,” “become,” “plan,” “will,” and similar expressions. These forward-looking statements involve known and unknown risks as well as uncertainties, including those discussed in the following cautionary statements and elsewhere in this article and on this site. Although the Company may believe that its expectations are based on reasonable assumptions, the actual results that the Company may achieve may differ materially from any forward-looking statements, which reflect the opinions of the management of the Company only as of the date hereof. Additionally, please make sure to read these important disclosures.
Copyright David Chapman 2023
David Chapman is not a registered advisory service and is not an exempt market dealer (EMD) nor a licensed financial advisor. He does not and cannot give individualised market advice. David Chapman has worked in the financial industry for over 40 years including large financial corporations, banks, and investment dealers. The information in this newsletter is intended only for informational and educational purposes. It should not be construed as an offer, a solicitation of an offer or sale of any security. Every effort is made to provide accurate and complete information. However, we cannot guarantee that there will be no errors. We make no claims, promises or guarantees about the accuracy, completeness, or adequacy of the contents of this commentary and expressly disclaim liability for errors and omissions in the contents of this commentary. David Chapman will always use his best efforts to ensure the accuracy and timeliness of all information. The reader assumes all risk when trading in securities and David Chapman advises consulting a licensed professional financial advisor or portfolio manager such as Enriched Investing Incorporated before proceeding with any trade or idea presented in this newsletter. David Chapman may own shares in companies mentioned in this newsletter. Before making an investment, prospective investors should review each security’s offering documents which summarize the objectives, fees, expenses and associated risks. David Chapman shares his ideas and opinions for informational and educational purposes only and expects the reader to perform due diligence before considering a position in any security. That includes consulting with your own licensed professional financial advisor such as Enriched Investing Incorporated. Performance is not guaranteed, values change frequently, and past performance may not be repeated.


Ecobnb Turns Sustainable Tourism Into Measurable Impact
Ecobnb’s sustainable tourism platform generated significant environmental and social impact in 2025, avoiding 58,207 kg of CO₂ and adding 583...


Sugar Markets Balance Biofuel Demand and Global Supply
Sugar markets in New York and London were mostly unchanged as the Iran conflict renewed interest in biofuels. Drought concerns...


The $40 Trillion Trap: Disinflation Is Not Deliverance
U.S. debt has reached $40 trillion, with $24 billion weekly interest, while deficits accelerate. Despite disinflation in CPI, from cooling...


FinTech Matures as AI and Infrastructure Drive the Next Growth Phase
Fintech markets are entering a mature phase, shifting from rapid growth to consolidation, specialization, and sustainable business models. Zurich and...


Bitcoin, and Ethereum Rise, While Cardano Enters Transition
Bitcoin and Ethereum posted modest weekend gains, supported by ETF inflows. A new proposal may protect Bitcoin from quantum threats....
 |
|
 |  |
 |
|
-

 Biotech6 days ago
Alzheimer’s Study Reveals Immune Pathway Behind Women’s Higher Vulnerability and Potential New Treatment Approach
-

 Biotech2 weeks ago
The New Biotech Act Targets Europe’s Funding and Innovation Gap
-

 Crowdfunding4 days ago
Avant Devices Moves Toward Electric Wheelchair Kit Production with New Funding Drive
-

 Africa2 weeks ago
Bank of Africa Launches SME Pact to Boost Business Growth