Markets
Gold’s Price in Foreign Currencies
It’s best to think of extreme-market volatility for gold, as something that happens whenever big things are happening in the gold market, be that big bull market advances, or big bear market declines in the price of gold. I call these days of extreme volatility for gold to be 3% days, but the 3% is only a threshold value, that once crossed becomes a day of extreme volatility.
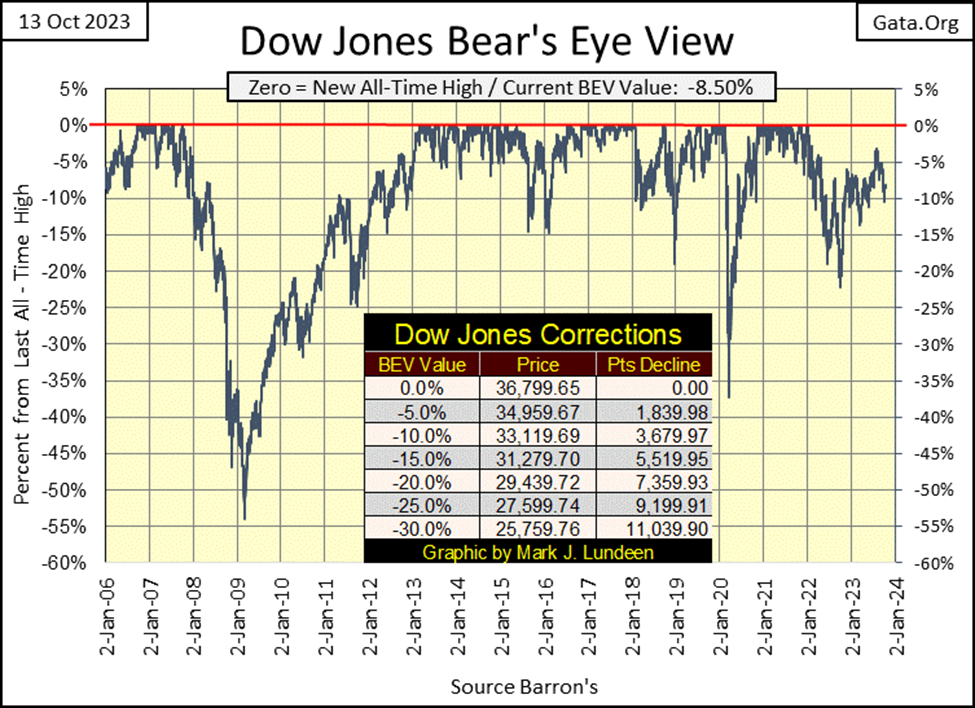
The Dow Jones advanced a bit this week, bouncing off its BEV -10% line. With things happening in Israel and the Gaza Strip, one would think the Dow Jones should have gone down. I still expect the next significant level to be crossed by the Dow Jones below will be its BEV -15% line. Time will tell if I’m right.
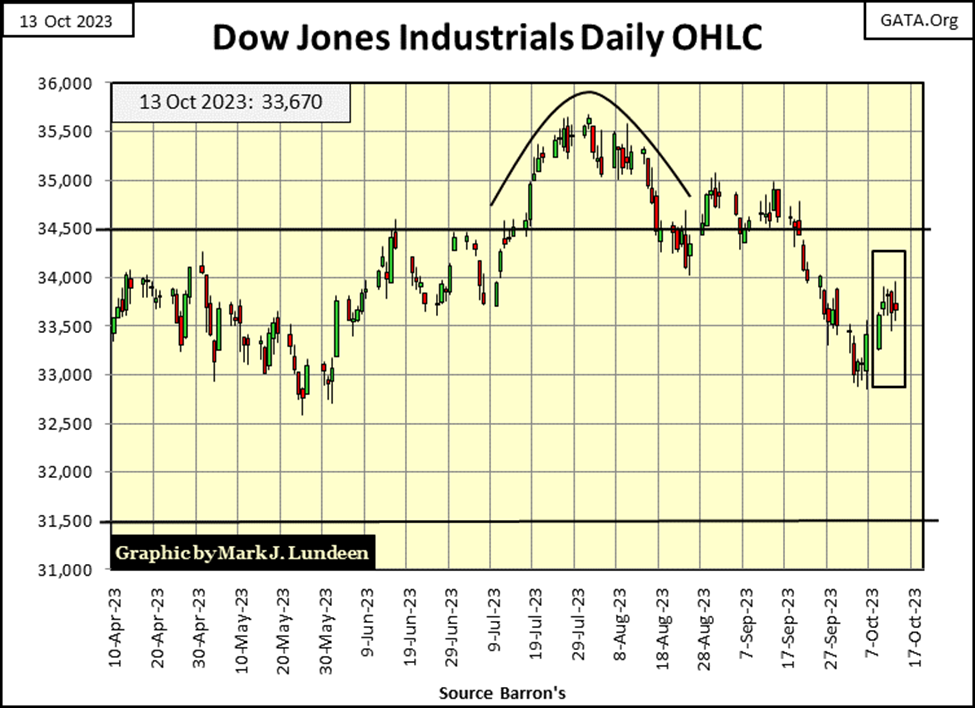
Here is the Dow Jones in daily bars. Monday saw a good advance in the Dow Jones, but the remainder of the week did little for either the bulls or the bears. The Dow Jones did close the week over its 33,500 level. Can the Bulls keep it there? Being a bear, I think they won’t be able to for long, and the Dow Jones will once again decline below 33,000, on its way below 30,000.
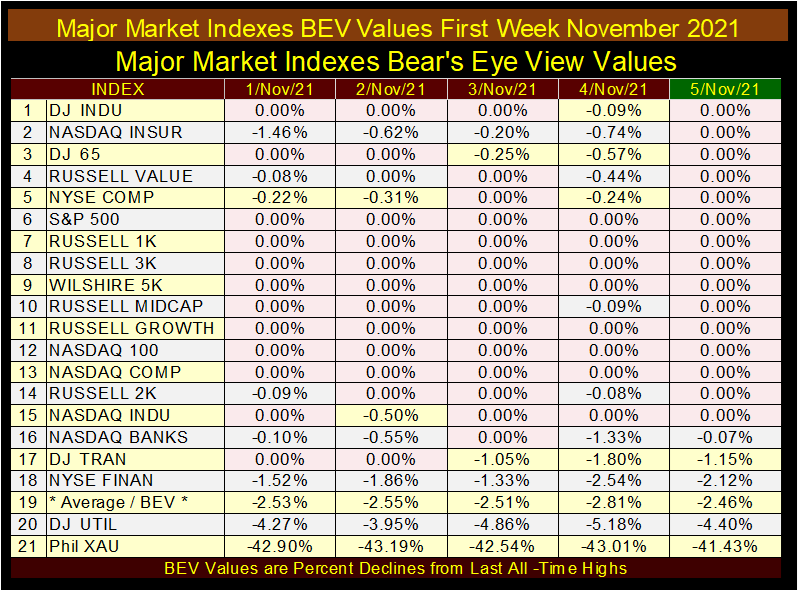
Here are the BEV values for the major market indexes I follow. The NASDAQ Insurance Index closed three times this week in scoring position (BEV of -0.01% to -4.99%). Nothing else did, and that is how things have been for a long time.
The average of these Indices BEV values (#14) closed the week at its lows. That seems like something to take away from this week’s trading; that on average these indexes were down for the week. Is there any reason to believe it will be different next week? Nothing that I can see.
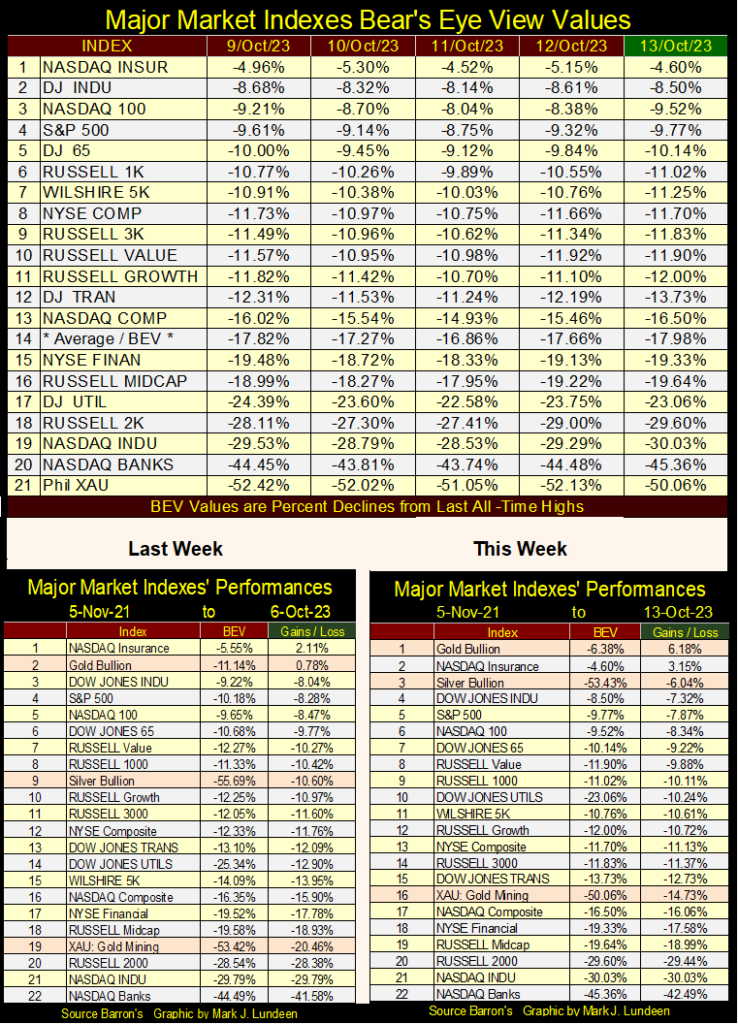
Gold and silver saw strong gains this week in the performance tables above, as did the XAU. Gold is back at #1. Silver jumped from #9 last week, up to #3 this week, as the XAU advanced to #16.
In these performance tables, I use 05 November 2021 as my base for the losses and gains, as that was the market top for the post-March 2020 Flash Crash rebound, made possible with the trillions of dollars of “liquidity injected” into the financial system by Powell’s Not QE#4.
The table below shows what that week’s BEV values for the major market indexes looked like, where for these five days in November 2021, these indexes saw new all-time highs (0.00% / BEV Zeros) more times than not. Except for the XAU, and one day for the Dow Jones Utility Average, every other day these indexes closed in scoring position, if not at a BEV Zero.
Below is what a market top looks like, where market risks are maximum, and the possibility for being rewarded for assuming those risks are minimum. It’s been almost two years since that week in the market. Since then, I doubt retail investors have made much, if any money being bullish on the stock market.
It might be years before being a bull on the stock market is once again profitable. Before that happens, the market must first see the bottom of the bear market we now find ourselves in, a bear-market bottom where these indexes’ BEV values will be far below where we saw them this week (BEV table above).
Below is a table I haven’t posted for a while; the price of gold in foreign currencies. How is this data calculated? I have a file on foreign currencies, Friday’s closing rates of how many units of these countries’ currencies per one US dollar. I take those ratios and multiply each of them by the price of gold in US dollars, published in the two Barron’s issues noted in the table below.
I’ve also included US CinC data, in billions of dollars, published in Barron’s issues (#8 in the table). These values for CinC / #8, are not in terms of gold, just paper dollars in circulation, and my preferred measurement of inflation, though no one else seems to use CinC as an inflation index.
Exactly what are we looking at below? That is a good question, one I don’t have a good answer to. My problem with this data is the price of gold, and foreign currency exchange rates must be two of the most manipulated markets in the world. Though long ago, the price of gold and national currencies was fixed and unchanging;
- so many units of currency / per ounce of gold (Pre-Bretton Wood’s)
- so many units of currency / per one US Dollar (Bretton Wood’s), until August 1971.
Before August 1971, when currencies became unfixed, the offending country had broken their unit of money by over-issuing their currency. Barron’s itself has been published weekly since April 1921, but they never published forex rates on a weekly basis until their 01 April 1975 issue. Four years following the US Treasury’s abandonment of the Bretton Wood’s $35 gold peg, many nations were also breaking their currency with monetary inflation, and forex rates began to float.
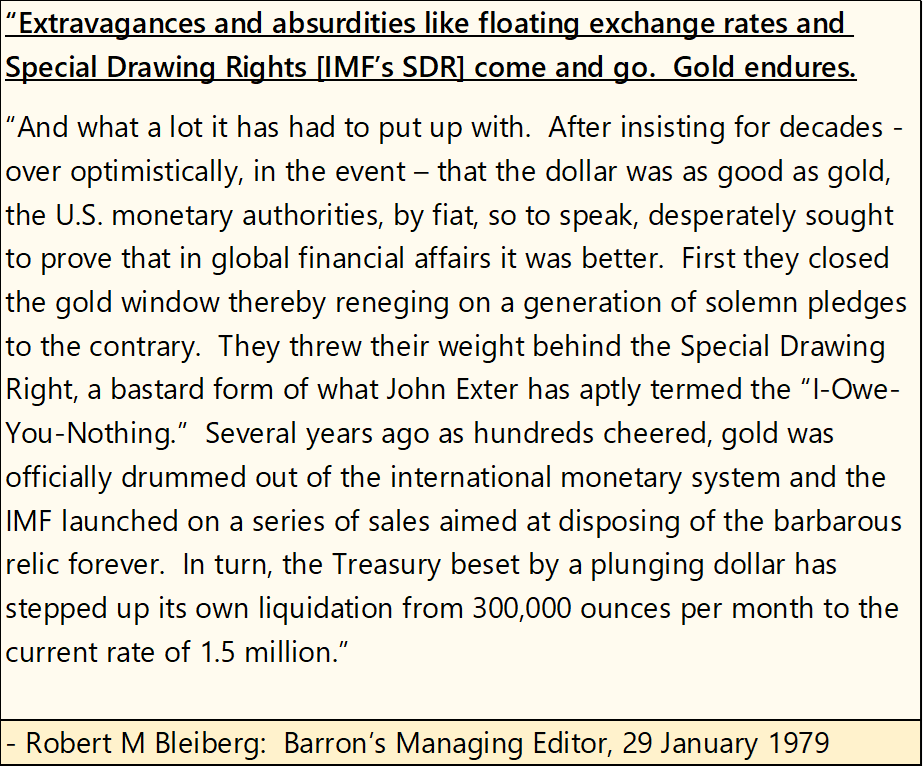
Today in 2023, the idea of exchange rates changing on a moment-to-moment basis is a commonly accepted idea in the market. If investors want to take a walk on the wild side, they can swim with these sharks, and speculate in the foreign exchange (forex) market. This was not always so. In January 1979, Robert Bleiberg (Barron’s Managing Editor) called floating exchange rates an “absurdity.” Long ago in 1979, I’m sure many other market watchers agreed.
Way back then, as noted above, currency manipulators sold physical gold by the tons to manage the price of gold, as a rising price in gold was a failing grade for any national currency. The problem with selling physical gold is; that the supply of actual gold is finite, and can quickly exhaust itself, even with the huge gold reserves held in Fort Knox.
That is why today, the “policymakers” manipulate gold and silver prices in the futures markets, as futures contracts are only a promise to deliver metals sometime in the future, promises that are easily canceled with no actual delivery of metal, and at a profit to them, if not we long-suffering gold bulls. Selling gold contracts at the COMEX * IS NOT * an obligation to exchange metal for cash today in the spot market, and so the price manipulation in the gold and silver market has gone on for decades.
Whether the manipulators of gold managed its price via selling actual physical gold, or with promises to deliver gold sometime in the future in the futures market, the price of gold (and silver) has been manipulated for many decades. No one knows what the price of gold would be in an unregulated market, in a market free from the designs of politicians, academics, and bankers. The price of gold and silver would soon be many multiples of what they trade for in today’s “regulated marketplace.”
So, exactly what are we looking at below? The market price of gold in various national currencies in two issues of Barron’s; 10-August 2020 and 16-October 2023. I chose the August 2020 Barron’s issue, as it was in that issue when Treasury bond yields hit their bull market lows, and have risen ever since. That plus August 2020 was also when gold saw its last all-time high in US dollar terms. The October 2023 issue, because that is the latest data available.
The table is sorted by which national currency has gold seen its greatest appreciation / by which nation has trashed its currency to the greatest degree. Number #1 in the table is Argentina, which has seen its peso price of gold increase by 356.82% in the past three years.
Argentina must be the biggest offender of abusing its currency in the past 100 years. Since August 1986, indexing the Argentine peso’s exchange rate to 1.00, in October 2023 it has increased by a factor of 2.88 million. What a horrible thing a government would do to its citizens’ wages and income; steal everything they can with hyper-inflation.
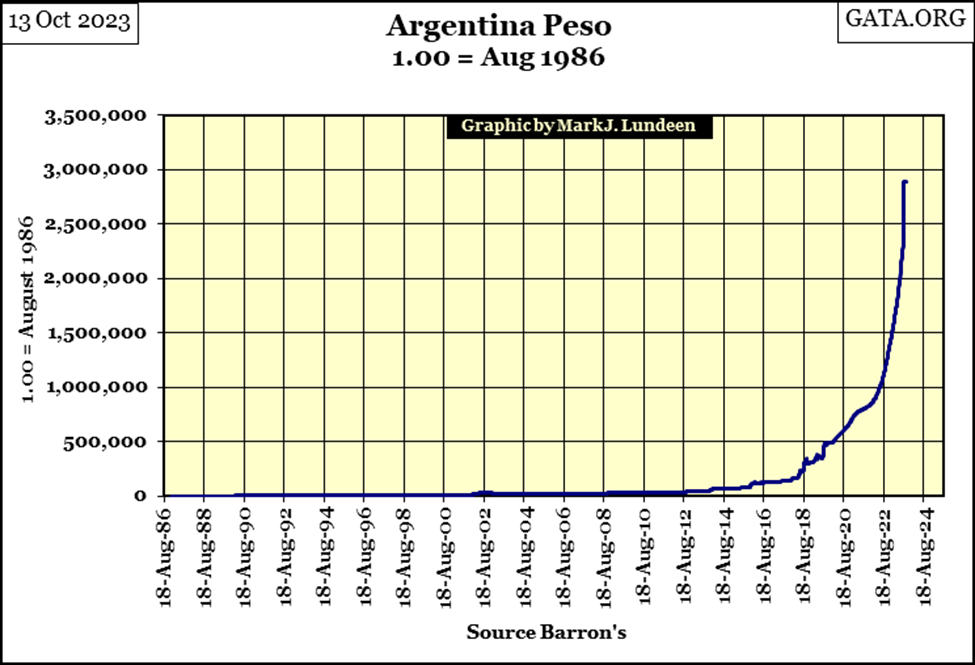
Strange, but Argentina means the land of silver.
Mexico (#38) has seen the price of gold DECLINE by 23.89%, meaning the Mexican monetary officials have abused their currency the least of the other countries listed in the table. Good for them and the Mexican people.
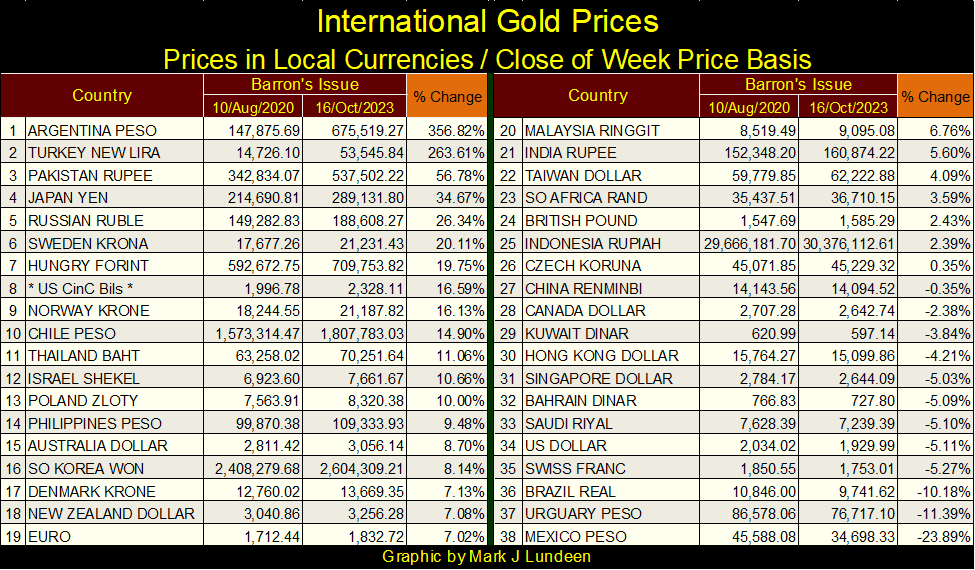
The United States is #34 in the table above. But the dollar price of gold is manipulated far below its free-market value. If the machinations the price of gold suffers at the COMEX futures markets should cease, what then would be the price of gold? As all the values seen in the table above are based on this same dubious US dollar-based price of gold, they too share this flaw in their pricing.
So then, what are we actually looking at in the table above? The price of gold in various currencies? Yes, and no. One thing is certain, for anyone living in a country whose government is trashing their money, like in Argentina or Turkey (#1&2 in the table), owning gold is much better than saving money in the bank.
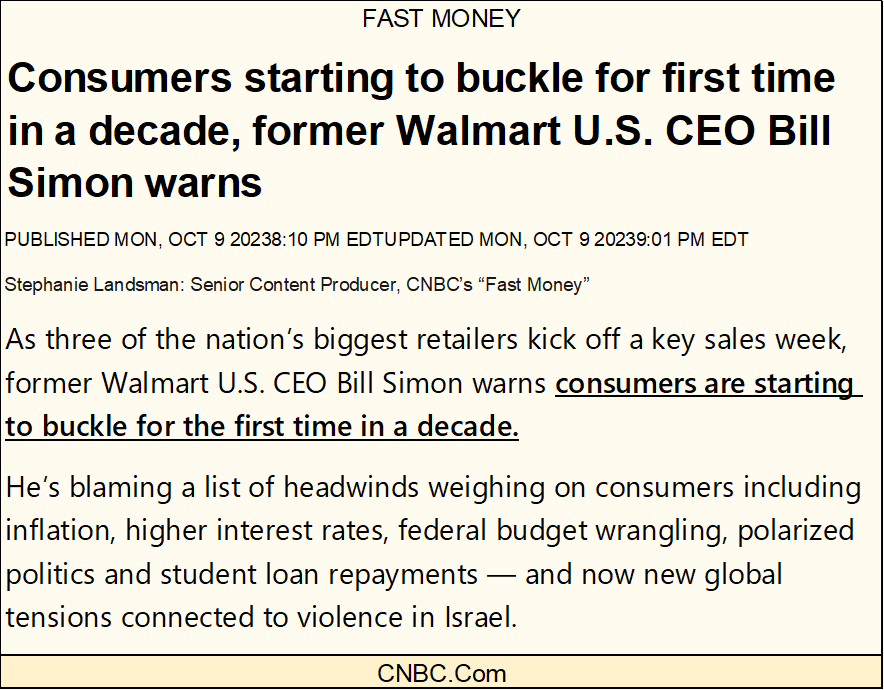
What? According to CNBC, “consumers” are beginning to buckle? That can’t be good!
One factor the article above failed to list as a problem for “consumers,” is made obvious in the chart below; for decades personal income (Green Plot) has fallen behind CinC (inflation Red Plot), and the growth in consumer credit (Blue Plot). The banking system continues providing credit to consumers, but the ability of consumers to service their debts to the banking system is not what it used to be.
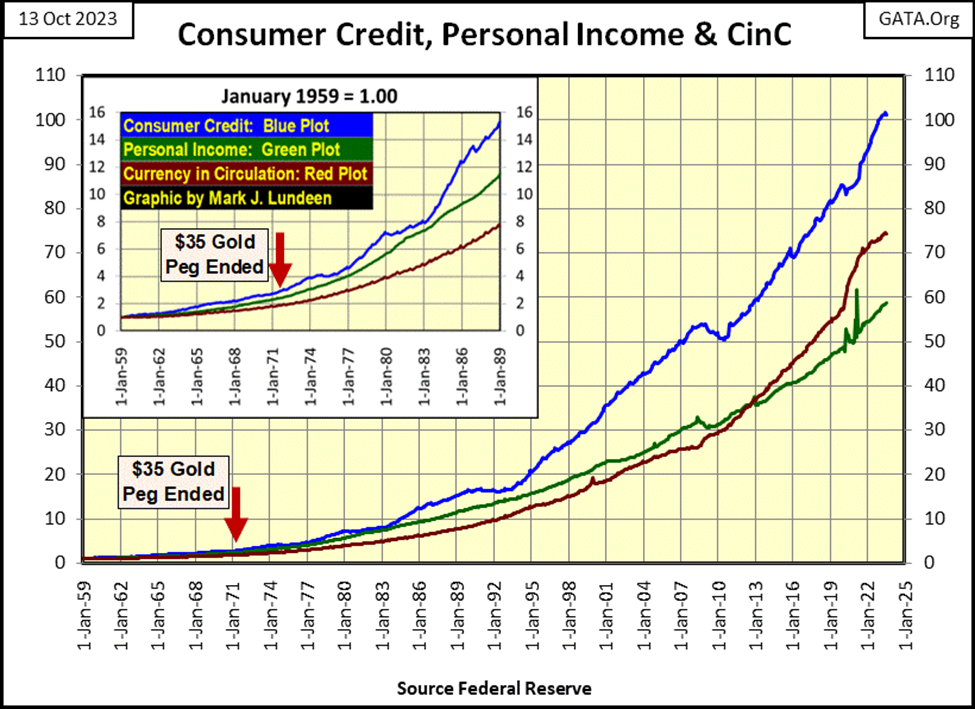
The chart above is just for consumer debt. Add to that mortgages, school loans, and auto loans, and it’s not difficult to understand why there are many “consumers” finding it hard to service the debts for their past consumption, with zero ability to increase their consumption beyond current levels. The days when consumers, at the urging of mainstream economists, could “save the economy” by increasing their consumption with credit may be over, as happened during the 2000-02 NASDAQ High-Tech Bear Market in the quote below.
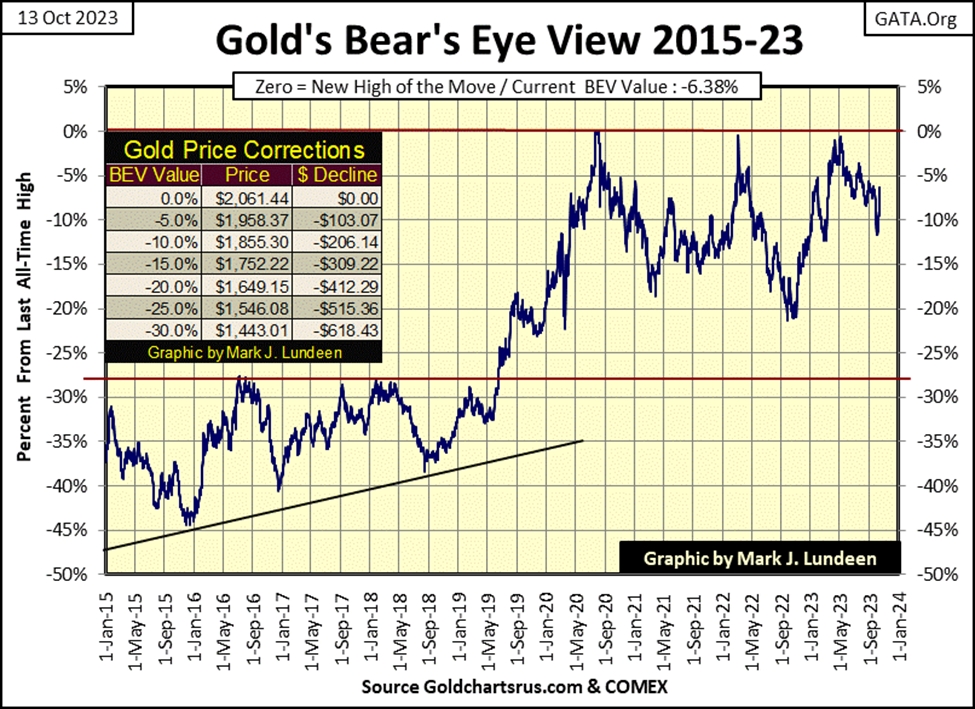
At the start of the week, gold was below its BEV -10% line, and closed the week almost at its BEV -5% line, with most of this weekly gain happening on Friday, as gold advanced by $61.19 from Thursday’s closing price.
Guess what? Friday’s big advance proved to be a day of extreme volatility for gold, a day where gold moved 3%, or more from a previous day’s close; 3.27% on Friday. The chart below plots every 3% day for gold since January 1969. There weren’t any days of extreme volatility before January 1969, as the price of gold was fixed at $35 an ounce before then. But in the past 54 years, gold has seen 442 days of extreme volatility, seen in the chart below. Most of these 3% days occurred before December 2000.
With the stock market, when the Dow Jones sees a day of extreme volatility, a 2% day for the Dow Jones, is something that usually happens in a bear market. But gold, with its 3% threshold for a day of extreme volatility is different, as gold can see multiple days of extreme volatility during both bear and bull markets.
It’s best to think of extreme-market volatility for gold, as something that happens whenever big things are happening in the gold market, be that big bull market advances, or big bear market declines in the price of gold.
I call these days of extreme volatility for gold to be 3% days, but the 3% is only a threshold value, that once crossed becomes a day of extreme volatility. Some of these 3% days in the 1970s and early 1980s, saw gold move more than 10% from one day to the next, and the largest daily advances in the chart below, happened during the massive 1980 to 2001 bear market.
Since the start of the 2001 to 2023 bull market in gold, extreme volatility has become less extreme, and more infrequent, when compared to the extreme volatility of the 1970s and early 1980s. I don’t know exactly why this is so, but I believe it to be an artifact of the massive market manipulation gold has been subjected to since 1980.
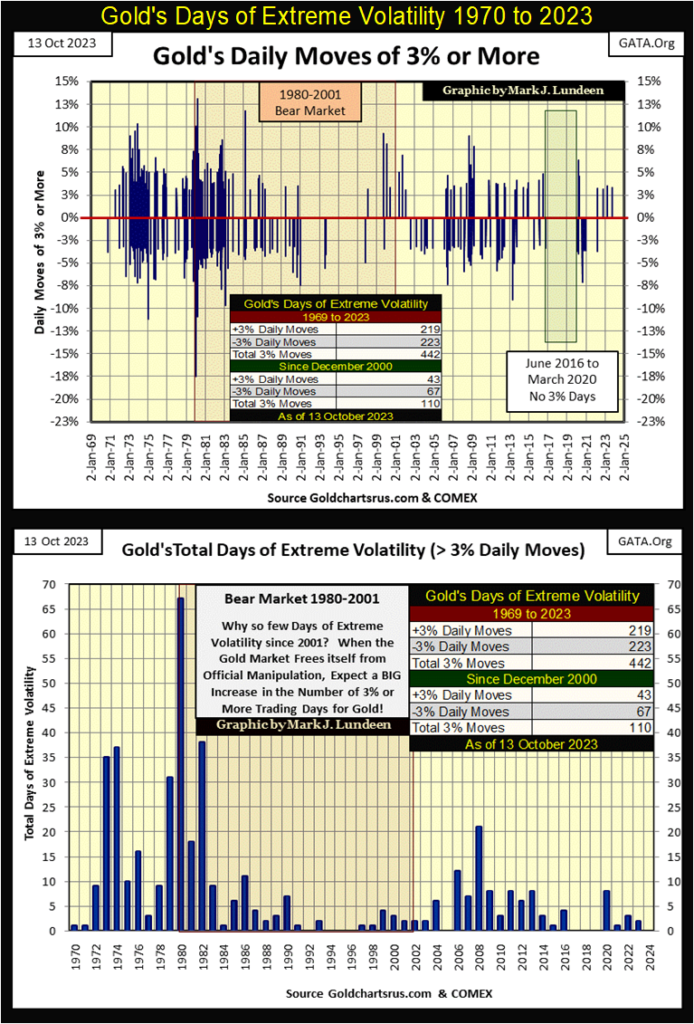
In the chart above, I’ve plotted the quantity of 3% days for gold by year. Since gold began a new bull market in 2001, its volatility has been much reduced when compared to the volatility for the 1970 to 1980 bull market.
So far for 2023, gold has seen only two 3% days, and so far in 2023, gold has been disappointing to its bulls. Gold’s last all-time high happened in August 2020, which in the chart above, 2020 saw eight 3% days. If gold is going to take out its last all-time high from 2020, it will have to begin stacking up some 3% days for 2023 to make that happen.
The relentless selling in the gold market ended in early October, and gold is once again seeing days of advancing prices in its step sum table below. Since October 2nd, nine days ago, gold has advanced by $108. I like that! I also like that gold’s daily volatility’s 200D M/A jumped from 0.62% on Thursday this week, to 0.64% at Friday’s close. As it is now, there would be nothing more bullish for gold than seeing its daily volatility begin to trend towards, and then exceed 1.00%.
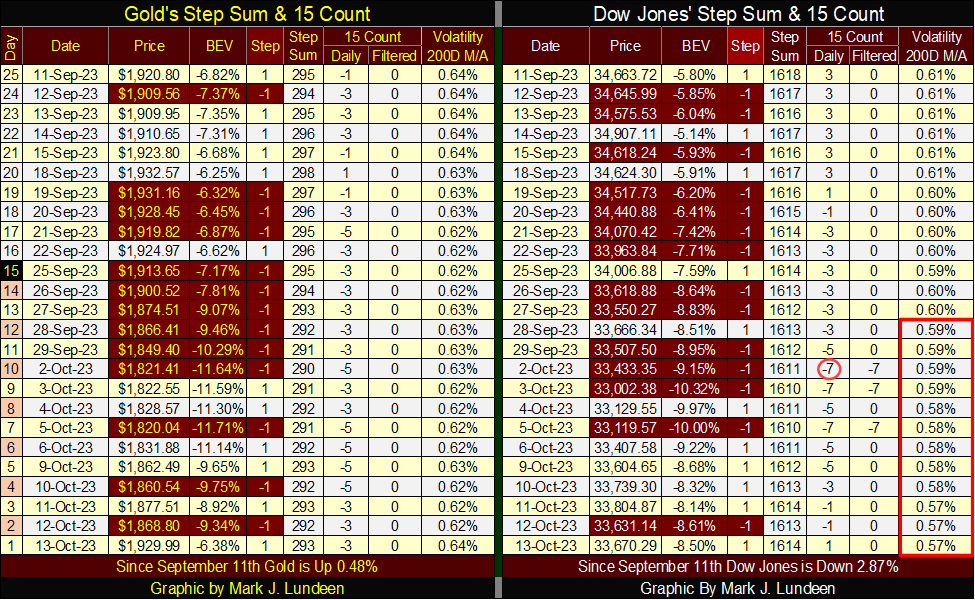
Selling pressure for the Dow Jones has also been reduced, but unlike gold, the Dow Jones has so far not seen a sharp uptick in its valuation. Daily volatility for the Dow Jones closed the week at 0.57%, that is an important point to keep in mind.
A few weeks ago, I covered timing entry and exit points in the stock market using the daily volatility for the Dow Jones, below is a chart I used to illustrate this system.
Bear markets begin when daily volatility bottoms below 1.00%, to then increase, and then break above 1.00%. Bear markets then bottom when daily volatility peaks in the spikes seen below. Bull markets begin as daily volatility begins declining from these peaks in the spikes seen below, bull markets top out with daily volatility somewhere below 1.00%.
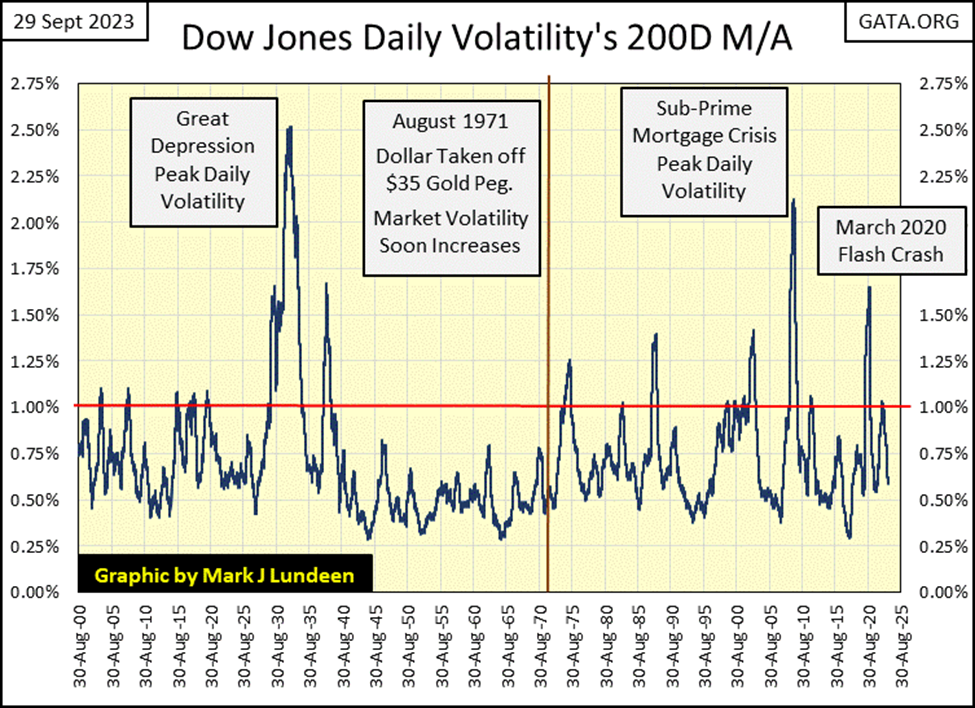
Seeing the daily volatility for the Dow Jones close the week at 0.57%, indicates the stock market is still very near a bull market top. Meaning; this is a time to lock in profits by selling, not to take on new positions in a bull market, as was the case in late 2020, when daily volatility for the Dow Jones began declining from its peak value of 1.65%.
These things take their own time, usually longer than most people have patience for. But I believe we are in a historic bear market that will one day take Dow Jones daily volatility up to, and maybe exceed the volatility spike seen for the 1929-32 Great Depression in the chart above. So, you guys be careful out there.
__
(Featured image by Anne Nygard via Unsplash)
DISCLAIMER: This article was written by a third party contributor and does not reflect the opinion of Born2Invest, its management, staff or its associates. Please review our disclaimer for more information.
This article may include forward-looking statements. These forward-looking statements generally are identified by the words “believe,” “project,” “estimate,” “become,” “plan,” “will,” and similar expressions. These forward-looking statements involve known and unknown risks as well as uncertainties, including those discussed in the following cautionary statements and elsewhere in this article and on this site. Although the Company may believe that its expectations are based on reasonable assumptions, the actual results that the Company may achieve may differ materially from any forward-looking statements, which reflect the opinions of the management of the Company only as of the date hereof. Additionally, please make sure to read these important disclosures.


Ecobnb Turns Sustainable Tourism Into Measurable Impact
Ecobnb’s sustainable tourism platform generated significant environmental and social impact in 2025, avoiding 58,207 kg of CO₂ and adding 583...


Sugar Markets Balance Biofuel Demand and Global Supply
Sugar markets in New York and London were mostly unchanged as the Iran conflict renewed interest in biofuels. Drought concerns...


The $40 Trillion Trap: Disinflation Is Not Deliverance
U.S. debt has reached $40 trillion, with $24 billion weekly interest, while deficits accelerate. Despite disinflation in CPI, from cooling...


FinTech Matures as AI and Infrastructure Drive the Next Growth Phase
Fintech markets are entering a mature phase, shifting from rapid growth to consolidation, specialization, and sustainable business models. Zurich and...


Bitcoin, and Ethereum Rise, While Cardano Enters Transition
Bitcoin and Ethereum posted modest weekend gains, supported by ETF inflows. A new proposal may protect Bitcoin from quantum threats....
 |
|
 |  |
 |
|
-

 Africa1 week ago
Morocco Cuts Card Fees to Spur Digital Payments, but Uncertainty Remains
-

 Markets2 weeks ago
Rice Prices Rise as Supply Outlook Tightens and Demand Stays Mixed
-

 Cannabis5 days ago
Virginia Cannabis Market Could Reshape Regional Competition
-

 Biotech2 weeks ago
BIP Sells BIC Incubator to Innova, Refocuses on Core Innovation Areas