Markets
Dow Jones Industrials (DJI) with a new record high, price of gold might change
Gold fell to a low of $1,223 before reversing on Friday and the cash market rose to $1,234 roughly $8 above the futures close of $1,226. This bodes positively for gold come Monday morning.

Fed Chair Janet Yellen’s speech last week steadied the markets from the elation of Trump’s Congress speech, pushed the US$ higher, and knocked gold (and gold stocks) for a loop. Her musings also helped push up interest rates as the 10-year US Treasury note yield jumped to 2.49% from 2.31% and it is now not far from its previous high of 2.60%. Bond yields globally were pushed up because of Yellen’s comments. The two-year yield is now at 1.32% vs. 2.02% for the five-year. The two-year is still ways from catching up to the five-year. As long as the yield curve remains positive, the markets and the economy could be construed to be “all right”. It is when the yield curve goes negative that vulnerabilities appear.
Model Portfolio
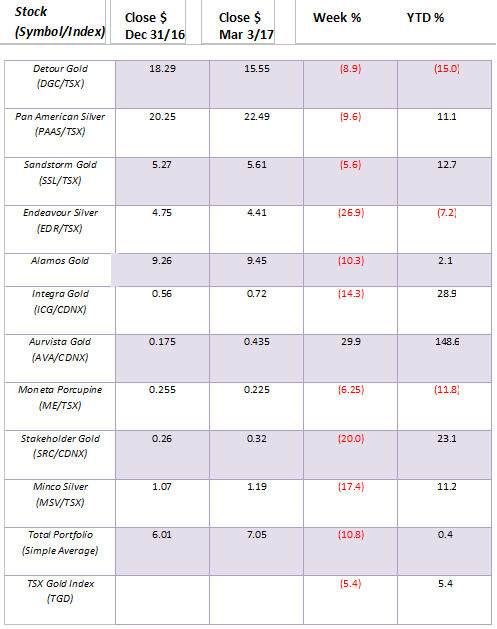
Welcome to the world of volatile gold stocks. Ergo, that’s why we advise that the sector is for those with strong stomachs. And talk to your broker. If there is one problem with the gold stock market it is that it is a very small market, so moves both up and down can be exaggerated. The portfolio fell this past week on weak volume suggesting to us that the down move is corrective only. Only one stock fell on large volume. Endeavour Silver reported an unexpected Q4 loss of $5.2 million—double that of last year.
Worse, production was down and costs were up. Not pleasant. We will sell this one reluctantly, take our lumps, and move on. On the other hand, Aurvista (AVA/TSXV) remains a star, jumping almost 30% on the week and up 148.6% on the year. While others are struggling a bit, we remain positive towards the market and continue to look for $1,500 gold later this year.
© David Chapman
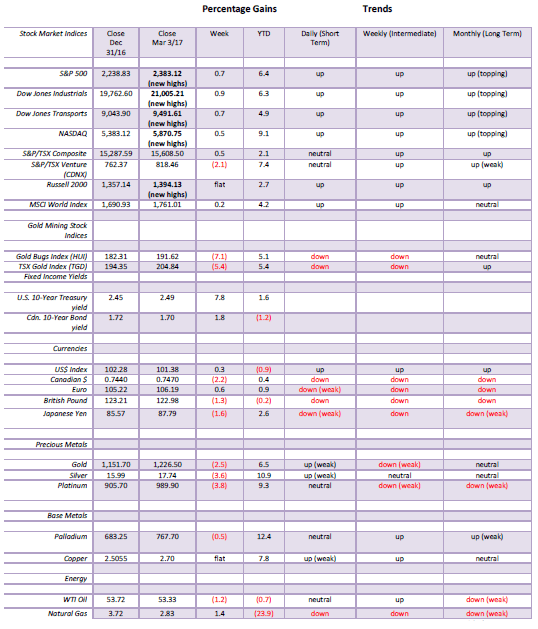
MARKETS AND TRENDS
© David Chapman
Note: for an explanation of the trends, see the glossary at the end of this article.
New highs refer to new 52-week highs.
Key Economic Numbers Week February 27 to March 3, 2017
(Source)
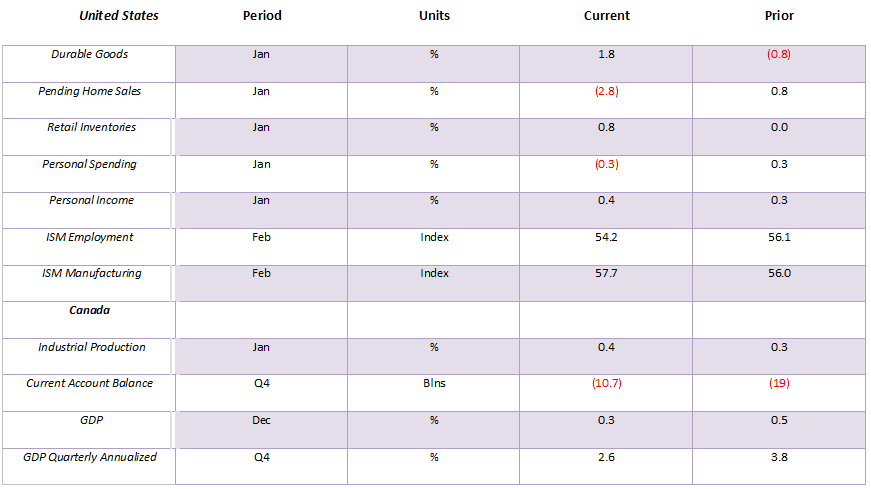
(Source: www.shadowstats.com, www.data.bls.gov, www.statcan.gc.ca, www.tdeconomics.com)
Note: % M/M unless otherwise noted
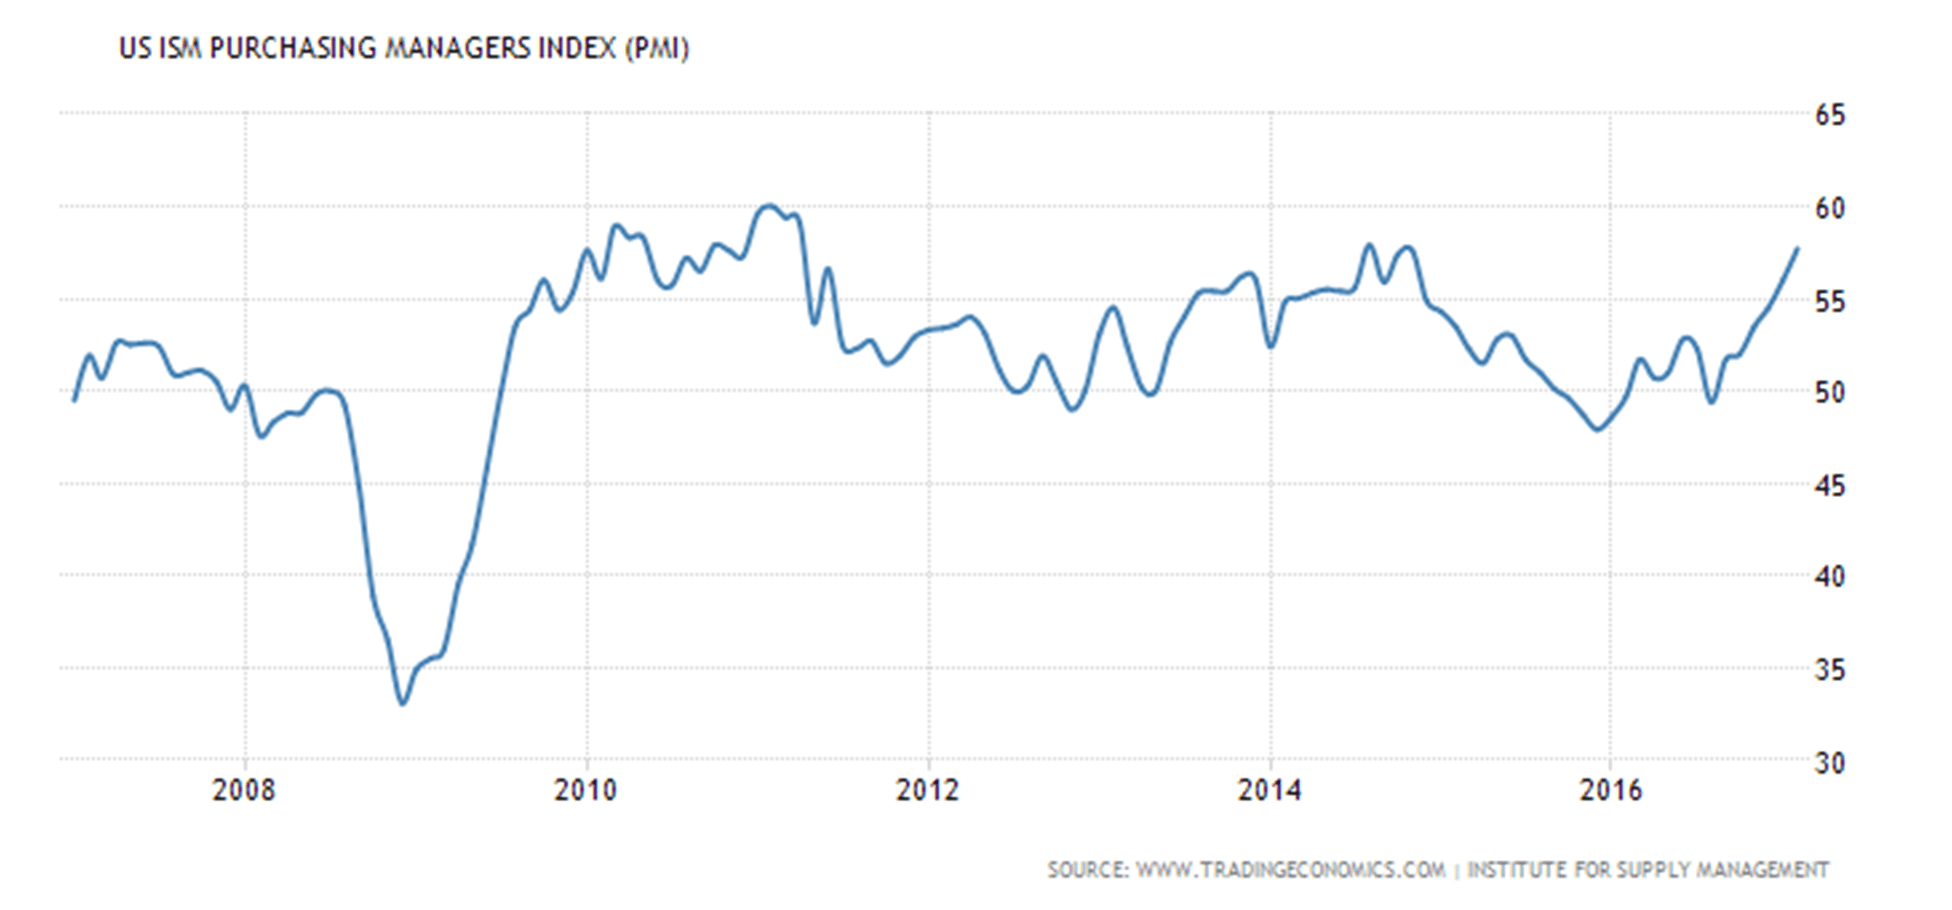
The ISM manufacturing index for February came in at 57.6 vs. 56 for January and above expectations. It is the highest since August 2014. It is indicative of rising new orders and production with continued easing of employment. It reflects positive business conditions. It could also be a factor for Janet Yellen and the FOMC as to whether they hike interest rates at the March FOMC.
(Source)
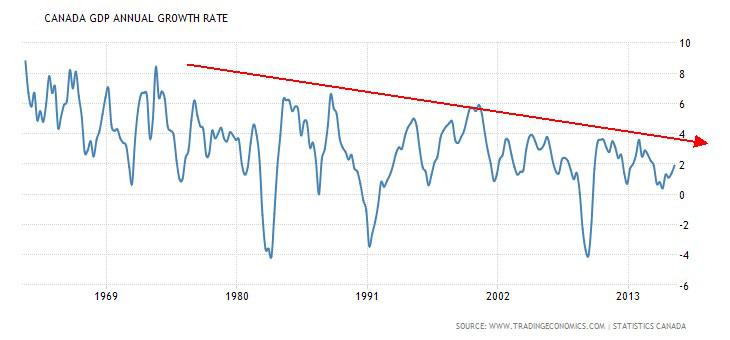
Canada’s GDP growth was up 1.9%, annualized in Q4 over the same period a year earlier. Still, Canada’s economy continues to underperform previous periods as witnessed by the chart above. We may be well above recessionary times of the early 1980s and 1990s along with the Great Recession of 2007–2009, but the performance has been anemic and remains below levels achieved following the Great Recession.
This week sees the February non-farm payrolls. The market is looking for a gain of at least 210,000 jobs vs. January’s 227,000. Watch for January revisions. The unemployment rate is expected to slip back to 4.7% from 4.8%. Watch hourly earnings that are expected to rise 0.3% following a 0.1% rise in January.
(Source)
The Dow Jones Industrials (DJI) soared some 300 points Wednesday following Trump’s speech to congress. Apparently, some $8.2 billion was poured into the SPDR S&P 500 ETF (SPY/NYSE), the highest daily inflow in two years. Snap (SNAP/NASDAQ), the latest social media phenomenon, came to market with its IPO at $17, which was over the expected price of $13/$14. When trading opened the next day, Snap soared 41% above its initial offering price. Demand outstripped supply by 10 to 1. Not bad for a company that lost $515 billion in 2016. Tech/Internet mania circa 1999 is alive and well it seems.
The Investors Intelligence Advisers’ Survey showed that sentiment is at 30-year extremes. For the period ending February 28 sentiment hit 90.4% bulls. But we can only guess. Who cares—the market is going higher and higher. Market Vane’s Bullish Consensus was at 69.4% bulls which matches some earlier extremes. The DJI rose for 12 consecutive days from February 9 through February 27. This was the third longest streak ever, surpassed only by 13 days in January 1987 and 14 days all the way back in 1897. The current streak occurred against the background of negative a/d ratio and more volume on the downside than on the upside.
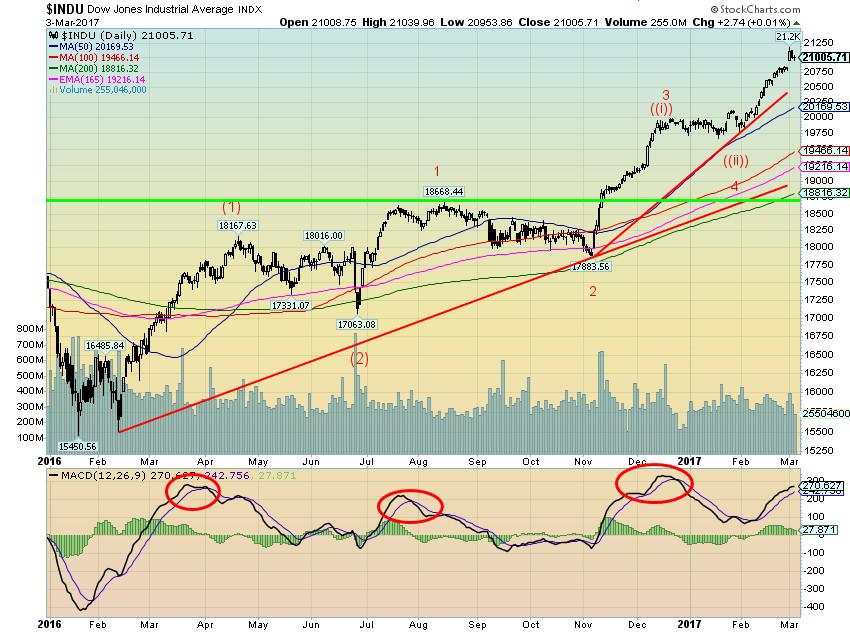
All of this suggests that we are in a rally that could be nearing its end. Is that the end of the bull? Probably not as we continue to believe that this is a third wave up. Once the fourth wave is complete which could last a month or two then the market should rise in a fifth wave up to new highs, probably sometime this summer.
So how would we know if we have topped? Well, we look back at previous lows on daily, weekly, monthly, and even yearly charts. The last daily low was seen on January 19, 2017, at 19,677. So we would know the daily trend is over if that breaks. On an intermediate trend basis, the last important weekly low was seen also on January 17, 2017, so it might suggest that the intermediate trend is breaking too.
Finally, the last important monthly low was seen back in November 2016 at 17,833, so we know if we break that level the entire wave structure is complete and we should be entering bear market territory. We doubt we will fall that low on any pullback at this time.
Nonetheless, for us and for you, it is easier to suggest that the market is breaking down under 19,700 but the entire uptrend is most likely over with a break of 17,800. For the S&P 500, those numbers are at 2,225 and 2,100 although a break of 2,350 would be a warning sign that something might be amiss.
Otherwise, the trend is up and the DJI could reach as high as 24,000, although there could also be targets up to only 21,800 a level, which we are not far from to complete this up wave.
Most markets hit new all-time highs this past week including the DJI, the Dow Jones Transports (DJT) thus confirming the DJI, the S&P 500, and the NASDAQ. The Russell 2000 small-cap index also made new all-time highs but barely. The Dow Jones Utilities (DJU) did not make new all-time highs.
The markets are becoming frothy and a bump in the road is coming.
(Source)
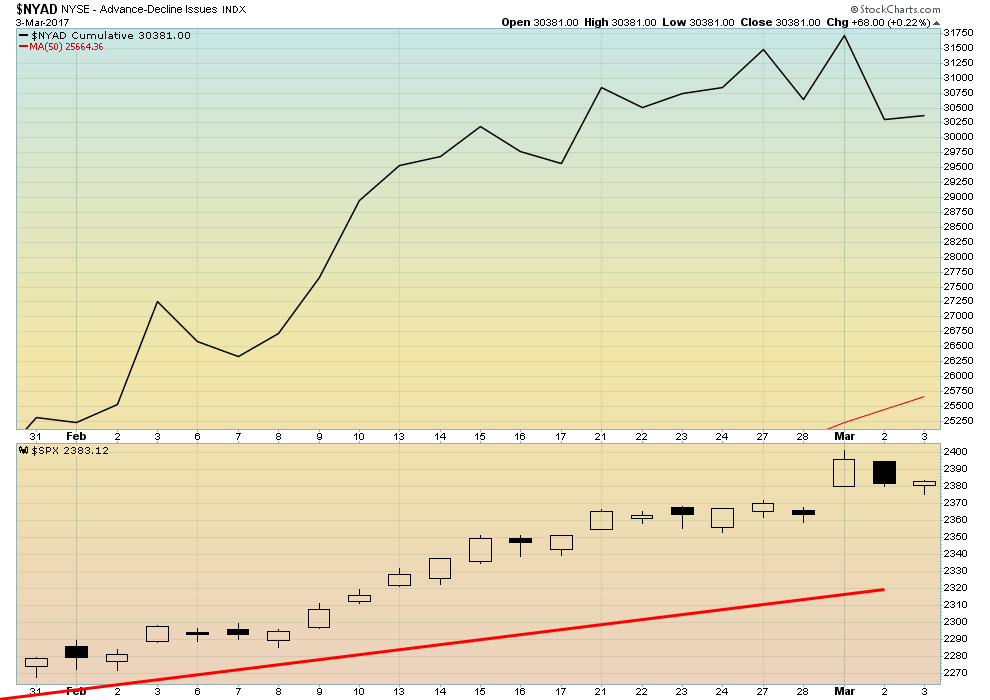
Here is the NYSE advance/decline for the past month. Notice how the a/d line declined through the recent jump in prices to new all-time highs. In the end it may not mean much but it is normally a sign of a fading market as the NYSE a/d diverges with the price action.
(Source)
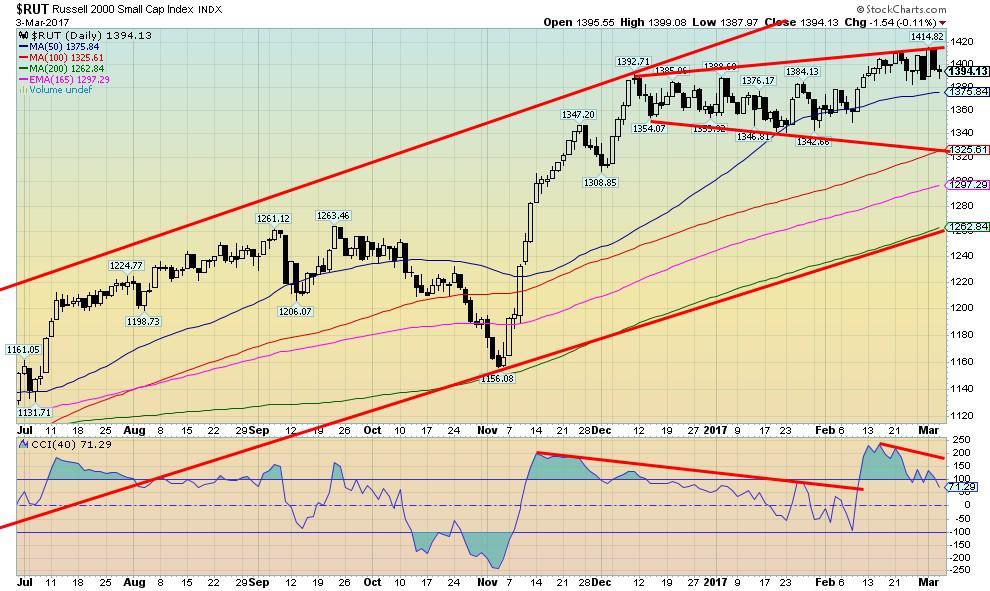
Here is the Russell 2000. RUT appears to be a forming small broadening channel. A decline back to the lower end of the channel could soon be underway. Will that end the bull market? Well, no. That is just a pullback. Under 1,260 would spell some trouble for the Russell 2000, but the index would have to fall back under that November low near 1,156 to signal a possible end to the bull.
(Source)
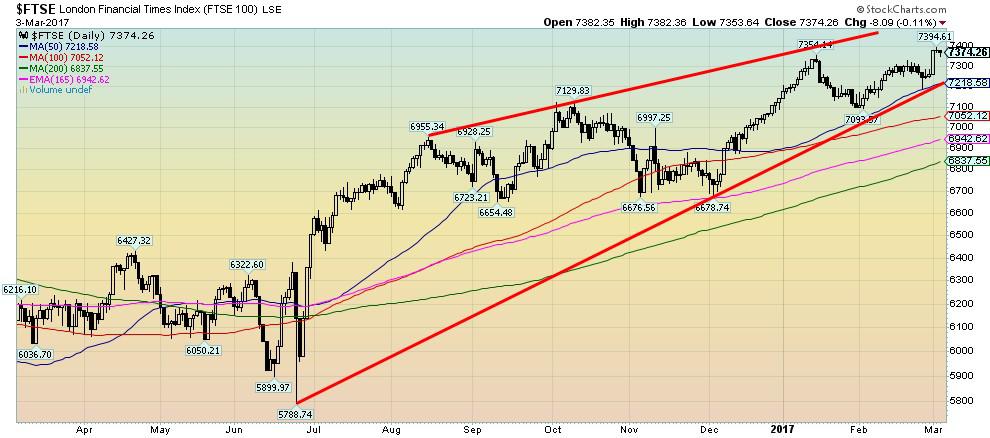
The London FTSE has followed the US markets to record highs. The FTSE joined them this week right on cue following Trump’s speech. But the FTSE appears to be forming a potential bearish ascending wedge triangle. It breaks down under 7,220 and wedge triangles suggest a return from where it started. That’s back to the June low of 5,788, some 21.5% lower.
For the record, the French CAC 40 and the German DAX also made new all-time highs this past week and that is against the backdrop of a deteriorating situation in Greece once again. Note, however, the Tokyo Nikkei Dow (TKN) did not join the all-time high party (of course, the TKN is nowhere near the 1990 highs but also short of highs seen in 2015), and finally the Shanghai Stock Exchange Composite (SSEC) failed to make new highs, instead making a lower high and then it turned down.
(Source)
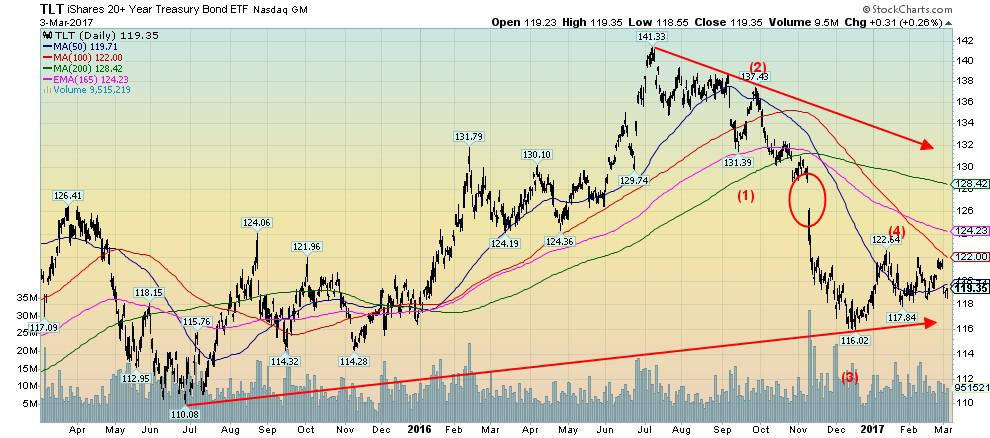
The iShares 20-year Treasury Bond ETF (TLT/NYSE) gapped lower this week following Trump’s speech. The stock markets may have loved his speech but bonds did not. Then Fed Chair Janet Yellen threw gasoline on the fire suggesting a potential rate hike at the March FOMC. It appears what we thought was a fourth wave correction is now complete and the TLT should fall to make wave 5 to the downside.
Potential targets are down to 109/110 which would roughly coincide with the lows of June 2015. As we have noted before, the last six-year cycle low was seen in 2013. The current six-year cycle appears to be unfolding in three cycles of two years. A low here in 2017 would line up nicely with the 2015 low. The third and final low to complete the six-year cycle would be seen in 2018 to 2020 centered on 2019. If the return wave to the upside fails to make new highs above 141.33 seen in July 2016 it could also signal the end of what has been a long and incredible bull market in bonds.
(Source)
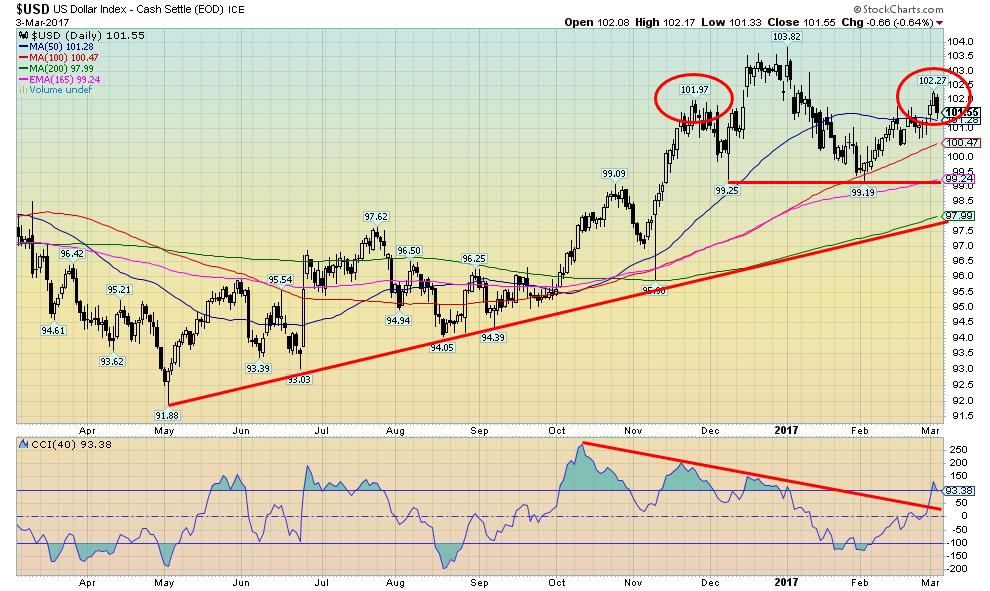
Trump’s speech to congress, coupled with Janet Yellen’s musing about a rate hike at the March FOMC spiked the US$ Index higher this past week. At a high of 102.27, the US$ Index took out what we thought might be the left shoulder of a potential head and shoulder topping pattern. We will give this pattern a little more room but if we rise above 102.50 the odds definitely favor that the H&S pattern is dead and the US$ Index is most likely headed to new highs. Naturally, we have to take out the January 3, 2017, high of 103.82. Targets remain up to 106/108.
Only a return back under 100 and especially a breakdown under 99 would suggest that a significant top for the US$ Index is in with the potential to fall to at least the 94/95 zone.
(Source)
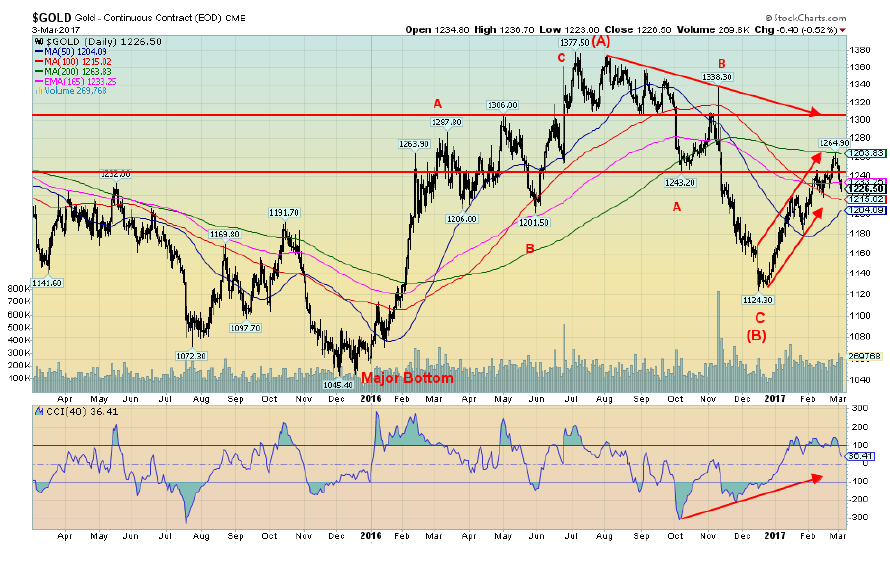
Trump’s spending plans addressed to congress and Janet’s musings of higher interest rates as we have noted sent the stock markets soaring, bond yields rising, the US$ Dollar up, and gold down. Gold fell 2.5% on the week while silver was off 3.6%. The gold stocks were especially hard hit with the Gold Bugs Index (HUI) down 7.1% and the TSX Gold Index (TGD) off 5.4%. The result is that the recent uptrend has weakened and it turned the daily trend down for the two gold indices. Note that gold ran right into the 200-day MA with the high of $1,264.
Gold fell to a low of $1,223 before reversing on Friday and the cash market rose to $1,234 roughly $8 above the futures close of $1,226. This bodes positively for gold come Monday morning. With the decline to $1,223, gold prices were barely above the low of $1,217 seen on February 15, 2017. It is possible that what we have been seeing is an irregular running correction. That would explain a run to new highs for the move at $1,264 followed by a decline right back towards the February 15 low of $1,217. This scenario only holds as long as the $1,217 low holds. The 100-day MA is at $1,215. That level should hold as well. If those levels break then we are looking at a steeper correction and a possible decline to $1,190/$1,200. If somehow that level were breached then final major support comes in at $1,175/$1,180.
Gold needs to return back above $1,245 to suggest that the correction is over. Nonetheless, we view all this action as corrective only and once we find a low, gold should embark on a move towards $1,300. Note this weekend sees the start of PDAC and gold stayed true to form by topping just before PDAC. But all of this also appears to be us a classic sell the rumor, buy the news. The rumor is, of course, that the Fed will hike rates with the news well they did but so what. If the Fed doesn’t hike rates at the March 14/15 FOMC then gold could soar.
(Source)
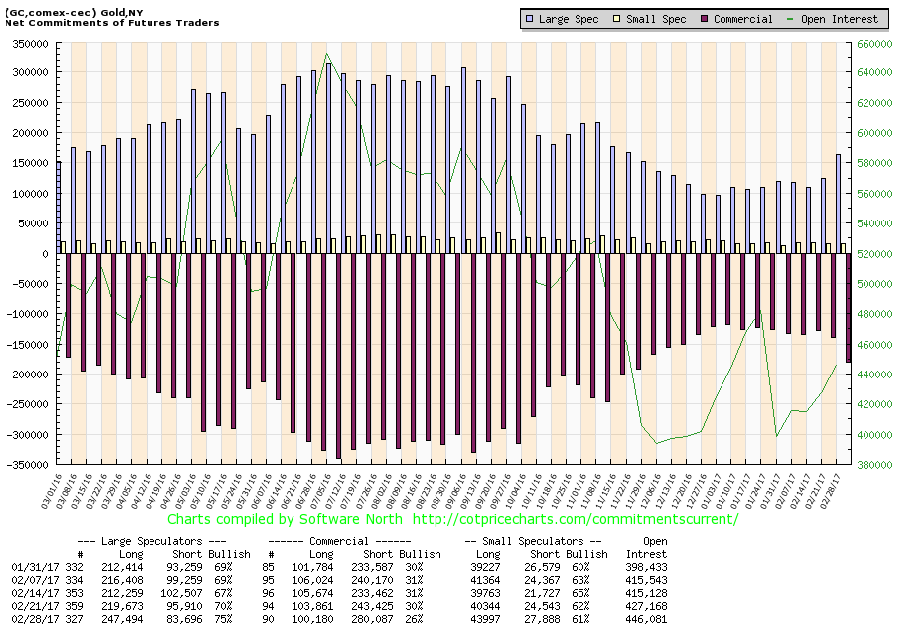
Maybe it is no surprise that the commercials are once again getting short. The commercial COT is nowhere near the levels seen from June 2016 onward to October 2016, so in theory, at least gold prices could move higher even as the commercial COT moves lower. This past week’s commercial COT was at 26%, down from 30% the previous week. Short open interest jumped roughly 37,000 contracts while long open interest fell about 4,000 contracts. Over at the other side were the large speculators (hedge funds, managed futures, etc.) as their COT rose to 75% from 70%. Long open interest jumped about 27,000 contracts while short open interest fell about 12,000 contracts. The COT has become mildly bearish, but is nowhere near levels that would suggest a steeper decline at this time.
(Source)
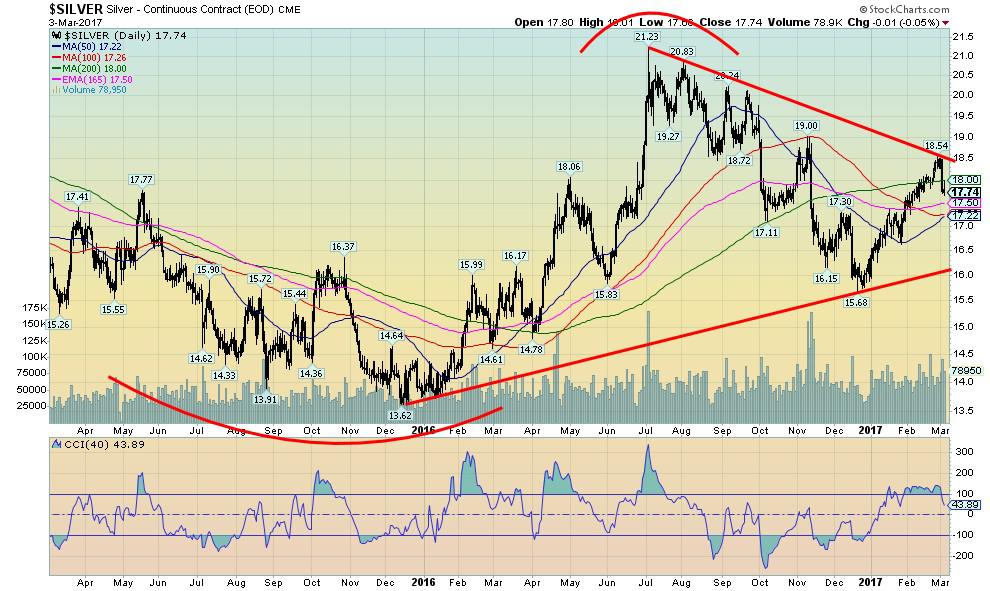
Silver prices retreated sharply this past week following its breakout above $18 and hitting a high of $18.54. The retreat was sharp as silver prices fell right back below $18. As with gold, silver rallied following the close of futures closing just below $18. Like gold, silver’s correction may not yet be over. The uptrend has weakened considerably. If silver is pressured lower again potential targets could be $17.00/$17.20 and even down to $16.60. Major long-term support is seen at $16. Silver needs to take out $18.50 to suggest that the correction is over. As with gold, silver prices should rise further. Potential targets are up $24 once silver takes out the July 2016 highs of $21.23.
(Source)
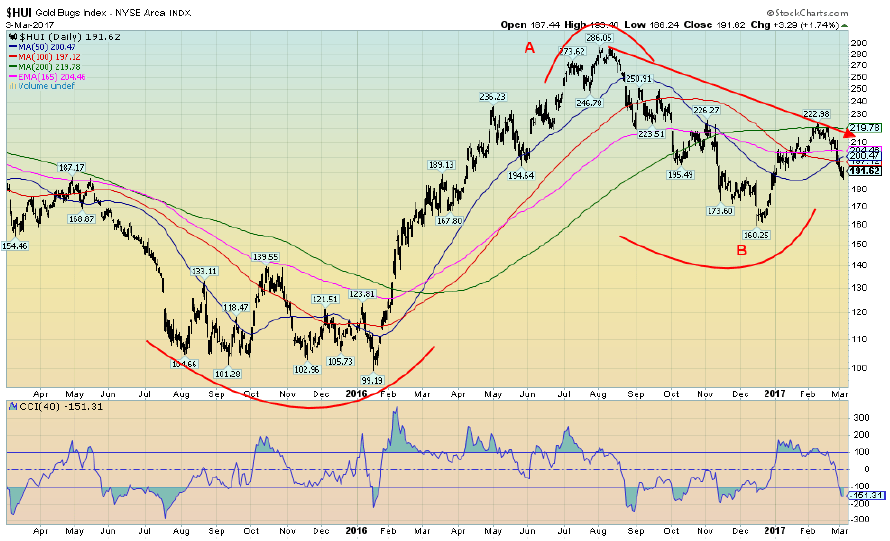
The gold stocks took it on the chin this past week with a sharp 7.1% drop for the Gold Bugs Index (HUI). Indicators have quickly fallen to weak levels. The HUI also fell under the 200-day MA. Numerous sell signals were seen. Despite the pullback, sharp as it was, it is doubtful that the gold stocks are poised for a major drop. Nonetheless, gold stocks could be pressured lower if gold and silver prices were to fall further. Nevertheless, like gold and silver the HUI rebounded on Friday after being lower earlier managing to close 1.7% higher on the day. Indicators are falling but are not yet at extremes. Sentiment indicators are in neutral territory. There should be good support in the 170/180 zone. A test of the zone would not be a surprise. We might have been able to make an argument that a head and shoulders bottom might be forming, but the HUI fell below what might have been the left shoulder. Regaining above 210 would be positive and suggest that a run to new highs might be underway. Note that as with gold that the HUI hit the 200-day MA and fell back.
Our expectations on the precious metals are that a low should be in place by the time of the March FOMC March 14/15. A rise should then take place that takes us into April and possibly into May before another correction takes place.
GLOSSARY
Trends
Daily – Short-term trend (For swing traders)
Weekly – Intermediate-term trend (For long-term trend followers)
Monthly – Long-term secular trend (For long-term trend followers)
Up – The trend is up.
Down – The trend is down
Neutral – Indicators are mostly neutral. A trend change might be in the offing.
Weak – The trend is still up or down but it is weakening. It is also a sign that the trend might change.
Topping – Indicators are suggesting that while the trend remains up there are considerable signs that suggest that the market is topping.
Bottoming – Indicators are suggesting that while the trend is down there are considerable signs that suggest that the market is bottoming.
—
DISCLAIMER: This article expresses my own ideas and opinions. Any information I have shared are from sources that I believe to be reliable and accurate. I did not receive any financial compensation in writing this post, nor do I own any shares in any company I’ve mentioned. I encourage any reader to do their own diligent research first before making any investment decisions.
Featured Image by Kevin Hutchinson via Flickr / CC BY 2.0


Morocco’s Growth Holds at 4.6% as Agriculture Offsets Economic Pressures
Morocco’s economy grew 4.6% in Q1 2026, driven by a strong agricultural rebound offsetting declines in industry. Services expanded moderately...


Abivax Shares Surge as New Trial Data Eases Safety Concerns Over Ulcerative Colitis Drug
Abivax shares surged nearly 36% after positive updated trial results for its ulcerative colitis drug obefazimod reassured investors following earlier...


El Dorado Raises $9M to Expand Cross-Border Fintech Platform
El Dorado, a Latin American fintech improving cross-border financial services, raised a $9 million Series A led by Paradigm with...


Bitcoin Stalls Near $60K as Strategy Moves, ETFs Outflow, and EU MiCA Rules Take Effect
Bitcoin hovers near $60,000 with ETF outflows, while Strategy boosts reserves, sells BTC, and raises dividends to reassure investors. Ethereum...


Cannabis Dominates Global Drug Use: Trends, Risks, and Shifting Markets
Cannabis remains the world’s most widely used illicit drug, with 256 million users in 2024, surpassing all others combined. Growth...
 |
|
 |  |
 |
|
-

 Business1 week ago
Markets Diverge as Oil Falls, Rates Hold, and Inflation Persists
-

 Impact Investing6 days ago
Coastal Cities Lead as Heat Strains Italy’s Urban Livability
-

 Fintech2 weeks ago
Trade Republic Brings Back Human Support and Launches Customer Council
-

 Biotech2 days ago
Eli Lilly Hits $1 Trillion Valuation Amid Strong Bullish Momentum
You must be logged in to post a comment Login