Business
Dow Jones Near Highs Amid Low Volatility but Caution Signals Emerging
The Dow Jones recently closed near record highs after only a mild 10% correction, suggesting market strength. However, a few large daily gains signal rising volatility, often seen in bear markets. While current volatility remains low, indicating no immediate crash, conditions may reflect a market top, making this a cautious time rather than bullish expansion.

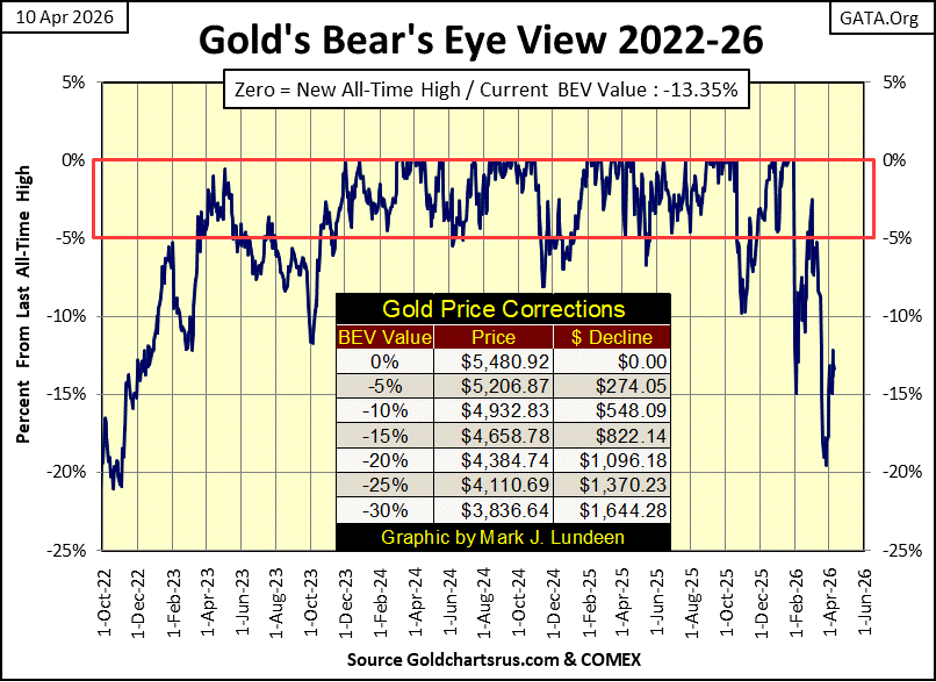
Recently, we’ve looked at the Dow Jones not just as a market indicator, but as an indicator for political, and global events. As far as using the Dow Jones as an indicator for the market, this week on Thursday and Friday’s close, it closed inside scoring position, with BEVs of -3.99% and -4.53%, both daily closes within 5% of its last all-time high.
Let’s not make any rash decisions based on only two daily closings. But the current low of the move, a BEV of -10.01% on the close of March 27th, was only ten NYSE trading sessions ago. A correction of only 10% from an all-time high, isn’t much of a correction.
Looking at the Dow Jones BEV chart below, the market certainty decided a 10% correction was quite enough, when it began moving back up to scoring position at this week’s close. The Dow Jones could easily be making new BEV Zeros (new all-time highs) before April is behind the market.
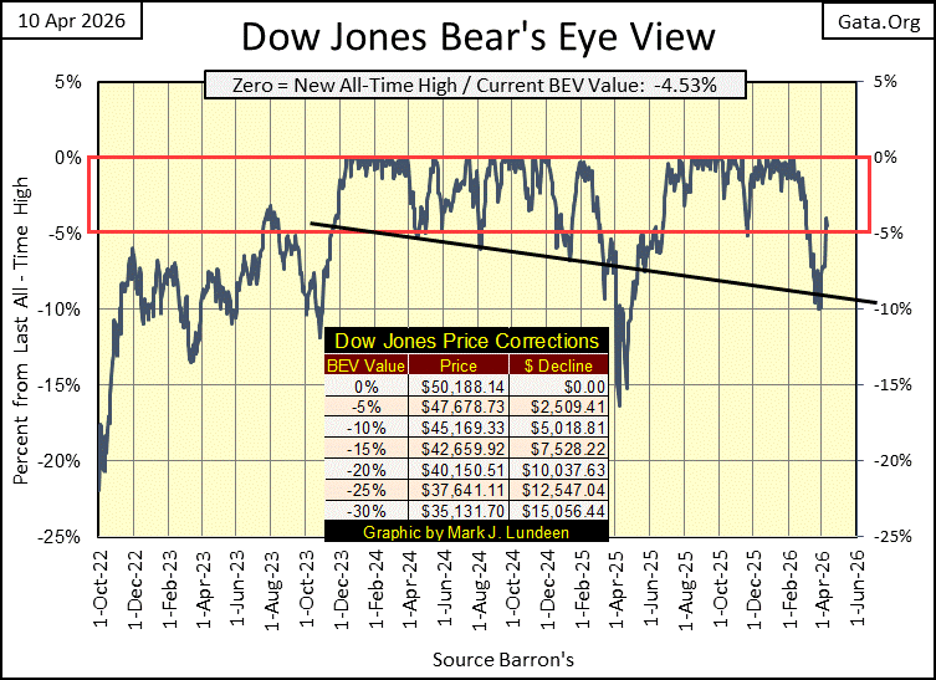
One item concerns me. Last week, and again this week, the Dow Jones saw days of extreme market volatility, days the Dow Jones moves +/- 2%, or more from a previous day’s close;
• 31 March 2026 = +2.49%,
• 08 April 2026 = +2.85%.
Though both of these 2% days were positive days, they were nonetheless days of extreme volatility. Should someone want to see the Dow Jones’ largest daily advances, look at the big bear markets. It’s during the big market declines, where one will find days the Dow Jones has – Advanced – by 10%, and more from a previous day’s closing price.
Most likely, these two days of extreme volatility are much to do about nothing. But, if Mr Bear is leaving us with his calling cards, we’ll soon see additional Dow Jones 2% days, both to the up, and downside. And the volatility during these 2% days, will move the Dow Jones from one day, to the next, by something above 3%. The Dow Jones itself will soon deflate below its BEV -10% line, and not return to scoring position anytime soon, as it has these past two weeks.
What I said above is what will happen – IF – something big, bad, and bearish is about to happen. But, should we expect a big bear market coming in the next few months? I’m not, unless we continue seeing additional Dow Jones days of extreme volatility; Dow Jones 2% days.
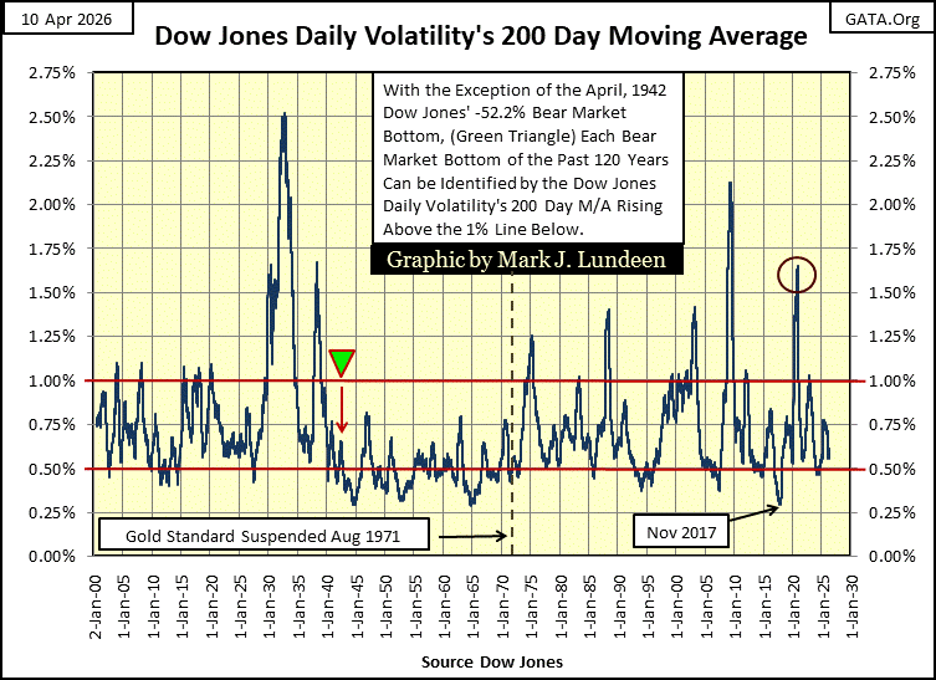
It’s Dow Jones 2% days, and plenty of them, that drives Dow Jones daily volatility’s 200D M/A seen below, way up above its 1.00% line. The Great Depression crash drove this plot up to its 2.50% line. The second bear market bottom of the depressing 1930s; 1937 to 1938 sent daily volatility up to, and over its 1.50% line.
In the chart below, every significant bear market bottom of the past century, Dow Jones market declines of 40%, and more, can be identified as a volatility spike. With daily volatility currently so low, I’m not concerned about a big bear market any time soon. But its fair saying with our current low volatility, we are at, or near a market top.
Here is the key to understanding bull and bear markets of the past century, as seen below;
• bear markets – volatility rising from the 0.50% line to a peak, the higher the peak in volatility, the deeper the bear market,
• bull markets – volatility decays from a peak in volatility, down to the 0.50% line.
Using the Dow Jones daily volatility’s 200D M/A data seen below, this isn’t a time to be adding to bullish market positions. Rather, this is a good time to take some money out of the market, and keeping it out, until the next big spike in volatility peaks, and begins to decay, as it has so many times before.
About using the Dow Jones for an indicator of global events, say like the current strikes against the Islamic Republic by the Trump Administration, seeing the Dow Jones, and the stock market as a whole do so well since bombing began in late February, can be seen as the market arguing in favor of a positive resolution in favor of Trump, and the Republican in this year’s mid-term elections in November. Or so I read these tea leaves.
But the bombing isn’t over, and the Straits of Hormuz remains closed to shipping. So, based on what the Dow Jones has done since late February, I’m not inclined to commit myself to how this action against Iran’s Islamic Republic will finally resolve itself, and its ultimate impact on the stock market. But I’m optimistic.
However these strikes against the Islamic Republic finally resolves themselves, the world owes Trump a lot of gratitude for removing the menace of a nuclear armed Ayatollah in the Persian Gulf. Though I’m not foolish enough to believe Trump will receive the recognition he deserves from the media, academia, and others, until after he has long passed away.
For forty years, every president admitted the danger of Iran’s nuclear program, and then did absolutely nothing about it. Thank God Trump is made of sterner stuff.
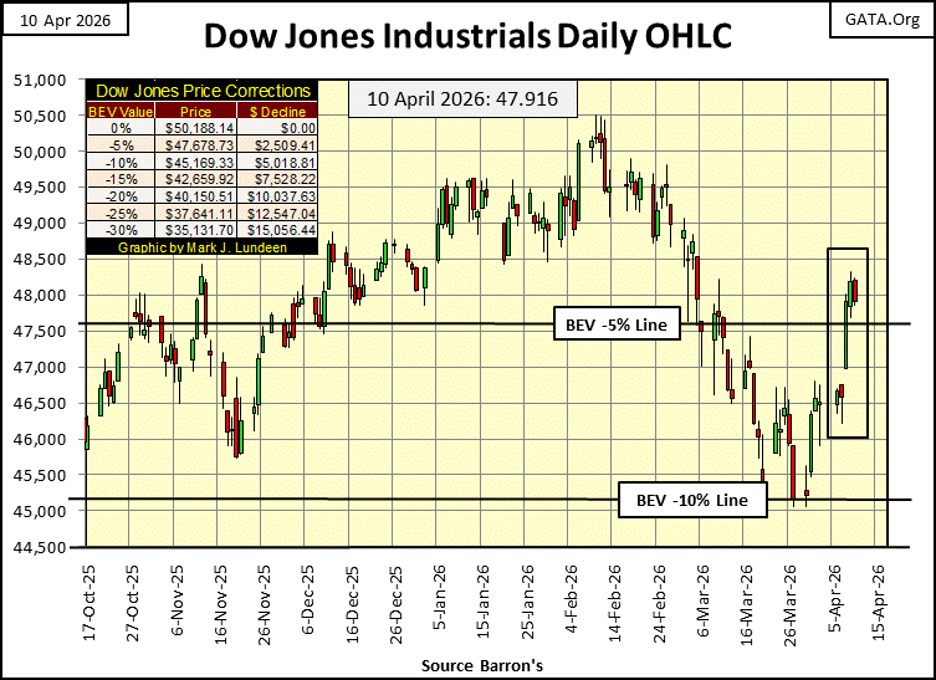
Here is the Dow Jones in daily bars. Below, we see the two Dow Jones 2% days of the past two weeks, and the nice bounce off the BEV -10% line. The Dow Jones looks very bullish, and I’m inclined to think we’ll soon see it trading above its last all-time high of 50,188.14 sometime in the next few weeks. I’ve been wrong before, but there were times I’ve also gotten it right. Time will tell all.
In my table for the BEV values of the major market indexes I follow below, on Wednesday and Thursday, we see three new BEV Zeros. This table has been free of new all-time highs for a few weeks now, but not this week.
On Monday, only five of the twenty indexes closed in scoring position, within 5% of their last all-time high. Friday may not have given us a new BEV Zero, but note that thirteen of these indexes close the week in scoring position, inside the Red Rectangle. Seeing all these indexes inflate into scoring position by Friday this week, is a good indication of underlying market strength, and a good reason to be short-term bullish on the market.
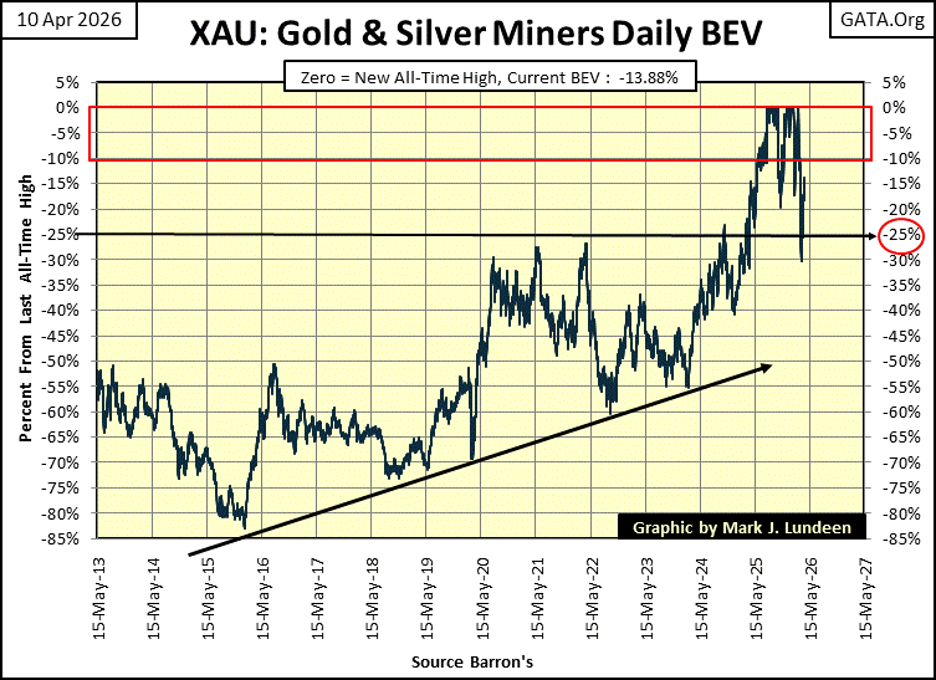
For all the nice things I’ve said about the market this week, I still don’t like this market. So, what do I like? I like gold and silver bullion, and the precious metal miners, the XAU way down at #19 in the table below. But, isn’t this table’s #19 spot reserved for losers in the market, and you still like the XAU? Well, yes.
Keep in mind, investors should strive to; BUY LOW, and SELL HIGH. But the only way to buy low, is to buy what most people are willing to sell, at their loss. So, buying low, implies you’re exchanging your cash, for someone else’s trash.
And to sell high, one must sell when everyone else wants to buy. Which is difficult psychologically; to see something as trash, what so many others are willing to pay top dollar for. So, I don’t have a negative bias on the XAU, just because most people still don’t recognize gold and silver mining as the next big thing in the stock market.
Look at the XAU’s BEV chart below. From its last BEV Zero on February 27th, it deflated below its BEV -30% line on March 20th, fourteen trading days ago, and hasn’t been below it since. What the XAU has done in the past three trading weeks, is advance by 23%. No other index has inflated by 23% in the past three weeks. Not bad for a “loser” that closed this week at #19 in the table below.
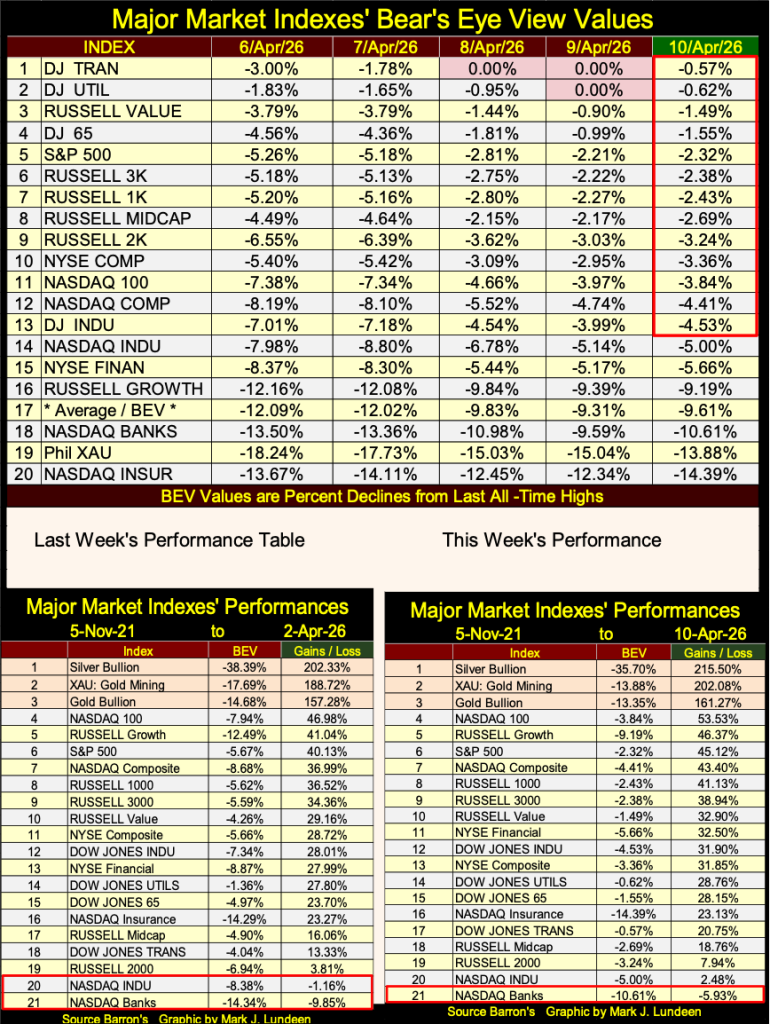
How many months has it been, where gold and silver bullion, and the XAU have been in the top three spots in my performance tables above? Since last April, as seen in the table below. Even following their corrections of 2026, gold, silver bullion, and the XAU’s performance in the past year have been specular!
And their gains since November 2021, have been tripled of the stock market’s best performing index, which currently is the NASDAQ 100, at #4 above.
One of these days, professional money managers, and the investing public will finally recognize, what they have failed to see for so long; a massive bull market in the old monetary metals, and their miners. We’ll know to the day when that becomes a reality; when valuations in gold, silver and the XAU, see a one day +10% price spike.
I continue seeing advertisements for credit cards, promoting the advantage of using this, or that card on what must be an expensive vacation somewhere in an exotic location. If someone used their card to finance such an extravagance, and had the means of paying off the debt when the bill came in the mailbox, well good for them.
But obviously, this advertisement program is targeting people who don’t have the means to payoff this debt at the end of the month, or in a couple of years. These companies issuing credit cards, are offering large lines-of-credit to anyone willing to entangle themselves with it, and they don’t care who does, or what they use this credit for.
As long as their victims service their debt’s minimum monthly payment, from the day they first enrolled in some worthless college, for four years of Leftist nonsense (also financed with credit from the FOMC), to the day they die, it is fine with the banking system.
But the future prospects for a debt slave to the Federal Reserve System are not attractive. A lifetime of work and denial, to pay off the frivolous debts assumed in one’s youth.
Credit cards, as well as the school loan, and the home mortgage programs are actually abusive uses of credit provided by the bunch of idiots at the FOMC;
• credit cards enable consumers to use credit to fund consumption beyond their means,
• school loans routinely fail to provide an appropriate return on investment in “education,” for most college students, and everyone in banking and academia knows it,
• mortgage creation funds price inflation in the housing market.
The impact the mortgage program spreads beyond the buyer and seller of a home. The inflated housing prices provide the basis for local government to fix residential property taxes. Speaking for myself, I purchased my home in 1996 for just under $50,000, but my home was built in 1910 for $500.
I recall my property taxes for the first year I occupied my home was something like $700 a year. Thirty years later, I’m now living in a $184,000 estate. But only for as long as I can pay my $2,653 in property taxes to the county, will the county’s commissioners allow me to live here. Happily, I can. But am I really a “home owner?” I’m looking around my neighborhood, and I know more than just a few of the aging grey-hairs living nearby, living on fixed income, are struggling.
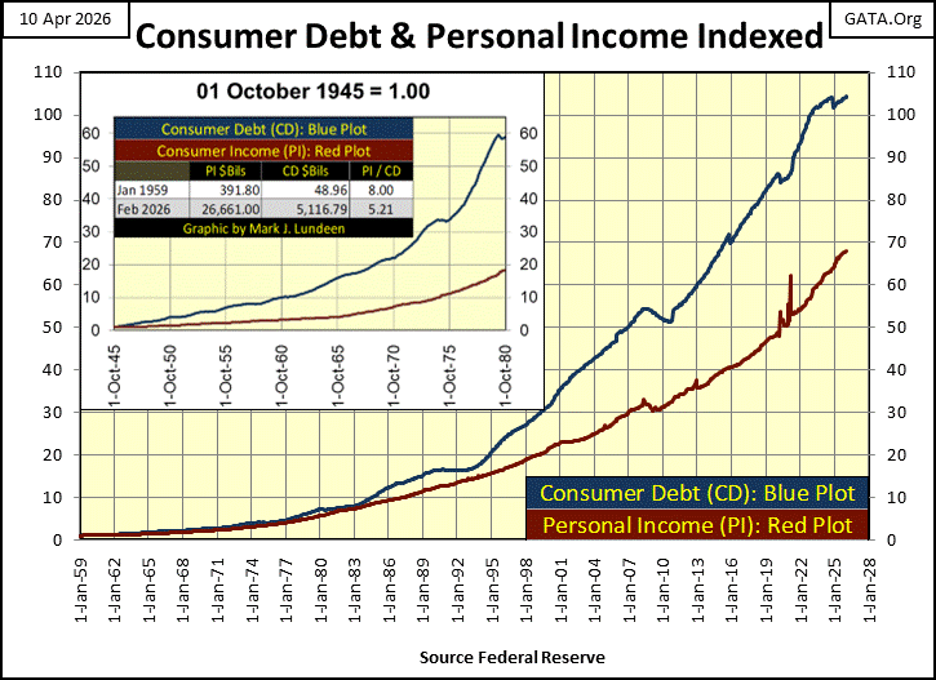
Let’s take a look at consumer debt, credit supplied from the FOMC, and personal income, the means consumers use to service their obligations to the Federal Reserve System. Latest data February 2026.
Since the US Dollar was decoupled from its $35 gold peg in August 1971, personal income (Red Plot) has increased by a lot, see chart below. But not as much as the debts consumers have taken on. For the bankers, this was most likely the entire point of removing the dollar from a gold peg, as doing so allowed them to increase credit creation, and their profits immensely.
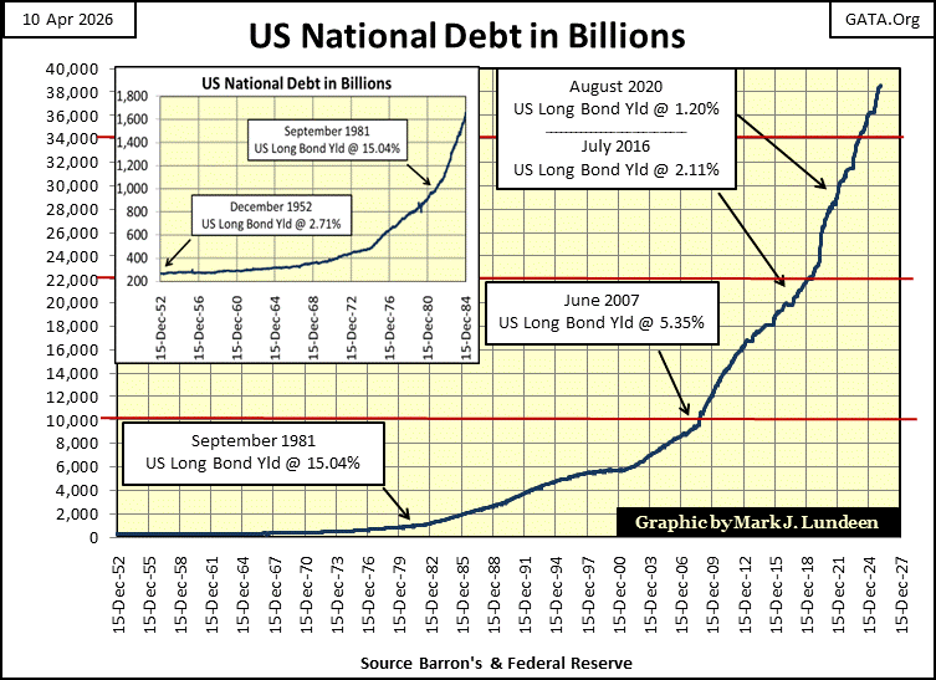
Personal income seen above, isn’t only used to service consumer debt, but the debts of the Federal Government too, the national debt seen below. In light of the fraud of government funding recently seen in California and Minnesota, we should ask ourselves; how much of the $38 trillion dollars the Federal Government has taken on in the name of the American taxpayer, was used to fund fraudulent the so-called “NGOs” Non-Government Organizations?
I believe a lot of it. Exactly how many trillions seen below were diverted to fraud, waste, and abuse, we’ll never know, until the Justice Department does an extensive forensic investigation on the Treasury Department. Which you should realize, the Congress would never allow. This suggests our Congress really is the best Congress money can buy, and much of the money used to buy them, came from the American Taxpayers.
For the first time since January 1980, silver in 2025-26 was making new all-time highs in its BEV chart below. Its last all-time high, or BEV Zero was $118.45 for an ounce of silver on January 28th. In the two and a half months since its last BEV Zero, the price of silver deflated to below its BEV -40% line. But appears to be on the rebound.
I think the bottom for silver is in. If you recall how investors are to make money in the market; by buying low / selling high. Seeing silver close this week with a BEV of -35.70% tells us silver is low. That few have anything positive to say about silver, is typical of anything else in the market, when it too is cheap.
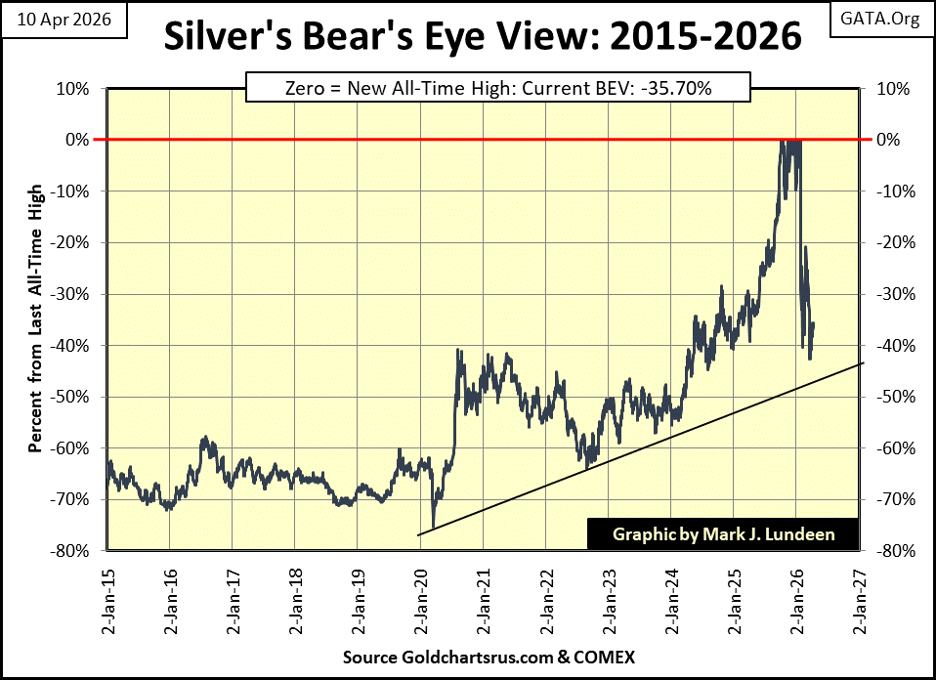
Gold, following its last all-time high on January 28th, corrected down to its BEV -20% line, in its BEV chart below, only half the correction silver has seen so far in 2026. And unlike silver, gold has rebounded nicely off its correction’s lows, as has the XAU. For silver to see a similar rebound, it would have to trading above its BEV -30% above.
Which tells us what? That silver in April 2026, is a better buy than is gold at current prices.
On gold’s side of the step sum table below, we see its correction’s lows on March 26th, where gold almost broke below its BEV -20% line. Since then, gold has picked itself up from this bottom, and hopefully we’ll see gold trading at new all-time highs sometime in the months to come.
I note gold’s daily volatility’s 200D M/A has increased to 1.22%. That would be a big negative for the Dow Jones, but not for gold.
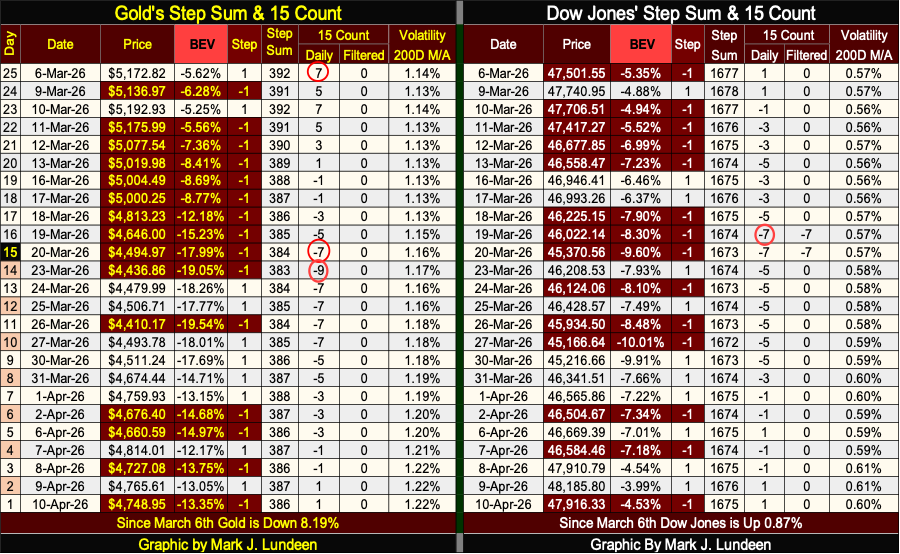
Since the beginning of March, the Dow Jones right side above has seen daily declines overwhelm daily advances, driving its 15-count to a -7, an oversold market. But for all those daily declines, the bears could drive the Dow Jones only down to its BEV -10% line on March 27th. Not all that much when we consider all the tumult and turmoil President Trump has created in Latin America, and the Persian Gulf.
__
(Featured image by Markus Spiske via Pexels)
DISCLAIMER: This article was written by a third party contributor and does not reflect the opinion of Born2Invest, its management, staff or its associates. Please review our disclaimer for more information.
This article may include forward-looking statements. These forward-looking statements generally are identified by the words “believe,” “project,” “estimate,” “become,” “plan,” “will,” and similar expressions, including with regards to potential earnings in the Empire Flippers affiliate program. These forward-looking statements involve known and unknown risks as well as uncertainties, including those discussed in the following cautionary statements and elsewhere in this article and on this site. Although the Company may believe that its expectations are based on reasonable assumptions, the actual results that the Company may achieve may differ materially from any forward-looking statements, which reflect the opinions of the management of the Company only as of the date hereof. Additionally, please make sure to read these important disclosures.


Vexuvo Secures €7.4M to Boost Agrivoltaic and Storage Growth
Vexuvo and the Sella Group have reached 7.4 million euros in total funding to support renewable energy growth. A new...


CAR-T Cell Therapy Induces Remarkable Remission in Patient with Multiple Autoimmune Diseases
A 47-year-old woman with three severe autoimmune diseases received CAR-T cell therapy at a German hospital, achieving one-year remission without...

Markets Rebound Briefly as War Risks and Inflation Persist
Artemis II’s safe return contrasted with failed peace talks, ending hopes of a sustained ceasefire. Markets briefly rallied on optimism,...


Dow Jones Near Highs Amid Low Volatility but Caution Signals Emerging
The Dow Jones recently closed near record highs after only a mild 10% correction, suggesting market strength. However, a few...


The TopRanked.io Weekly Digest: What’s Hot in Affiliate Marketing [LiveChat Affiliates Review]
Quick Disclosure: We’re about to tell you how LiveChat Affiliates run a top-notch affiliate program. And we really mean it....
 |
|
 |  |
 |
|
-

 Biotech2 weeks ago
Gilead Sciences Advances Growth Strategy with Focus on HIV, Oncology, and Innovation
-

 Impact Investing6 days ago
Ortus Secures €97M Green Loan to Expand Solar Portfolio in Italy
-

 Impact Investing2 weeks ago
Italian Unlisted Banks Lag on ESG Sustainability
-
 Business3 days ago
The TopRanked.io Weekly Digest: What’s Hot in Affiliate Marketing [LiveChat Affiliates Review]