Markets
Dow Jones shows no signs of slowing down
Since Monday’s all-time high, the Dow Jones is still holding on to its gains in the face of more declining than advancing days.
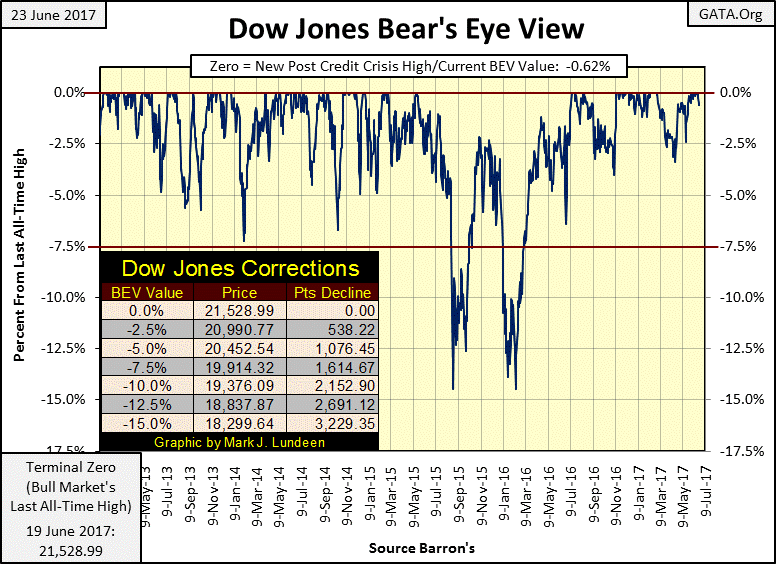
The Dow Jones continues advancing. In the past two weeks, it’s made five new all-time highs in the BEV chart below and ended the week only 0.62% away from Monday’s last all-time high. All and all a darn good performance.
© Mark Lundeen
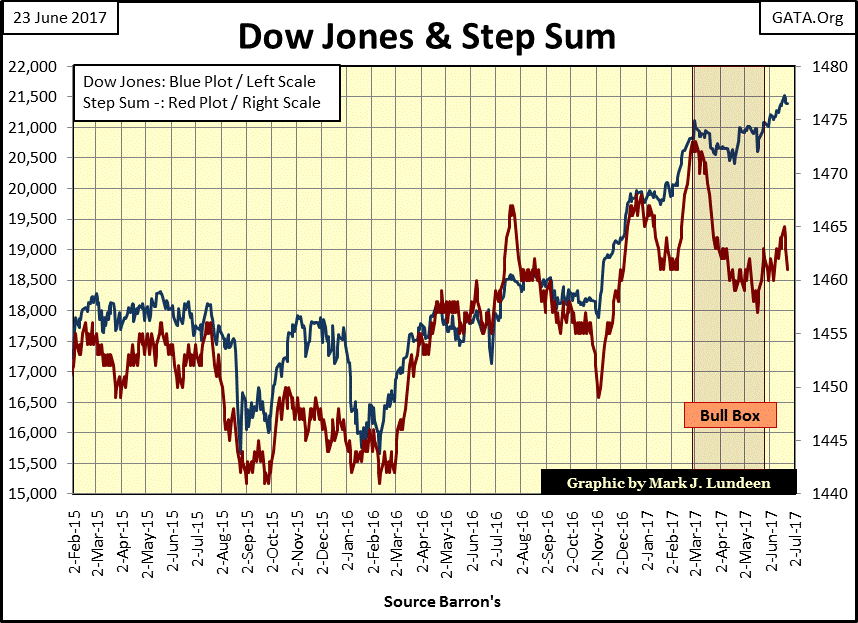
Below we see the bull box the Dow Jones formed is now closed, meaning that in spite of all the net down days in the stock market, the Dow Jones went higher anyway, which is typical of bull boxes.
Since Monday’s all-time high, the Dow Jones is still holding on to its gains in the face of more declining than advancing days (declining step sum / Red Plot). The step sum is a sentiment indicator, making the declining step sum an indication of market concern of something around the corner. What could that something be?
© Mark Lundeen
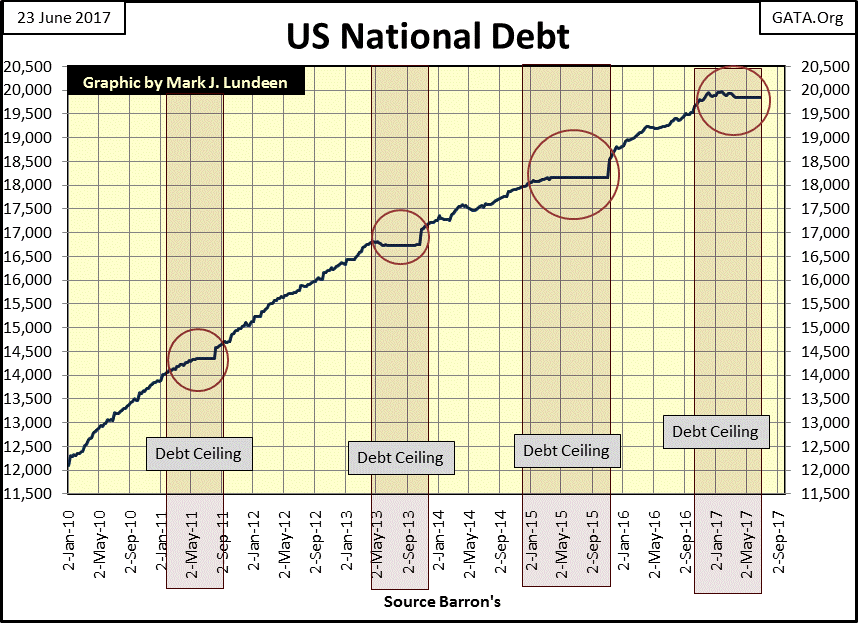
It could be the market’s concern over the pending debt ceiling for the US Treasury in the coming months. Looking at the US national debt in the chart below, it wasn’t difficult identifying the previous three debt ceiling crises; I have them circled as I have our current one.
The national debt flat lines for months as the commentators in the financial media discuss the pending crisis. Then in the last hour before disaster strikes, Congress decides to increase the debt ceiling, thus saving the nation from the impending disaster.
Real kabuki theater stuff; and the producers of the show are charging everyone top dollar to watch this farce.
© Mark Lundeen
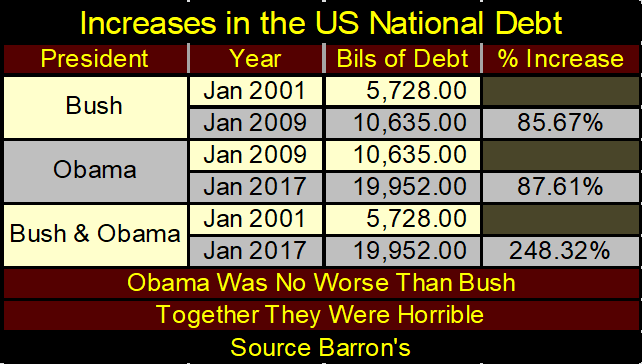
The table below reveals the truth of the national debt. Whether the Republicans or Democrats are in charge of the US government’s budget, it makes little difference. It seems the purpose of the Federal Government is to create debt, and unfunded liabilities in every greater volume that only naive people believe will ever be paid back or serviced in the years to come.
But ultimately, the liabilities created by our political and financial elites in Washington and Wall Street aren’t going to be paid back. How can I say that? I know the history of government. Paul Kennedy, sometime back in the 1990s, wrote a book called “The Rise and Fall of the Great Powers”, a study in the sovereign debt cycle going back a few thousand years.
The only problem I had with Mr. Kennedy’s book, he concluded the United States seemed above this problem – which I’m sure Mr. Bear will ultimately prove to him and everyone else who believes that, that the USofA isn’t.
(Source)
And what is the national debt? It’s only about 25% of the past spending done by the Politicians in Washington. So, since Bush took office in January 2001, the national debt is up by 14 trillion, but Washington has spent 56 trillion, on what? Wars for no good reason and an ever growing bureaucracy regulating honest commerce and spying on the intimate details of private society is all I can see coming from this waste of the public funding.
But no one really knows, or will ever discover exactly where all these trillions in government disbursements have gone. The financial records maintained by the US Government are so irregular that no accounting firm wants to render an opinion on them.
When Standard & Poor’s publically discussed downgrading its credit rating of the US Treasury in the summer of 2011; then President Obama had his Justice Department send their bully boys to investigate. After a careful reconsideration of the facts, the facts special agents Mugs and Knuckles pointed out to S&P’s credit analysis concerning the creditworthiness of the United States Government, S&P verified the solid AAA rating of US Treasury’s debt, and no one has doubted it since.
There’s no mystery why no accounting firm wants the contract to audit the financial affairs of the US government, it would be a dangerous job to volunteer for. It might actually be the case that the mafia keeps better books than does the US government, and the political establishment, like the mafia, intends on keeping it that way.
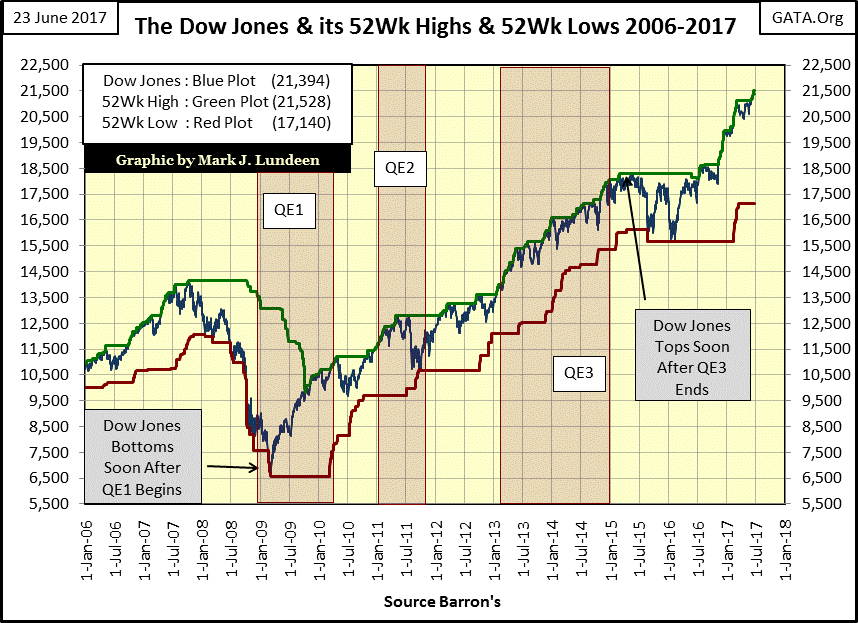
I have a lot of sympathy for President Trump, who after six months in office still hasn’t discovered the vastness of the swamp he promised to drain. But why should we care as long as the Dow Jones continues making new 52Wk highs in the chart below?
© Mark Lundeen
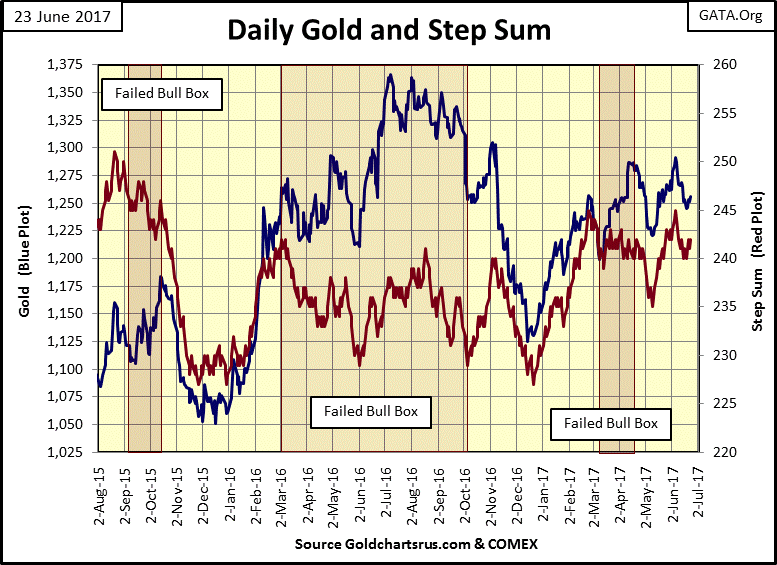
Currently, gold is only a four letter word describing tedium. But considering everything, it’s actually doing better than what it could be doing. Remember, the big NY banks are allowed by the CFTC to short as many phantom tons of gold and silver as is necessary to prevent the old monetary metals from appreciating like bitcoin has in the past few years.
Yes, gold did decline down below its 1250 line in the chart below. However, I’m sure the “policy makers” wanted it to break below the critical 1225 level, which so far it hasn’t, and I don’t expect it will. If you’re looking for a reason to buy some bullion, or invest in the mining shares, this or the pending debt crisis coming this autumn is as good as any other reason to do so.
(Source)
I watch the markets every day. But I don’t take what I see too seriously as I know the most important factor in every market is what the “policy makers” require of them to maintain the fictions of a “growing economy”, and the creditworthiness of the Federal Government.
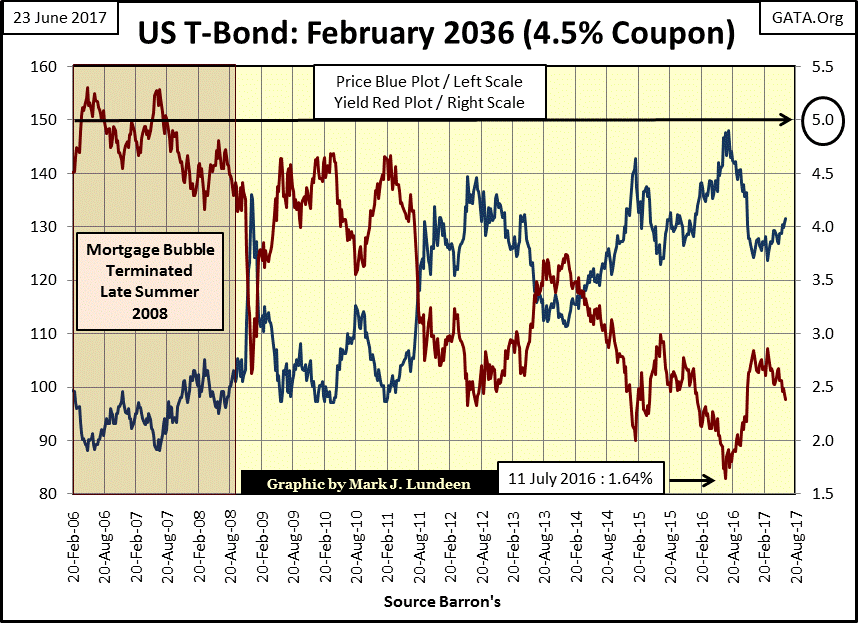
Look at this 30 Yr. T-Bond issued in February 2006. It has a coupon of 4.5%, but its current yield at the end of the week is below 2.5% (Red Plot / Right Scale). In the past eleven years, the US Treasury has increased the issuance of T-debt by 11.6 trillion dollars, a 141% increase in the national debt. And after all that this bond’s current yield eleven years later is 200 basis points below where it was issued in 2006? Not in my world. But I don’t live in my world, a world where the government that governs least governs best.
I live in a world where bond rating agencies are bullied by the world’s largest debtor, a world where governments encourage their central banks to fix bond prices and yields by debauching the currencies they are chartered to protect. In this world, if you say anything against the status quo, the financial mainstream media calls you out as a conspiracy theorist.
© Mark Lundeen
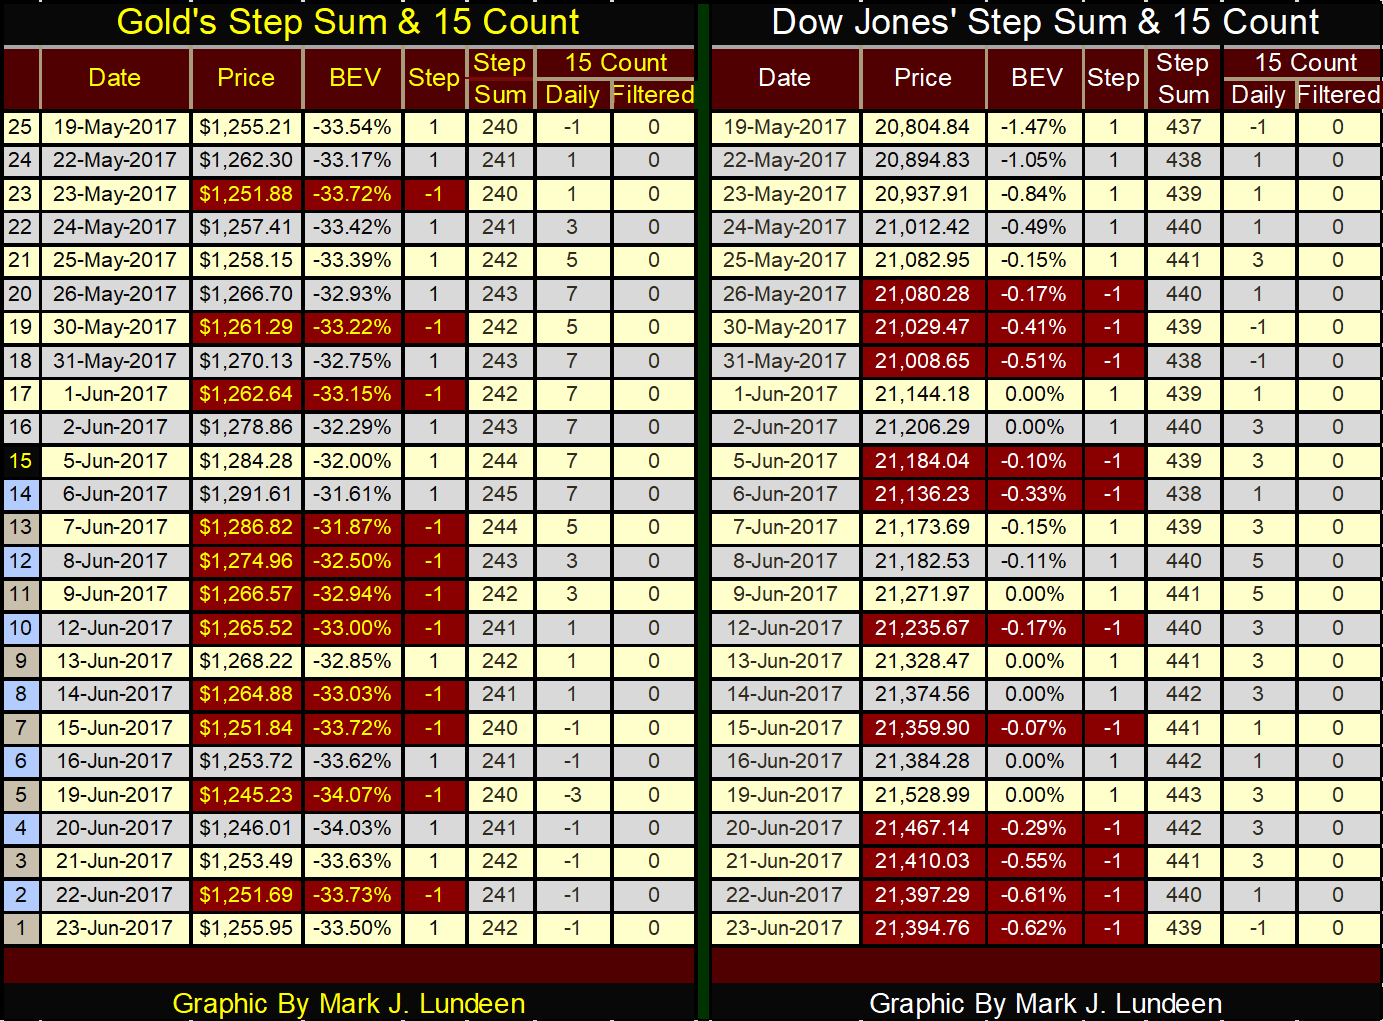
Let’s look at gold’s and the Dow Jones’ step sum and 15 count tables below. This is interesting; gold in the past 25 trading days (five trading weeks) has made a round trip from $1255 to $1291 (day 14) and back to $1255. That didn’t make the bulls happy, but the bears can’t be pleased with that either.
© Mark Lundeen
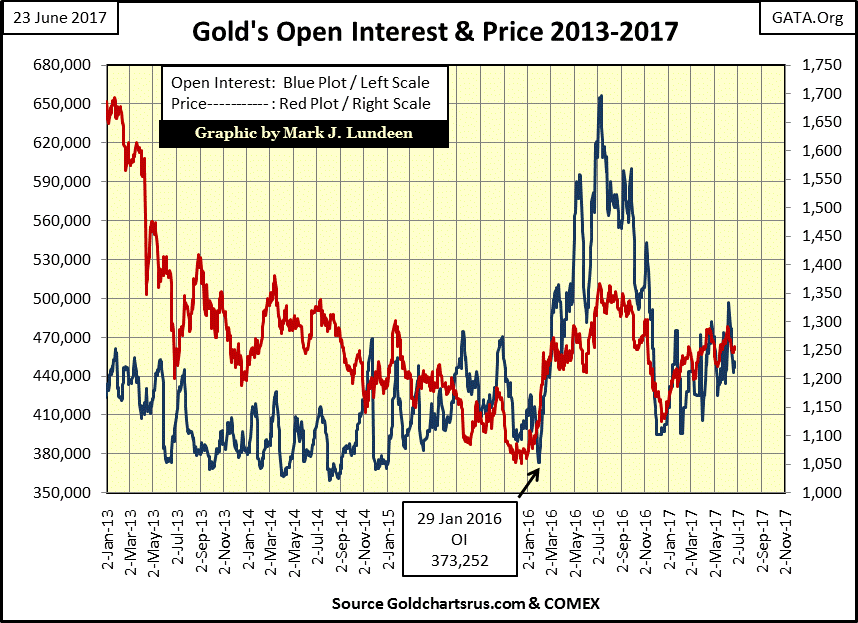
Here’s gold and its COMEX open interest chart. Open interest (Blue Plot) being the number of 100-ounce contracts trading in the gold futures market. Last summer when gold threatened to break above $1400, the big banks flooded the futures market with promises to deliver gold that didn’t exist to blunt the advance in the price of gold. But so far this year, in the current advance, they haven’t done that – yet.
Maybe they are afraid too for fear of what they see coming, as being short in a rising market is bad for even the big banks.
© Mark Lundeen
Moving on to the Dow Jones in the table above; until Tuesday of this week advancing days outnumbered its declining days. Then for the rest of the week, the Dow Jones only closed lower. If you review the Dow’s step sum chart the big decline in the step sum is very apparent, but for all that the Dow Jones only lost 0.62% from its last all-time high of only five days ago.
What should we make of this? Simple; whenever there’s a difference in opinion between the trends in a price and its step sum plot, as currently exists with the Dow Jones, go with the price trend. I expect we’ll continue seeing the Dow Jones making new all-time highs in the weeks to come until we see the price plot breakdown with its step sum plot.
But so far hasn’t happened, and it may not until we see a big down day in the Dow Jones, a closing that’s 2%, or more from a previous day’s closing price. At the Dow Jones current valuation, that would be a day that closed down by 428 points from a previous day’s close.
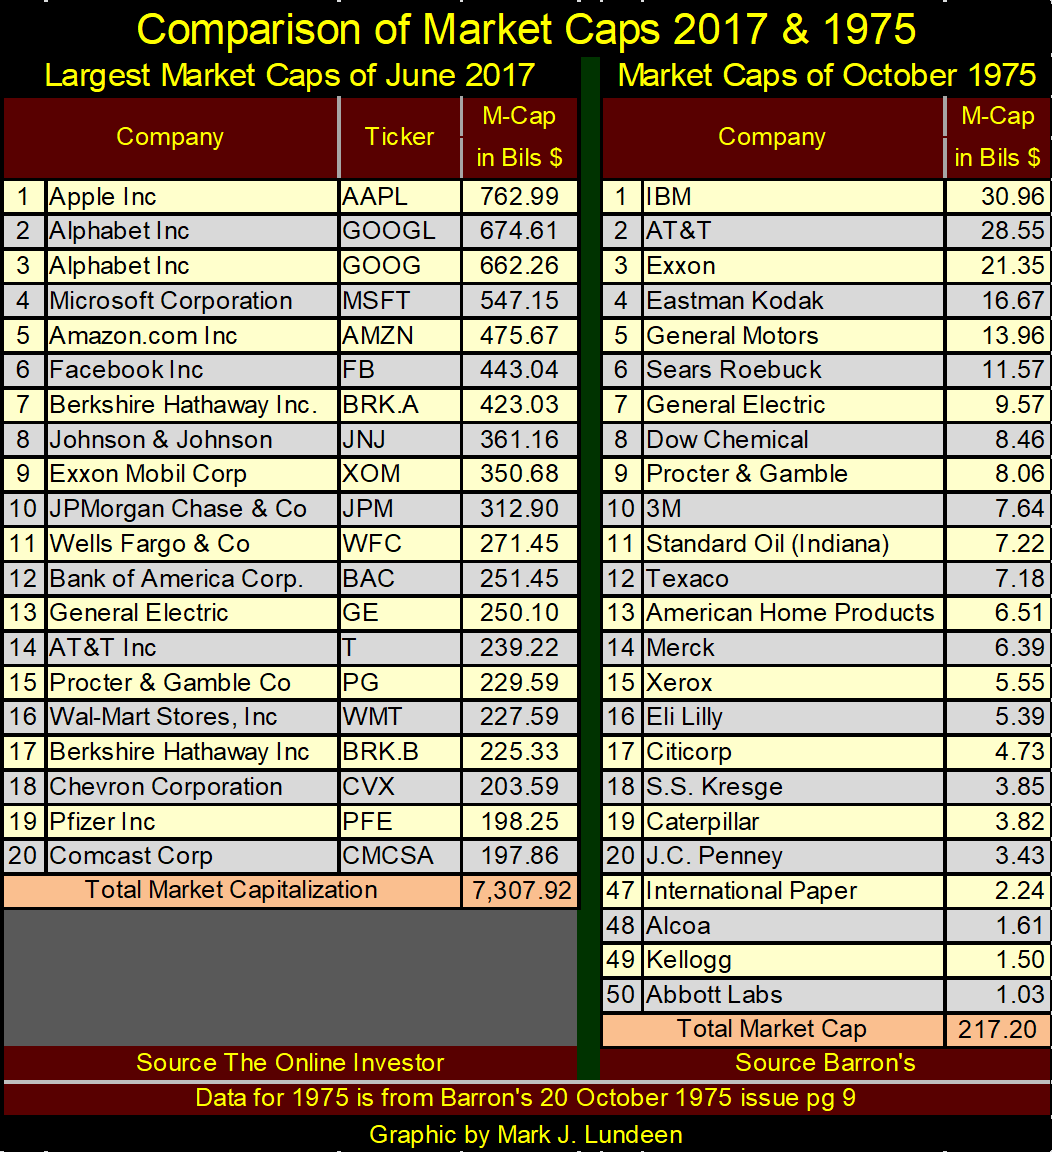
I like historical market data, such as the comparison of blue-chip stock market capitalizations of 2017 to 1975 seen in the table below. I need to explain the data displayed. The market caps for 2017 I got from The Online Investor.
Enough said on that. However, the data from 1975 is from an old Barron’s article (its October 20th issue, page 9) on the “favorite fifty” stocks, or the favorite fifty blue-chip stocks banks and trust funds were investing in. Were these fifty stocks the fifty largest companies trading in the stock market in 1975? Looking at the names in the table (IBM, Exxon, GM, AT&T, GE etc.) it’s a safe assumption they were.
This article from long ago didn’t expressly list these companies’ market capitalization. However, it did give the dollar valuation the banks and trust funds held in these companies, as well as the percent of the public float these institutions had absorbed.
I derived these companies’ market caps as follows. If the table provided in the article said the trust funds had in total held $10 of company XYZ, which was 25% of its public float, I took the $10 and divided it by 25% (0.25) to calculate its market cap of $40. So, how the market caps were calculated on the two sides of the table isn’t identical. But the market cap data for 1975 is well within the historical reality of forty-two years ago.
The Online Investor listed the twenty largest market caps, but Barron’s five decades ago listed fifty in its “favorite fifty.” So, to see the full range of market caps available from 1975 I also included #47-50 on the list.
It’s interesting how Abbott Labs (#50), a huge company then as it is now, had a market cap of only $1.3 billion in October 1975. In 2017, an individual wealth of $1.3 billion doesn’t even receive honorable mention in the Forbes listing of the world’s wealthiest individuals.
© Mark Lundeen
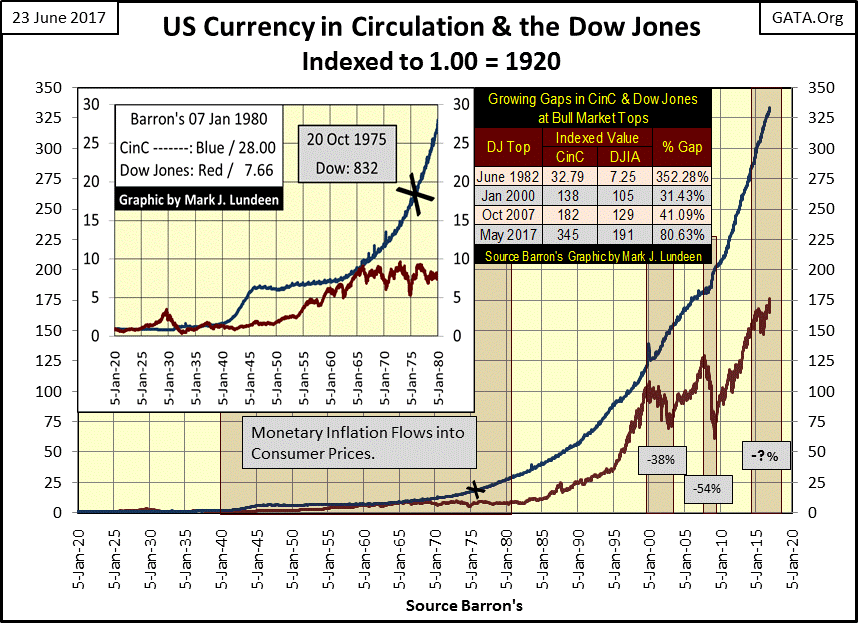
Abbott Labs’ current market cap is $84 billion; a bit more than the current net worth of Bill Gates ($75 billion as per Forbes). I doubt Abbott is selling 84 times the aspirin it did decades ago. So why the huge difference in Abbott’s market capitalization (and the net worth of Mr. Gates) from 1975? Because monetary inflation flowing from the Federal Reserve for the past five decades has inflated market valuations in the stock market (see chart below).
I’ve placed an X on the timeline marking 20 October 1975 and noted the Dow Jones closed at 832 in that issue of Barron’s.
© Mark Lundeen
October 1975 occurred during a unique period of market history that spanned from 1966 to 1982, where the Dow Jones attempted to break above, but failed to stay above 1000 five times. The chart above shows why; monetary inflation from the Federal Reserve during those sixteen years flowed into consumer prices, not market valuations.
The Dow Jones wouldn’t break above, and stay above 1000 until November 1982; exactly when consumer price inflation began going down, and the stock market began an advance that continues to this day.
Viewing the main body of the chart above explains why the market caps of Wall Street’s largest blue-chip stocks have expanded as they have, and why we have so many billionaires in 2017.
Only four companies from 1975 made the list of 20 largest market caps for 2017:
- General Electric
- Exxon
- AT&T
- Proctor & Gamble
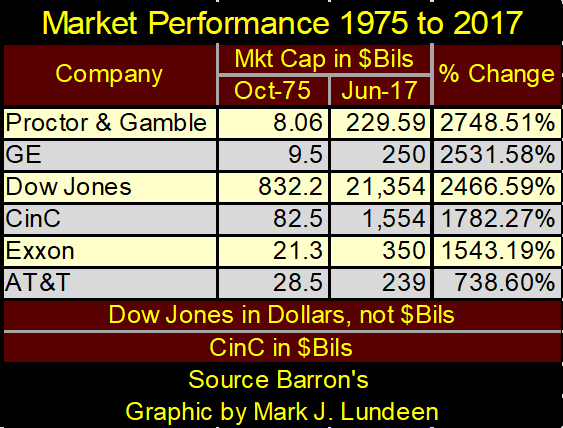
In the table below I included the Dow Jones and CinC from the 20 October 1975 issue for a comparison to the broad stock market and inflation flowing from the FOMC. Proctor & Gamble and General Electric’s expansion in market capitalization exceeded the broad market, as measured by the Dow Jones, and outperformed monetary inflation as measured by CinC. However, Exxon and AT&T failed to do so, as I expect was true for most of the favorite fifty stocks from 1975. But if you do the math, Abbott Labs was up 8055% since October 1975, so there are some real inflationary winners in the table above too.
© Mark Lundeen
But winners in what sense? From the perspective of someone who purchased Abbott Labs, GE or P&G in October 1975 and held on for dear life until June 2017, forty-two years later. And what a crazy forty-two years this was!
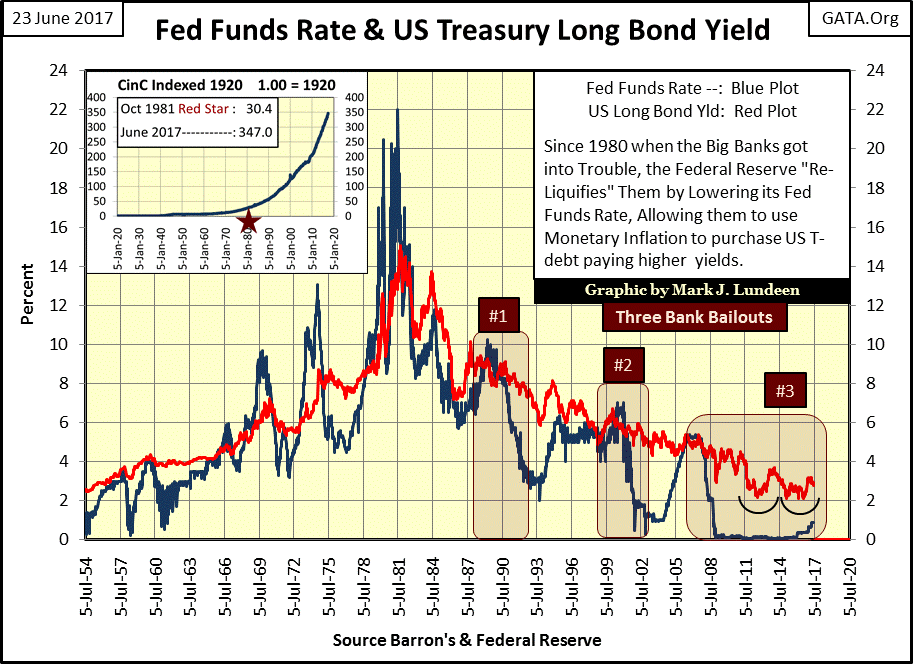
Since the August 1982 start of the current bull market, how many times did the Federal Reserve bailout the big banks on Wall Street? By my count (chart below) three times, with the largest bailout (our current bubble) still pending.
Barron’s Alan Ableson in the early 1990s (bailout #1) passed this joke on to his readers:
Why did New Jersey have all the toxic-waste dumps while New York had all the investment bankers? Because New Jersey had first choice!
This joke became less and less funny during bailouts #2&3. What’s coming our way won’t improve its wit as decades of inflation in the financial markets begin to deflate.
© Mark Lundeen
By my reckoning, market valuations in today’s stock market is largely due to hot air “injected” into them by the FOMC after decades of monetary shenanigans. The market capitalizations of June 2017 should not be considered permanent.
Looking at the companies that fill the table’s listing of the largest market caps is an interesting study too. Only one bank made the top 20 list in 1975 (Citicorp #17). The other nineteen produced something that was consumed by the economy or was a retailer (#6 & 20).
The current top six of the 20 largest market caps are distinctly Orwellian. The WikiLeaks disclosures of the past year have shown how these companies have been willing collaborators in providing technical support to gather personal information on individual American citizens, and the rest of the world to the NSA and CIA.
This surveillance was done without authorization by Congress, who itself couldn’t grant it as such wide-spectrum surveillance by the state is against the American Constitution. So the deep state encourages Alphabet Inc. (Google) and Facebook to conduct it for them, which they are happy to do.
Apple’s I-Phone provides GPS data on its owners. The deep state likes that as now they always know where you are, so they always know where to pick you up should you get out of control. Or if the need arises to call in a predator strike, as they may one day deem necessary in the case of President Trump.
Appliance manufacturers are connecting TV sets and refrigerators to the internet for surveillance purposes. Seriously, it’s in the WikiLeaks Vault 7 disclosures that there are large screen TVs (and computer monitors) looking back at you as you look at them. Turning off the TV doesn’t turn off the camera.
And Facebook, being a communal-digital diary of billions of people is the worst. People freely confess what they actually think, and exactly who agrees with their “extreme views”, such as “lock her up” are also documented on Facebook.
Much of what these companies are doing in collaboration with American intelligence agencies are felonies, but who in 2017 cares? The GESTOPO never had it so good in Nazi Germany as the deep state now does in America. That Trump is so hated by Washington’s elite is the reason I like him so much.
I’ll tell you how bad this cooperation between the top six of the list and the deep state is. Jeff Bezos of Amazon (#5 on the market cap list, and #5 on the Forbes billionaires list – $42.5 bil) purchased the failing Washington Post newspaper for around $300 million, no doubt with a loan provided by a large Wall Street bank. Amazon shortly thereafter received a $600 million contract from the CIA for cloud services, and the Washington Post has since done nothing but print anti-Trump propaganda.
Washington Post’s FAKE NEWS on Trump’s pending “legal problems.”
What a hoot! Comey is a long time crony of the Clinton-crime family. That Trump created a dodge that maybe there were recordings of Comey’s conversations with the president forced him to tell the truth. Trump was brilliant! How Comey became the Director of the FBI, and his pending legal problems would be a better story for the Washington Post to publish, if the Post wanted to be taken seriously – which they don’t.
For years the Clinton Foundation has been described by its critics as the largest fraudulent charity scam in history. The Washington Post, exactly like the rest of the MSM and “progressives” everywhere could care less that the Clintons have stolen billions of dollars in charitable aid from the Haitians. Haiti was the poorest nation in the Western Hemisphere, even before they were devastated by an earthquake and hurricane. Many people have died in Haiti because of what the Clinton Foundation did, and who in the MSM cares?
No, the MSM continues digging into Trump’s alleged Russian connections, which after a year they’ve found nothing!
Back to the market-cap lists above.
Banks now sit at #10,11 & 12 on the list. Back in 1975 banks supported the real economy by skillfully managing credit. It was a good business, but not one that resulted in a bank becoming larger than the companies it extended credit too. Obviously, that has all changed in 2017, with only Exxon and Johnson & Johnson (companies that produce real stuff at a profit) having larger market caps than J.P. Morgan, Wells Fargo and Bank of America.
What changed? Well, I’m no fan of Rolling Stone magazine, but I expect their Matt Taibbi hit the nail on the head with the following quote on Goldman Sachs:
“The first thing you need to know about Goldman Sachs is that it’s everywhere. The world’s most powerful investment bank is a great vampire squid wrapped around the face of humanity, relentlessly jamming its blood funnel into anything that smells like money”
– journalist Matt Taibbi, profiling the bank for Rolling Stone magazine in 2009
If the mainstream media did their job, which they haven’t for decades, we’d see lots of reasons why the banking system has become so much more dominant in the economy, none of them good. They could begin with an expose on the multi-hundred trillion dollar OTC derivative scam that almost took the world down in 2008, and most likely will in the not too distant future.
—
DISCLAIMER: This article expresses my own ideas and opinions. Any information I have shared are from sources that I believe to be reliable and accurate. I did not receive any financial compensation in writing this post. I encourage any reader to do their own diligent research first before making any investment decisions.

-

 Crypto4 days ago
Ethereum Pushes AI Integration With ERC-8004 and Vision for Autonomous Agents
-

 Biotech2 weeks ago
ByBug Turns Insect Larvae into Low-Cost Biofactories for Animal Health
-

 Business6 days ago
Dow Jones Breaks 50,000 as Bull Market Surges Amid Caution and Volatility
-

 Business2 weeks ago
Battered, but Still Bullish on Gold & Silver


You must be logged in to post a comment Login