Markets
European indices hit record highs thanks to Brexit
The London FTSE faded along with the Brexit. The Brexit was triggered with great fanfare but the EU immediately stuck a wrench in it. The Brexit could be quite messy if agreements cannot be made on trade, finance, and assets.

Brexit had its inevitable effect on the London Stock Exchange, while indices in Europe soared. The US stock market picked up and gold and silver rallied.
The past week in the markets can only be described as dull. The US stock markets rebounded, but there appeared to be a distinct lack of enthusiasm. Meanwhile, indices in Europe hit record highs (France’s CAC 40 and Germany’s DAX). The London FTSE faded along with the Brexit. The Brexit was triggered with great fanfare but the EU immediately stuck a wrench in it. The Brexit could be quite messy if agreements cannot be made on trade, finance, and assets.
The EU wants Britain to pay an exit bill, a big one. They need to determine how to deal with the migrants of which 1.2 million Brits live in the EU and 3 million EU people live in Britain. The EU won’t even discuss trade until all other issues are settled. Of course, Britain wants the opposite. No trade deal with the EU could prove quite costly for Britain, as they would have to fall back on WTO (World Trade Organization) rules. As well, the financial sector that is 12% of Britain’s economy is making plans to leave in a number of instances.
Scotland wants to hold another referendum to separate from the United Kingdom, except the British parliament won’t even consider it. That is a recipe for trouble. Northern Ireland is also restless and they are contemplating hooking up with Ireland who remains in the EU. The people of Northern Ireland voted in favor of remaining in the EU. Britain’s hold on the famous Rock of Gibraltar is also tenuous as the EU is giving Spain veto power over the “Rock.” The “Rock” voted to remain in the EU, but the 30,000 inhabitants are British citizens and want to remain as a part of Britain. Except they have to go to the mainland on numerous occasions and if Britain is no longer an EU member travel to the continent could become a problem. Oh, and did we mention that the EU wants to conduct negotiations in French?
Gold and silver rallied, but the gold stocks yawned and posted small losses. The circus in Washington continued with former National Security advisor Michael Flynn willing to testify in the Russian probe if he is granted immunity. President Trump is backing Flynn’s request for immunity. That’s odd, as during the election campaign President Trump believed that if you wanted immunity you must have done something wrong. It has been suggested that Flynn would not be granted immunity.
Model Portfolio
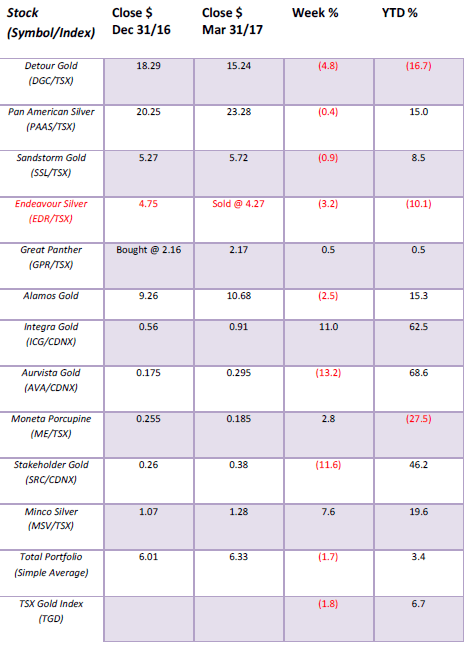
As with the TSX Gold Index (TGD), our model portfolio slipped this past week by 1.7%. We remain up 3.4% on the year. The star of the week was Integra Gold (ICG/V) with rumors of being a potential takeover target, particularly after Goldcorp (G/T) bought Exeter Resources (XRC/T). The belief is that others could be targets from majors and Integra would be a good take. We added Great Panther (GPR/T) this past week. GPR opened the week at $2.16 and closed at $2.17. Well, at least it was up which is more than we can say for the rest of the gold stock market this past week. This continues to appear as a large consolidation before another move to the upside.
© David Chapman
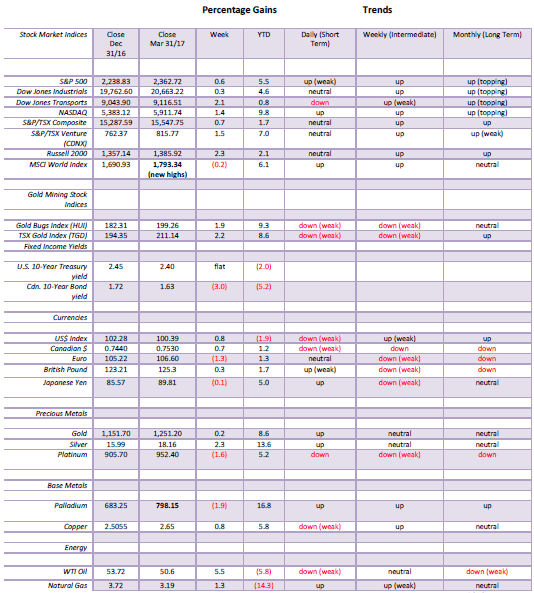
MARKETS AND TRENDS
© David Chapman
Note: for an explanation of the trends, see the glossary at the end of this article.
New highs refer to new 52-week highs.
Key Economic Numbers Week March 26 – March 31, 2017
(Source)
(Source: www.shadowstats.com, www.data.bls.gov, www.statcan.gc.ca, www.tdeconomics.com)
Note: % M/M unless otherwise noted
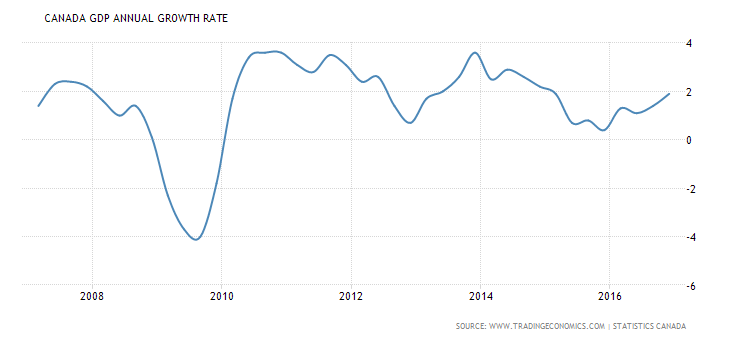
Canada’s economy is hot. Or so it seems, judging by the January GDP numbers that saw the Canadian economy expand by 0.6%, the best performance in five years. It marked the third straight month of expansion. Year over year Canada’s economy expanded by 1.9%. And Canada does not have the distractions of President Trump or the Brexit hanging over its head. Forget “Sunny ways” Justin Trudeau. It is now “Sunny Stephen” Poloz the governor of the BofC who was smiling even as he continued to urge caution. And no he has no intention of following the Fed by hiking interest rates—at least not yet. He believes there is more slack in the Canadian economy and that inflation is still benign.
(Source)
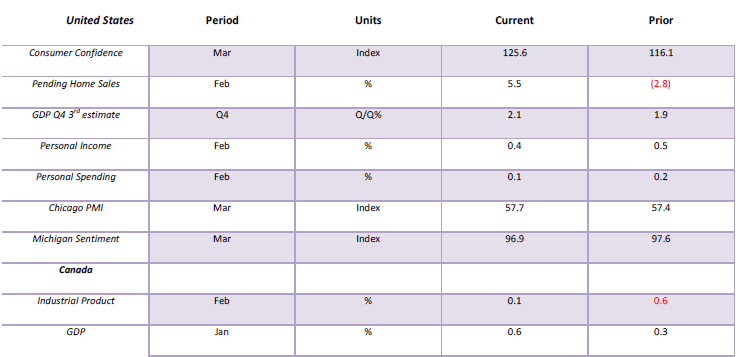
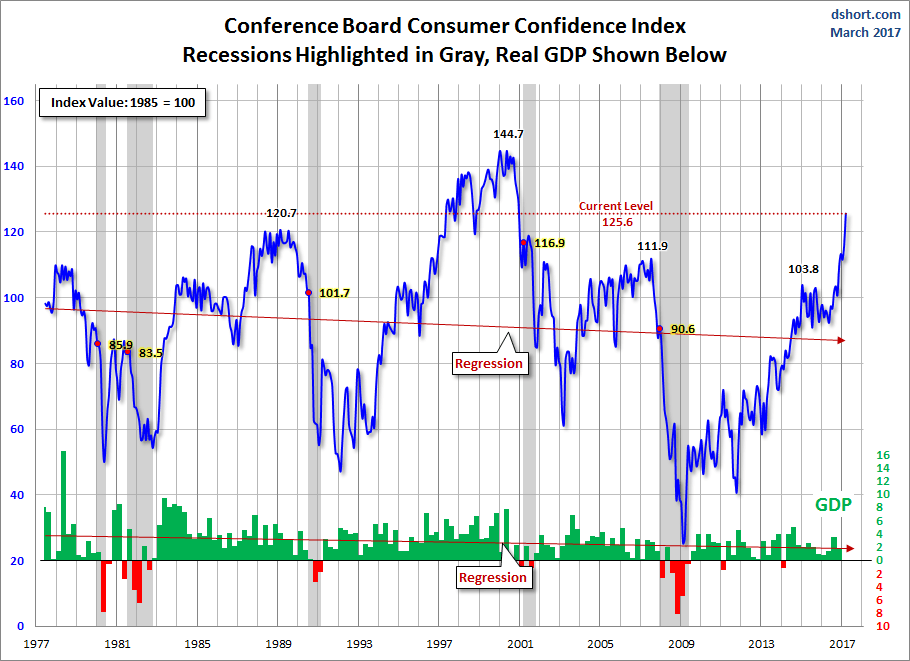
Consumer confidence in the US is soaring. The most recent number came in sharply higher than expected at 125.6 when all they were expecting was a reading of 113. Further, the February Consumer confidence index was revised upwards to 116.1 from 114.8. Consumers, it seems, have never been happier. It’s not quite the 1990s, but it is getting close as it is higher than was seen in 2007 and in 1989 before market tops and economic recessions. This particular reading is the one from the Conference Board as opposed to the Michigan sentiment survey, which actually slipped slightly in the latest release. The index as the chart shows can be quite volatile. And high consumer confidence readings it appears precede recessions and stock market declines. Couple this with the Conference Board’s survey of households on the stock market and there you discover a reading of 47.4, which is just shy of the record high of 47.7 seen in January 2000. Of course, that was the stock market top for the next few years. High confidence is seen at tops while high pessimism accompanies market bottoms. All of this is just a warning, but it also tends to act as a great contrarian indicator.
(Source)
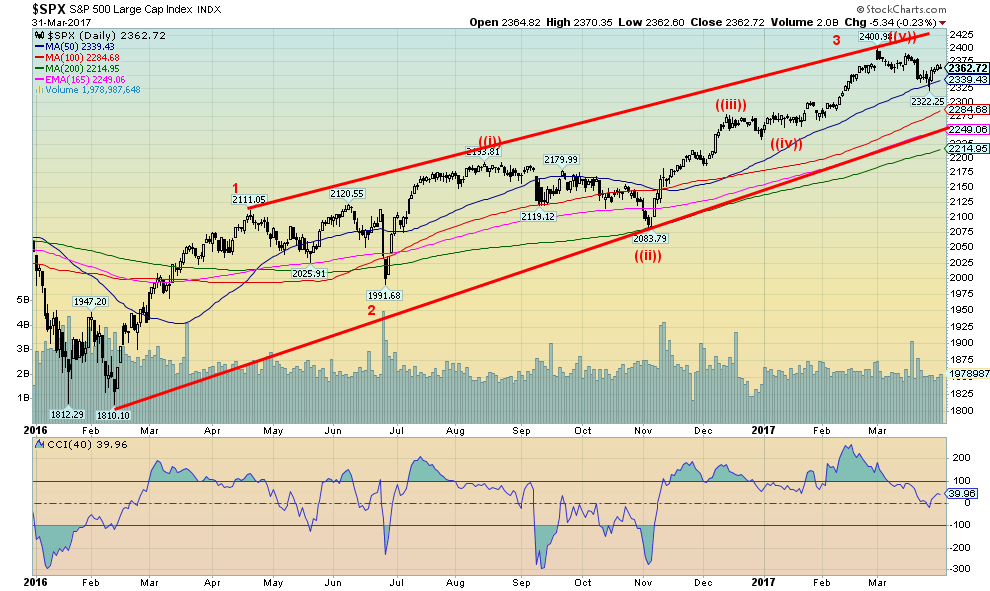
It is possible that the S&P 500 has completed five waves up from the Brexit low seen in June 2016. If correct, that could complete wave 3, up from the February 2016 low. That would suggest that following a corrective period there remained one more wave to the upside that could easily take us into the summer of 2017. It is also possible that what we have labelled as wave ((iii)) and ((iv)) is not correct that the high on March 11, 2017 at 2,401 was the end of wave ((iii)) and we are currently working on wave ((iv)) with wave ((v)) to come in April or May followed then by a stiff correction. Either way, we could still be looking at final wave 5 top sometime this summer. In the larger scheme of things that would also complete five waves up from the March 2009 bottom and in theory could signal the end of the current bull market.
After rallying strongly on Tuesday the rest of the week was spent putting in lackluster gains. As long as the market fails to take out 2,390, the odds favor at least one more move to the downside before the advance continues. The danger area comes at the recent low of 2,322. If that level breaks then odds favor a test down to at least 2,290 and possibly down to 2,250 and major trendline support. All of this should unfold during April and possibly into May. May, of course, signals the start of the seasonal “Sell in May, and go away.” Of course, we have passed the “buy when it snows, and sell when it goes” stage. January did eke out a small gain, but the January barometer has not been as good the past few years as a clue to market direction for the year. Historically it does suggest an up year.

(Source)
The number of stocks trading above the 200 day MA today is diverging with the number seen back in 2009, 2010, and 2013 through 2014, suggesting the current move does not have the steam behind that earlier rallies did even as the market makes new (all-time) highs. The monthly chart of the S&P 500 shows five distinct waves to the upside from the major 2009 low. We are currently in the throes of wave 5 and as noted; our expectations are that this wave could complete itself sometime this summer of 2017.
(Source)
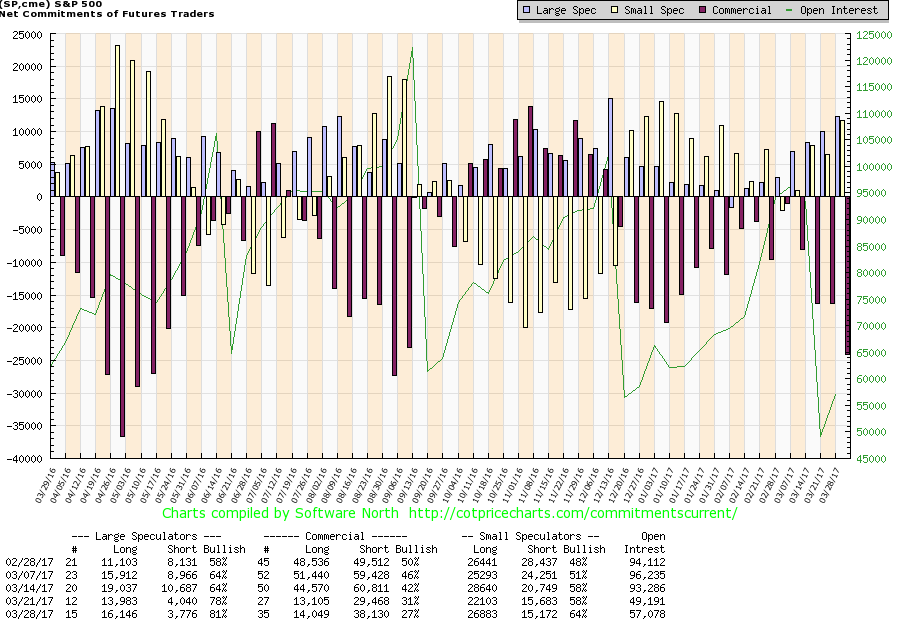
We don’t normally show the COT for the S&P 500 but thought we would as it does tell us some interesting things. First, note the large build-up in shorts for the commercials into May 2016 (the dark maroon color). That build-up of shorts preceded the Brexit collapse in June 2016. By the time of the Brexit collapse, the commercials were covering their shorts. The next build-up of shorts came into August/September 2016 and that preceded the minor drop into November 2016. By October the commercials were actually switching to a long position as they went into the US election. That turned out to be prescient given the strong rally after Trump’s election. Now the commercials have reached their highest level of shorts since August 2016 with the commercial COT at 27% down from 31% the previous week. Meanwhile, the large speculators COT (hedge funds, managed futures, etc.) has seen its COT rise to 81% from 78% the previous week and 64% only two weeks earlier. We’d go with the commercials. Just as it pays to follow the commercials in the gold market, following the commercials in the stock market can also prove to be good.

(Source)
If there is an argument that we have completed our wave to the upside it is in looking at the KBW Bank Index that appears to have made its wave 3 top at 99.77. There could still be a run to new highs into the summer following the correction that appears to be underway but then it could also be what we call a failed fifth wave, meaning it fails to make new highs over 99.77. The KBW Index did bounce of trendline support recently but the rebound has thus far been feeble. Watch this one.

(Source)
The German DAX index leaped to new all-time highs this past week along with France’s CAC 40. The wave count for the DAX seems clearer in that it has completed waves 1 and 2 to the upside and appears now to be working on wave ((iii)) of wave 3. That would imply a correction followed by a move to new highs before a more substantial correction sets in. The DAX appears to have reached the top of the channel, suggesting a pullback could be getting under way this coming week.
(Source)
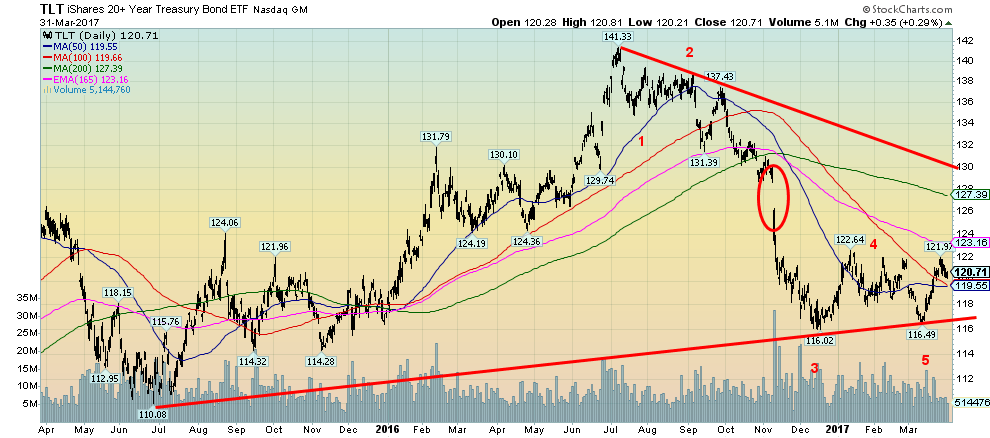
We remain convinced that the US Treasury bonds are in the throes of a corrective wave following the decline from the July 2016 top at 141.33. The huge gap left on the chart back in November remains a draw for corrective action. As well, the downtrend line from the July 2016 also remains a draw for the current corrective action. Following this correction. there could be another sharp decline to the recent lows. We have often noted that bonds tend to follow a six-year cycle and the last six-year cycle low was probably seen in late 2013/early 2014. That targets the next six-year cycle to occur sometime from 2018 to 2020. The six-year cycle tends to subdivide into three 2-year cycles or two 3-year cycles. Given this is stretching into three years from the low in late 2013/early 2014 odds suggest that the current decline is the three-year cycle. Once the low is determined, bonds should rally again but probably not make new all-time highs. The high in July 2016 may be it and after 35 years up from the major lows of 1981, it suggests that we may have made a high in bond prices for years to come.

(Source)
The US$ Index tested down to our breakdown zone near 99 but failed to break through and instead rebounded and closed higher on the week. For US$ bulls this is a potentially positive development. For the past few weeks, we have wondered whether the US$ Index were forming an awkward head and shoulders top. The failure to break down through the neckline this past week has left that scenario potentially behind. Instead, we need to refocus on the possibility once again of new highs above 103.82. We have long held potential targets up to 106–108. The question now is, is the US$ Index correction over and we can label the low of March 27, 2017 as wave 4, or is there more to come. So far, the decline appears as an ABC down from the top on January 3, 2017, but the unfolding pattern could well be an ABCDE type pattern. This would be wave D with wave E to come. A break above 101.50 would suggest we could now be on our way to 105–108. These patterns can also double top so we would watch carefully if the market makes it way back to the January high of 103.82. Only a return now and a firm breakdown under 98/99 could bring back the more bearish scenario.
(Source)
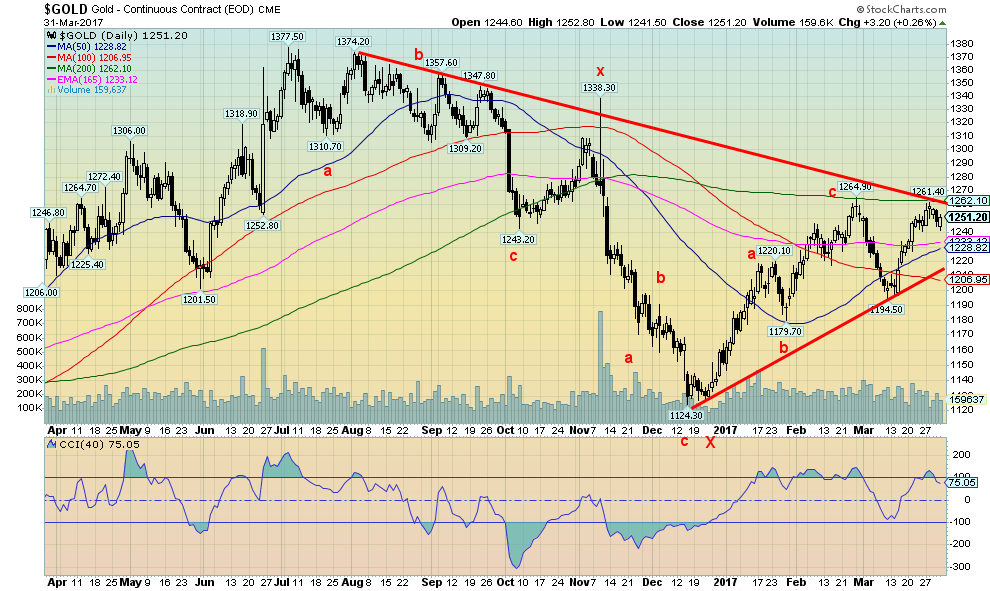
Just as the US$ Index failed to break down under 99 gold failed to take out $1,260 (high was $1,261.40). If the US$ Index rallies as we expect then it is possible that gold could correct back further. We are a bit uncertain of the wave count here (corrective waves are always difficult), but a further correction could pull gold back to $1,220/$1,230 and even down to $1,210. Below $1,205 would signal that a breakdown under the earlier low of $1,194.50 was probable and a test of $1,175/$1,180 would be underway. If gold is able to go against a rising US$ (it has happened) and breaks above $1,260 then a run to $1,300 is quite likely. Gold is seasonally weak often through April and May and sometimes into June. Although last year gold put in a low around this time and rallied into early May before correcting back into the end of May. Gold then rallied into the July 2016 top. So with the exception of the sudden rally in April 2016 the weak seasonals did work last year. Sometimes the weak seasonals have carried into June or even early July.
(Source)
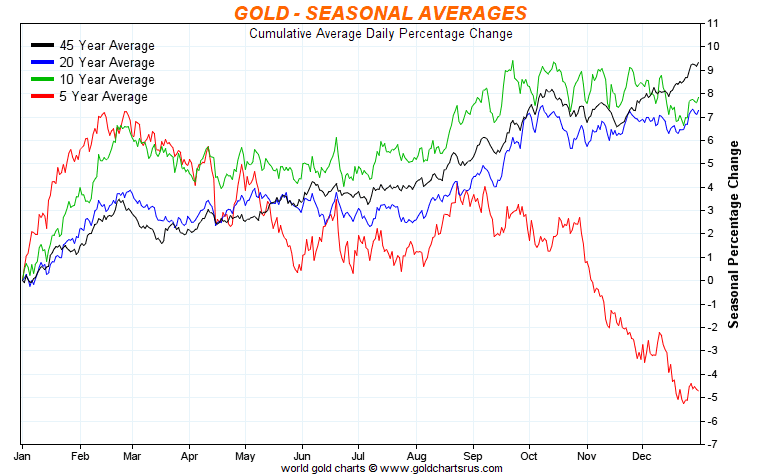
Here is a snapshot of gold’s seasonals over a 5, 10, 20 and 45-year period. Note strength into February and March followed by seasonal weakness into May/June before a rebound gets underway in the summer months. The latter part of the year also tends to be strong or at least it has been. The divergence is the last five years that shows considerable weakness from roughly September until the end of the year. Important lows have been seen in November 2013 and 2014 as well as December 2015 and 2016. The major low (so far) was seen in December 2015 at $1,045.

(Source)
Like gold, silver appears to have made what is known as a double zigzag (abcxabc) into the December 2016 low at $15.68. Silver also ran into a wall at the downtrend line from the July 2016 top this past week but, unlike gold, it did not pull back that much. Silver outperformed on the week gaining 2.3% vs. gold’s gain of 0.2%. Given the weakness in gold, we view silver’s performance as important and it may be suggesting that the current pullback won’t be much. If silver were to break back under $18 then it could fall to $17.65 and even $17.50. Below $17.50, a decline to $17.20 is probable. Above $19, there is considerably more bullish potential.

(Source)
The commercial COT pulled back this past week to 29% from 31% the previous week. Meanwhile, the large speculators COT (hedge funds, managed futures etc.) jumped to 72% from 68%. The commercial COT saw long open interest rise by over 3,000 contracts but short open interest jumped by over 26,000 contracts. Meanwhile, no surprise the large speculators saw their long open interest rise by roughly 8,000 contracts and short open interest fall by over 13,000 contracts. We believe this is a temporary setback as the commercial COT short position is nowhere near as high as it was back in September 2016. But it is worth keeping an eye and may fit with a pullback that is still to come for gold.
(Source)
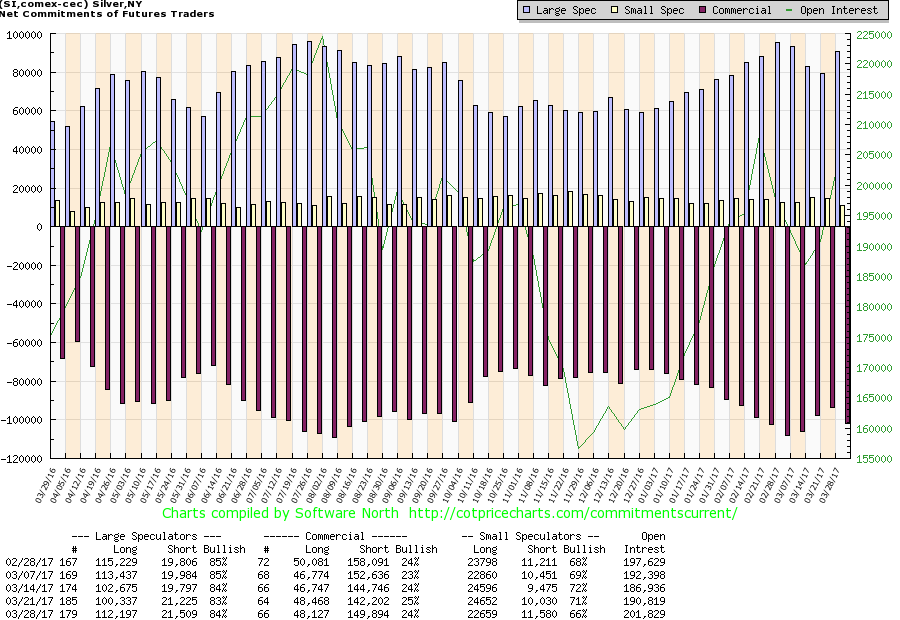
The silver commercial COT has remained weak even as silver has rallied. This past week it slipped back to 24% from 25% while the large speculators COT rose slightly to 84% from 83%. We are not going to read a lot into this one, but the weak commercial COT is somewhat of a concern. It would become more so if silver were to fall back and go under $17.
(Source)
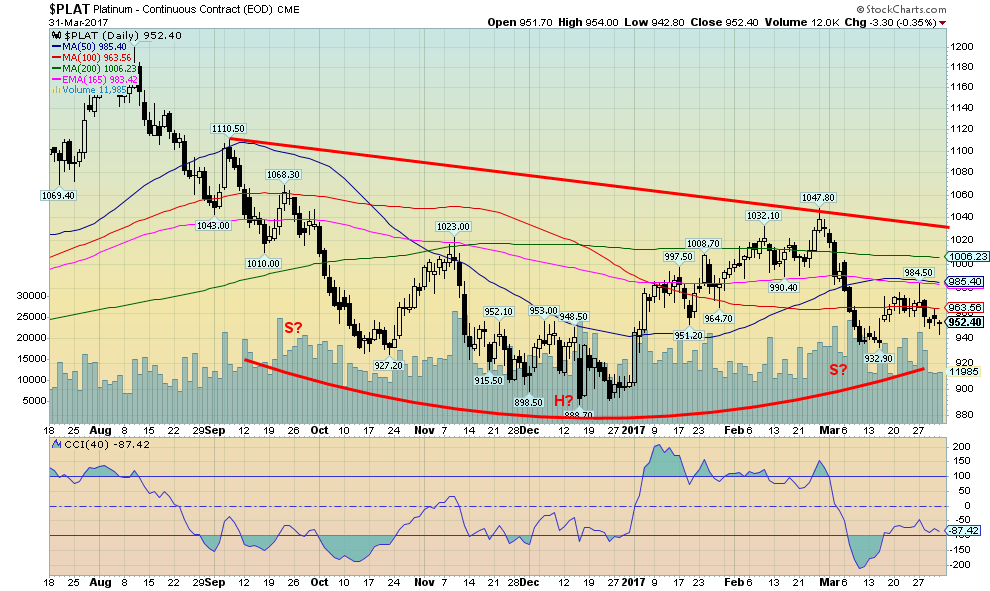
Platinum has been a big underperformer. During the bull run from 2001 to 2011 platinum traded continually higher than gold. Platinum topped out at $2,286 vs. gold’s high of $1,924. But today platinum is the weak sister trading consistently under gold’s price. Platinum appears to be forming a potentially interesting bottom pattern. It does appear as a potential head and shoulders pattern with the neckline currently around $1,030/$1,035. A firm break above that level could project up to $1,250. That would only bring platinum prices up to today’s level for gold. Platinum has a ways to go to catch up to and surpass gold once again.
(Source)
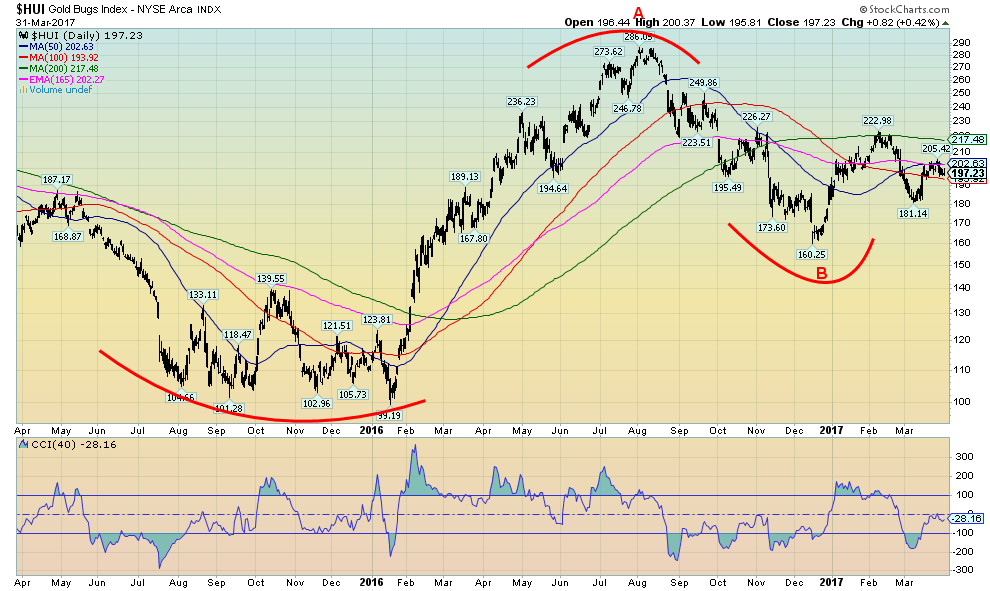
The gold stocks as represented by the Gold Bugs Index (HUI) did not perform well this past week. The HUI lost 1% while the TSX Gold Index (TGD) dropped 1.8%. Not a stellar week particularly against the backdrop of both gold and silver enjoying an up week. We often view weakness in the gold stocks as a sign that weakness could be coming for both gold and silver. Another reason to be cautious going forward until gold firmly breaks above $1,260.
(Source)
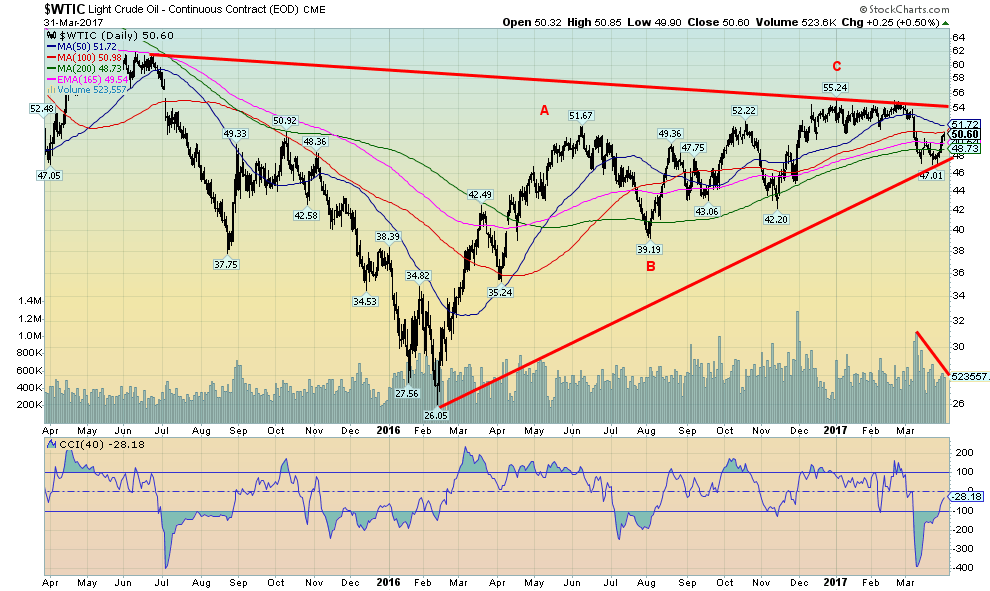
WTI oil rebounded this past week but, as we note below, volume tailed off. The drop that took oil prices down to $47 was on considerably higher volume. This makes the current rebound suspicious and the feeling here is that oil prices should work their way down once again. There remains a global glut of oil. A break once again of $47 could suggest a decline next good support at $40/$42. It is difficult to say how low oil prices could get. We believe that the collapse to $26.05 back in February 2016 may have completed an A wave of a larger ABC pattern or it may unfold as an ABCDE type pattern over a couple of years. In any case, our suspicion is that the B wave of a higher degree is now complete (labeled as ABC) and the next move is down, which is underway. The WTI oil commercial COT did improve in the recent drop going from 36% bulls back in early February to 40% in the most recent report.
GLOSSARY
Trends
Daily – Short-term trend (For swing traders)
Weekly – Intermediate-term trend (For long-term trend followers)
Monthly – Long-term secular trend (For long-term trend followers)
Up – The trend is up.
Down – The trend is down
Neutral – Indicators are mostly neutral. A trend change might be in the offing.
Weak – The trend is still up or down but it is weakening. It is also a sign that the trend might change.
Topping – Indicators are suggesting that while the trend remains up there are considerable signs that suggest that the market is topping.
Bottoming – Indicators are suggesting that while the trend is down there are considerable signs that suggest that the market is bottoming.
—
DISCLAIMER: This article expresses my own ideas and opinions. Any information I have shared are from sources that I believe to be reliable and accurate. I did not receive any financial compensation in writing this post, nor do I own any shares in any company I’ve mentioned. I encourage any reader to do their own diligent research first before making any investment decisions.


Bitcoin Stalls Near $60K as Strategy Moves, ETFs Outflow, and EU MiCA Rules Take Effect
Bitcoin hovers near $60,000 with ETF outflows, while Strategy boosts reserves, sells BTC, and raises dividends to reassure investors. Ethereum...


Cannabis Dominates Global Drug Use: Trends, Risks, and Shifting Markets
Cannabis remains the world’s most widely used illicit drug, with 256 million users in 2024, surpassing all others combined. Growth...


Italy Approves First Hydrogen-Powered Train for National Rail Network
ANSFISA has approved Italy’s first hydrogen-powered train, the Alstom HMU214, for use on the Brescia–Iseo–Edolo line. Capable of 140 km/h,...


Cotton Market Weakness Persists Despite Brief Rebound
Cotton prices fell to new lows last week before a modest rebound. USDA data shows crop conditions remain worse than...


Eli Lilly Hits $1 Trillion Valuation Amid Strong Bullish Momentum
Eli Lilly stock hit a record high, surpassing $1 trillion market value after strong product demand. Shares surged over 7%,...
 |
|
 |  |
 |
|
-

 Impact Investing2 weeks ago
SBTi Net-Zero Standard 2.0 Enhances Corporate Climate Action
-

 Crypto5 days ago
Bitcoin and Ethereum Slide as Market Pressure Builds Amid Strategy Concerns and Layer 2 Disruptions
-

 Business2 weeks ago
Fed Policy Shift Raises Concerns Over Debt and Inflation Risks
-
 Crypto20 hours ago
Bitcoin Stalls Near $60K as Strategy Moves, ETFs Outflow, and EU MiCA Rules Take Effect
You must be logged in to post a comment Login