Featured
Examining the growth in GDP from 1929 to 2016: Things to learn
One of the factors investors and economists use to measure economic progress is GDP growth. Here’s a review of the US economy’s progress based on GDP events.

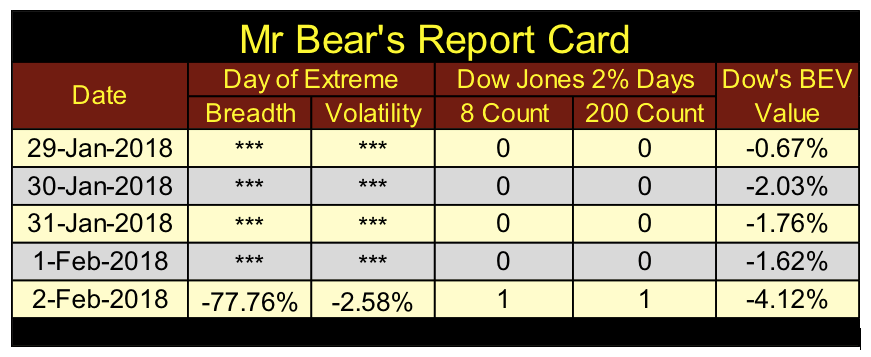
Mr. Bear was a very bad bear this week. In his report card below, we see two extreme days — one of volatility (Dow Jones 2 percent day) and a day of extreme market breadth (NYSE 70 percent A-D day).
© Mark Lundeen
In October 2008, during the credit crisis crash, for the week the Dow Jones saw its first -40 percent decline from an all-time high since November 1974; there were four Dow Jones 2 percent days. On one day, the Dow Jones was down 7.44 percent from the previous day’s closing price. At the current levels, the Dow Jones would have to drop 1,980 points in a single day for us to see a similar percentage decline.
That week a decade ago also saw three NYSE 70 percent A-D days, and Congress commence an investigation, live coverage on commercial free TV, of what needed to be done to restore the collapsing financial system. With seven extreme market events occurring in a single week in October 2008, you can believe Mr. Bear was busy feeding, and Wall Street and Washington didn’t like it one bit!
But in early February 2018, I can’t really say whether or not the Dow Jones has finished inflating. For us bears, it’s still nice finally seeing some extreme market events. The last Dow Jones 2 percent day occurred on Nov. 7, 2016, a +2.08 percent day. The last NYSE 70 percent A-D day was on Aug. 10, 2017, a +71.89 percent day.
It’s been a long time since we’ve seen a day like Friday, but one big down day does not a bear market make. Maybe we were just due for a really bad day in a continuing bull market. So unless we see more of the same coming, let’s not do anything imprudent like suggesting the post-March 2009 has run its course. But then, if you decided to liquidate your holdings in the stock market, I wouldn’t try to persuade you not to do it.
But I note both days of market extremes occurred on Friday, the day President Trump declassified the House Intelligence Committee’s report. America has never seen anything like it — the leadership of the FBI and Department of Justice allegedly plotting and the partial execution of a putsch on the incoming Trump administration.
Ultimately, this scandal will reach Wall Street. A civil war being waged between Washington’s old-guard establishment and the incoming Trump administration can’t be good for the bulls unless you’re a bull on gold and silver. Nuff said.
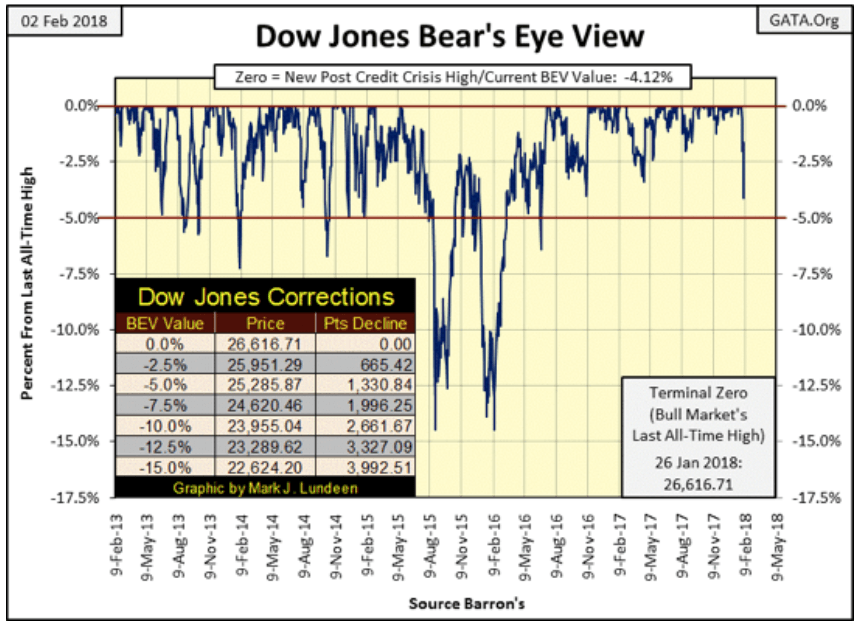
Here’s the Dow Jones BEV chart; what a difference a week can make. Down 4.12 percent from a BEV Zero made the previous Friday. That’s a one week 1,096 point loss in the Dow Jones. Should next week resume this week’s decline, an additional 4 percent decline in the BEV plot, that would take the Dow below its BEV -7.5 percent line. A two-week (10 trading days) 8 percent loss in the BEV plot (over 2,000 points) is cause for alarm for the bulls.
My gut tells me this is likely going to happen, but my gut has lied to me many times in the past, so I’m not so quick to believe my emotions. But then I have no exposure to the stock market, making this easy for me to say.
Keep an eye out for the BEV -5 percent line. As seen in the BEV chart’s table, 25,285 for the Dow Jones. Hopefully, the Dow Jones will bounce off of its BEV -5 percent line. Should it decline below this critical line of support, did it blow through it, or is the decline slowing down as the Dow Jones approaches its BEV -7.5 percent line?
© Mark Lundeen
One thing is for sure, if the stock market continues seeing extreme-market events, it will become harder and harder to make a case for the bulls.
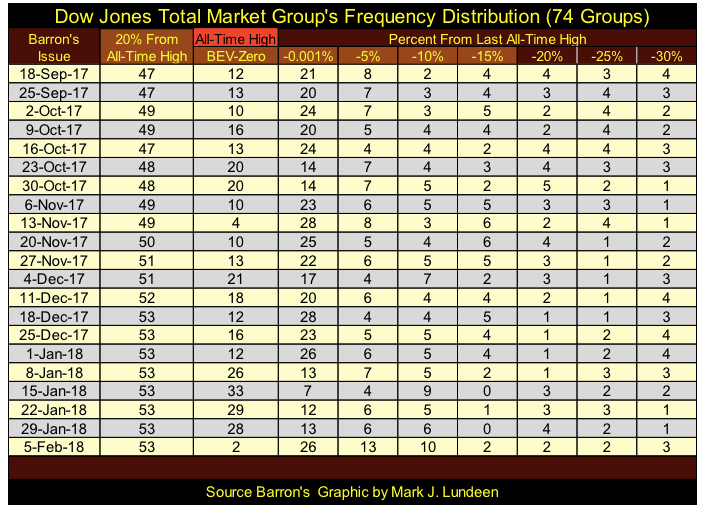
Looking at the DJTMG’s frequency distribution in the table below, this week saw the top 20 remain at 53, but the groups contained in the BEV-Zero to the -15 percent columns, which make up the top 20, slid down to lower levels this week.
© Mark Lundeen
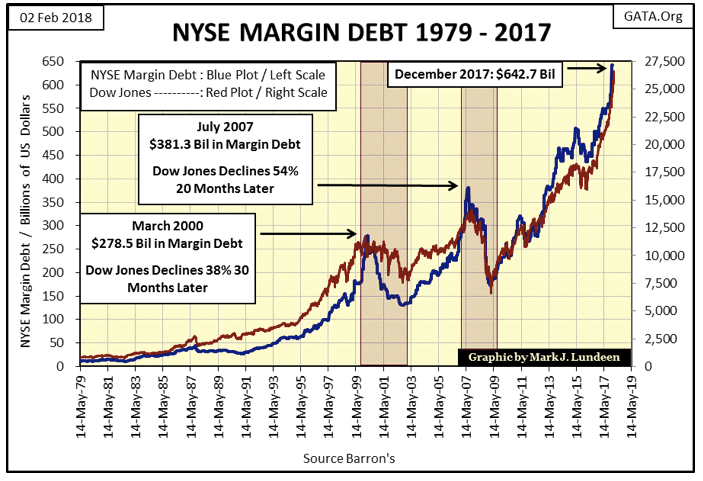
One really bearish factor weighing on the stock market is NYSE margin debt (Blue Plot below) reaching a new all-time high in December: $642.7 billion. Look at what happened to the Dow Jones when margin debt peaked in March 2000 and again in July 2007 — two significant bear markets resulted.
Will that happen again? We don’t yet have the numbers for January. January was a very good month for the stock market, and I anticipate another new high in NYSE margin debt. Margin debt provides the rocket fuel in a bull market, but in a bear market, it represents forced liquation at distressed market prices. Looking at the chart with its current $642 billion in margin debt, it promises ample volume of forced selling at distressed prices sometime before the coming bear market bottoms.
© Mark Lundeen
I don’t doubt the Dow Jones will see a 70 percent decline from its current BEV Zero, a really big and nasty bear market. When the market finally does factor in the coming political crisis, and increases in bond yields and interest rates, maybe expecting the Dow Jones to decline by only 70 percent is being optimistic. Remember, the entire world is wallowing in consumptive debt that may be supportable at today’s artificially low-interest rates and bond yields. But should rates return to where they were just prior to the 2007-09 credit crisis, defaults and counterparty failure are going to rise.
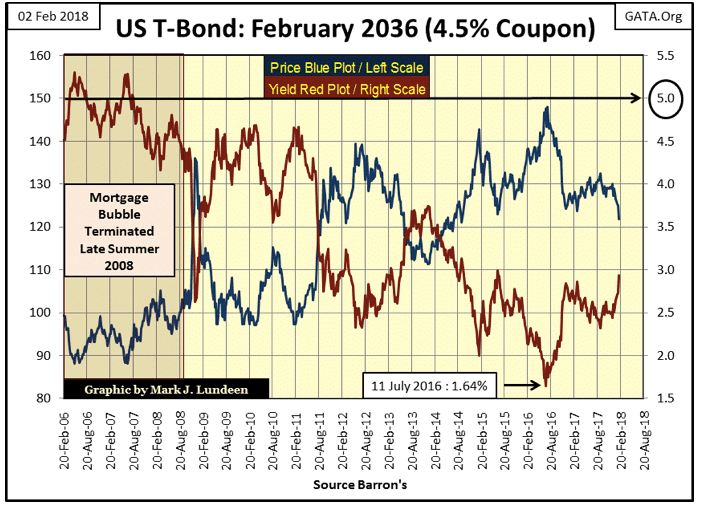
And bond yields are rising. Here’s a 30-Year T-Bond issued in February 2006. It still has 18 years before it matures, so it still trades like a long bond. It twice yielded over 5 percent before the credit crisis (Red Plot), but then bottomed at 1.64 percent in July 2016, and ended this week with a current yield of 2.94 percent. The entire yield curve shifted up by at least 10 basis points this week, with this bond’s current yield increasing by 21 basis points.
© Mark Lundeen
But somewhere above the 2.94 percent, this bond is now yielding, the bond market will cross over a threshold where Wall Street becomes bankrupt overnight. This is exactly what happened in 2008 with mortgage derivatives sold by Wall Street.
Like the Dow Jones, gold, silver, and the precious metals miners had a bad week, too. Should we continue to be bullish on them? I’d say yes, as precious metals assets are coming off the bottom of a very nasty, multi-year 45 percent market decline. New all-time highs in gold’s BEV plot below are something gold hasn’t seen since August 2011, almost seven years ago, and that makes precious metals a much safer place for your investment capital than the stock market.

© Mark Lundeen
But I wouldn’t be surprised if gold corrects once again towards the rising uptrend line I placed in the chart above, any more than if it exploded upwards from its current level in the coming weeks. I’m not making any predictions. But there is something comforting about taking a position in an asset class coming off a deep bottom, such as we see gold doing now in the BEV chart above. The same is true for silver and the PM miners.
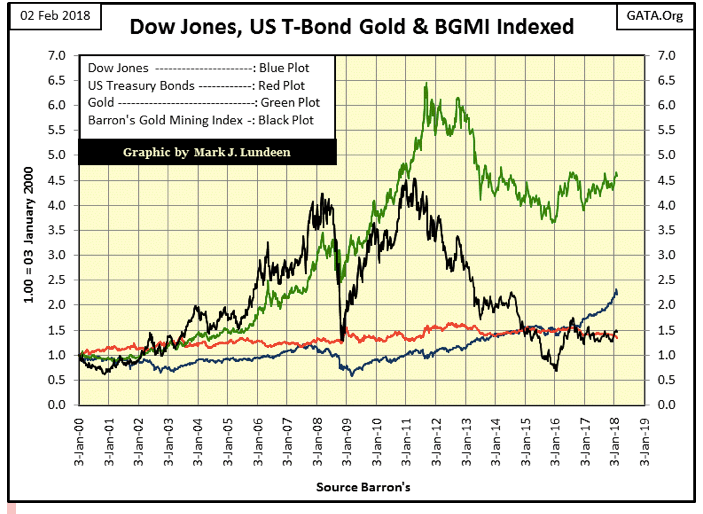
Here’s a BIG PICTURE chart; the indexed values of Gold, a boring old U.S. T-bond, the Barron’s Gold Mining Index (BGMI) and the Dow Jones.
For the past 18 years (since January 2000), even after a huge 45 percent bear market bottom, gold (Green Plot) has still easily outperformed the Dow Jones (Blue Plot) now near its all-time high. It wasn’t hard. Even the boring old T-bond (Red Plot) outperformed the Dow Jones for most of the 18 years shown on the chart. The mining shares (BGMI / Black Plot) have had a hard time since August 2011. But when the bull market in gold and silver resumes, I expect those mining shares will become glamor shares, as they frequently were from 1958 to 1980.
© Mark Lundeen
Gold’s step sum chart (below) remains bullish, though, on Jan. 24, it failed to take out the $1,366 it made in July 2016 by a few dollars. Give it time and it will get that and more done in the coming year. Just keep in mind on the days the stock market is under pressure, on negative extreme-market event days, Wall Street likes to dump on gold and silver.
But gold is coming off a hard bottom it made in December 2015. Its uptrend is only two years old and largely ignored by “market experts.” That means the public isn’t interested in gold. So who is buying it? I suspect it’s the smart money crowd, the people who like to buy low and have the patience to wait to sell high.
On the other side, the Dow Jones’ is at the end of a nine-year advance that has taken it up 20,000 points. With NYSE margin debt at historic levels, rising bond yields and a conflict between the White House and the FBI, DOJ and CIA, the stock market at current valuations has yet to discount all this into it.

© Mark Lundeen
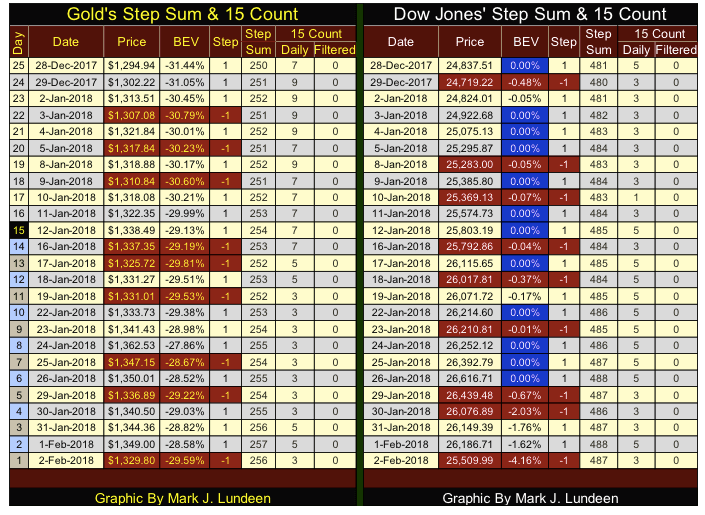
Moving on to gold’s step sum table below, in the past 25 trading days, its step sum has moved up by six net advancing days and its 15 count a +3. So even if gold closed down $20 on Friday, I’m hoping Friday’s big drop will prove to be a one-day event.
© Mark Lundeen
The Dow Jones’ step sum has also advanced by six net advancing days since Dec. 28, and its 15 count closed the week at +3. This week was free of BEV Zeros, but with the Dow Jones only 4.16 percent away from making a new all-time high, I’m not yet ready to call it quits on the venerable Dow’s advance. However, unlike gold, the Dow Jones is carrying a lot of baggage that in time will terminate its current advance, and motivate flight capital to flee into gold, silver and the precious metals mining shares.
I thought I’d review an old data series I haven’t covered for a while. Looking for nothing in particular, I came across an old file on Gross Domestic Product (GDP) that hadn’t been updated for years. The Source was the Department of Commerce’s Bureau of Economic Analysis (BEA). On opening the file, I found it updated to 2009, so in 2018 it was definitely time to update the series. It was then that I came across a situation (a problem?) I’ve seen before when mining data from government sources, the new numbers don’t match the old numbers.
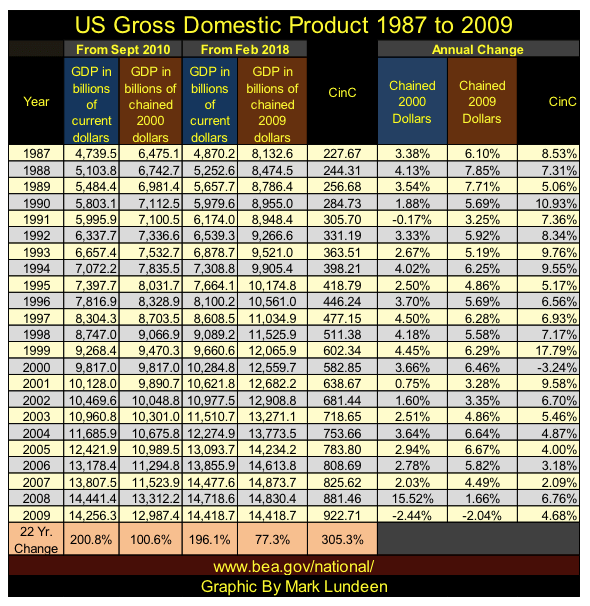
In the following table I’ve included, data downloaded in September 2010 used current and “chained 2000 dollars,” and the current data downloaded this week used current and “chained 2009 dollars.” What are chained dollars? I didn’t bother to find out, but I imagine they are dollars deflated by some measurement of inflation, frequently labeled as constant dollars. In any case, someone at the BEA acknowledges that using “current dollars” from the span of the data, from 1929 to today, somehow misses the point in measuring GDP over the decades.
I’ve added Currency in Circulation (CinC / the volume of paper money circulating in the economy) into the mix as GDP is measured in dollars. It’s a point of interest; to me anyway, of the performance of GDP relative to the flow of monetary inflation “injected” into the economy by the Federal Reserve.
The changes from seven years ago aren’t insignificant, as you can see below. Looking at 1987, in chained dollars, the old data has GDP at $6.48 trillion, the new at $8.12 trillion. Looking at the annual growth for 1987, the old data has GDP growing at 3.38 percent while the updated data almost doubled “economic growth” to 6.10 percent, while both data series underperformed the growth of CinC, as published in Barron’s, 8.53 percent.
There are lots of that seen below, but I won’t bore you with the details except to bring to your attention the 22 Yr. Change seen at the bottom of the table.
© Mark Lundeen
As seen in the 22 Yr. Changes, it’s obvious the purpose of measuring GDP in chained dollars is to deflate the current dollar amounts. However, whatever way the BEA measures GDP and the Federal Reserve’s annual inflation of the supply of dollars that GDP is measured in, is typically at a higher rate.
This data originates in 1929, so I constructed the following table listing the data by decades. The differences in “economic growth” as measured in current and chained dollars become apparent. “Growth” from 1929 to 2009, as measured in current dollars, is over 13,000 percent of the data downloaded in 2010 and 2019. In chained dollars, “economic growth” was considerably smaller, less than 1,500 percent in both 2000 and 2009 chained dollars.
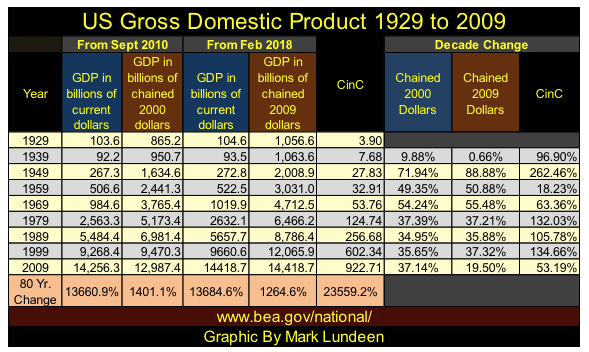
© Mark Lundeen
But no matter how you care to measure U.S. GDP, in current or chained dollars, the number of greenbacks being “injected” into the economy overwhelms your “economic growth.” Looking at the data in terms of factors, GDP, as measured in 2009 chained dollars, is up by a factor of 12.64 since 1929 while CinC has grown by a factor of 235.59. This is considerably more than even the increase in GDP as measured in current dollars from the latest download at 136.84. Looking at chained 2009 dollars, monetary inflation has grown 18.63 times more than “economic growth” as measured by the BEA.
In other words, using chained 2009 dollars to measure GDP, the economy of 2009 had produced 12.64 times more goods and services than it did in 1929, but the Federal Reserve has increased the number of dollars used in purchasing those goods and services by a factor of 235.59. The result of inflation outpacing production would be a general rise in prices across the economy.
But monetary inflation and consumer prices aren’t bolted together. There are times where inflation flows into consumer prices, as from 1939 to 1981. And other times where inflation flows into financial asset valuations, as from 1982 to the present.
“Monetary policy” may demand that “liquidity” be injected into the banking system, and that the banks in the Federal Reserve System bias their operations to make loads to this, but not for that. But it’s a fact that once a dollar is created and injected somewhere in the economy, it ultimately becomes the free agent of whoever owns that dollar. For instance, bitcoin’s amazing rise wasn’t the result of “monetary policy” but of forward-thinking people with more dollars than they believed is healthy, buying bitcoins at no matter the cost.
Here’s a link to New Jersey’s Morris County Library. This wonderful library has compiled annual prices for consumer good and real estate from 1900 up to 2014.
http://mclib.info/reference/local-history-genealogy/historic-prices/
In 1929, the first year of the BEA’s GDP data, one could purchase a new Chevrolet for $525, or purchase a five-room bungalow for $5,200. I’ll let my readers do their own research to see what their equivalent items’ prices had increased to in 2009.
The following chart plots the BEA’s 2000 (Blue Plot) and 2009 (Red Plot) chained dollar GDP data. Keep in mind that for any year in the data, only so much in terms of goods and services were actually produced. Yet, by measuring these goods and services in terms of a flawed unit-of-account (dollars, chained or otherwise) the government manipulates the public’s perception of “economic growth.”
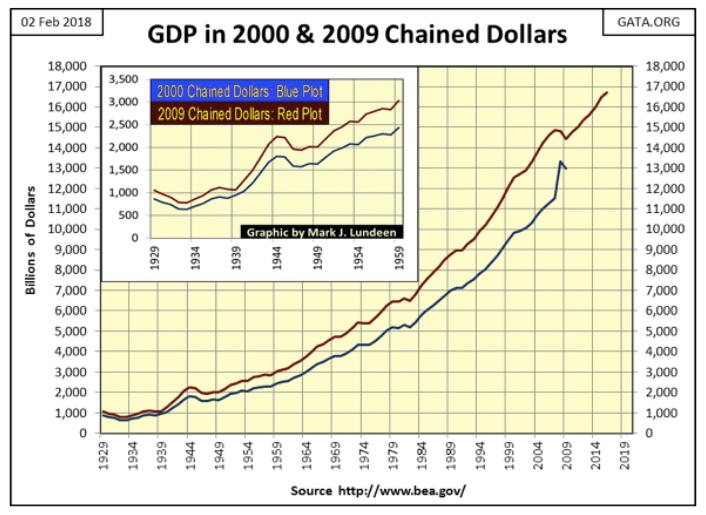
© Mark Lundeen
And the manipulations have been significant. Taking the spread between 2000 and 2009 chained dollars seen in the chart above, the BEA increased GDP from 1929 to 2009 by over 23 percent for each year (chart below), with the exceptions of 1939, 2008, and 2009.
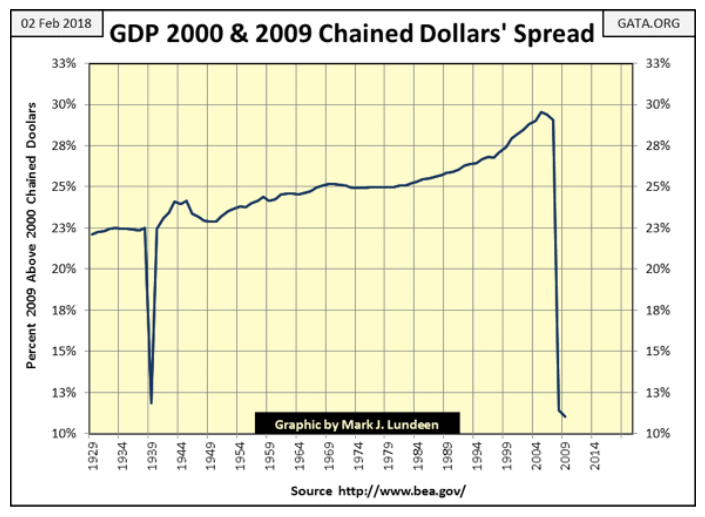
© Mark Lundeen
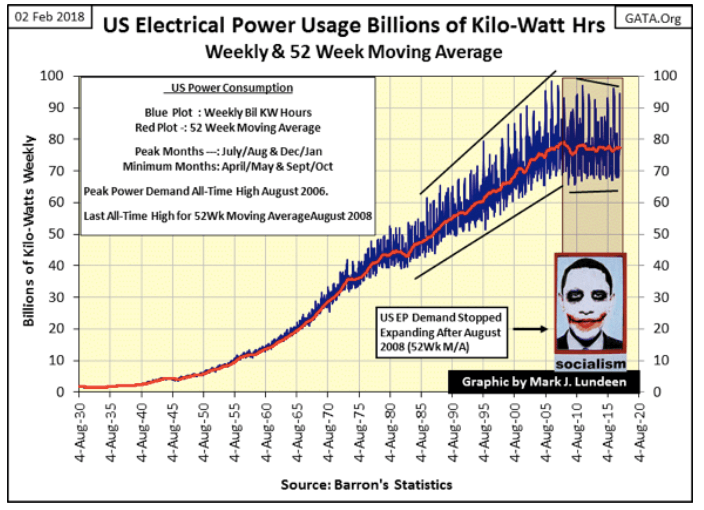
Personally, I believe the following chart of electrical power (EP) consumption’s 52Wk M/A (Red Plot) from 1929 to the present is a better measurement of true growth in GDP. From August 1930 to this week, this data for EP was measured in kilowatts, an engineering unit of measurement that hasn’t changed since it was first constructed in the 19th century.
© Mark Lundeen
So far President Trump has made much of the “economic growth” of the past year, and maybe the Commerce Department’s BEA has it right this time. But the last all-time high in EP was in August 2008. Until we once again see the United States’ economy consume EP in a record amount, I’ll have my doubts whether or not the economy has actually grown.
(Featured image via Deposit Photos)
—
DISCLAIMER: This article expresses my own ideas and opinions. Any information I have shared are from sources that I believe to be reliable and accurate. I did not receive any financial compensation in writing this post. I encourage any reader to do their own diligent research first before making any investment decisions.


Bitcoin and Ethereum Stabilize as Markets Watch ETF Flows and Institutional Moves
Bitcoin and Ethereum are stabilizing early in the week, with BTC near $63,000 and ETH around $1,650, though ETF outflows...


Sugar Markets Rise Slightly Amid War, Oil Price Pressure, and Strong Global Supply
New York and London prices rose slightly last week as the Iran war continued and the Strait of Hormuz stayed...


German Fintech Investment Slumps as AI Becomes Key Focus
German fintech investment has sharply declined, with KPMG reporting a 60–76% drop in funding and fewer deals, reflecting a global...


TG Therapeutics Advances Subcutaneous Briumvi With Strong Trial Results and Rising Sales Momentum
TG Therapeutics reported strong Phase 1 results for subcutaneous Briumvi in multiple sclerosis, exceeding expectations in bioavailability, safety, and tolerability....


Morocco at an Energy Crossroads Amid Global Gas Volatility and Critical Minerals Opportunity
IEA 2026 report portrays Morocco at an energy crossroads: it delays a $1B LNG project amid volatile gas markets, Strait...
 |
|
 |  |
 |
|
-

 Crypto1 week ago
Ethereum Under Pressure as Bitcoin Stalls and Crypto Tensions Rise
-

 Africa2 weeks ago
Moroccan Airports See Strong Growth in 2025 with Rising Passenger Traffic and Solid Financial Performance
-

 Crowdfunding6 days ago
Prestadero Sees Rising Female Loan Participation in Mexico
-

 Crypto2 weeks ago
DeFi Hacks Surge in 2026, Exposing Major Security Weaknesses in the Crypto Industry
You must be logged in to post a comment Login