Markets
How the firing of James Comey affected the stock markets
The stock markets appeared to take it in stride ending the week slightly off (except for the NASDAQ), while gold and silver reversed course and closed marginally higher on the week after making new lows for the recent move to the downside.

There really was only one story this past week—the firing of FBI Director James Comey. It overshadowed the election of Emmanuel Macron as President of France, a centrist candidate. The shock waves from the firing of Comey are still reverberating. Interestingly, it has been compared to Richard Nixon’s “Saturday Night Massacre” on October 23, 1973 when he fired Watergate special prosecutor Archibald Cox, leading to the resignations of Attorney General Elliot Richardson and Deputy Attorney General William Ruckelshaus who had refused Nixon’s orders. Less than a year later, Nixon resigned in disgrace rather than face certain impeachment.
Our focus here is not, however, on the political machinations that are sure to continue for some time, but the immediate and potentially ongoing impact on markets. The stock markets appeared to take it in stride ending the week slightly off (except for the NASDAQ), while gold and silver reversed course and closed marginally higher on the week after making new lows for the recent move to the downside. The gold stocks enjoyed a solid advance this past week. The gains and the reversal in the precious metals occurred primarily after the firing of Comey, suggesting some concern. The stock markets weakened following the firing.
Model Portfolio
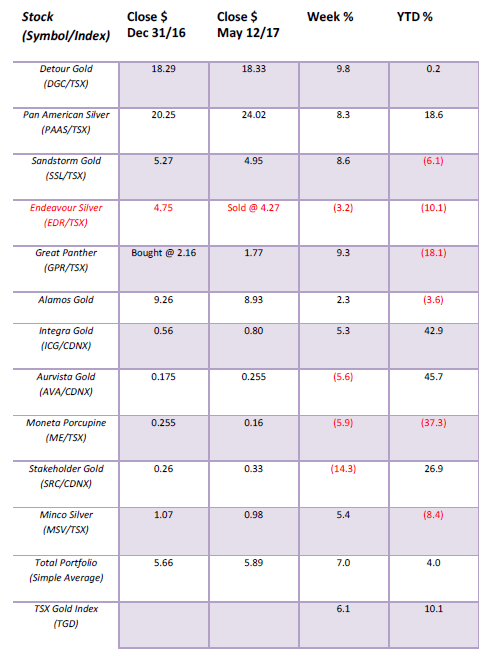
Decent bounce back for the gold stocks and for our model portfolio that gained 7% on the week vs. a 6.1% gain for the TSX Gold Index (TGD). The big winner was Detour Gold (DGC/T) while Stakeholder Gold (SRC/V) suffered a bit. It was an encouraging week as gold and silver made new lows for their move down then reversed closing higher while the gold stocks as represented by the TGD and the Gold Bugs Index (HUI) did not make new lows and both closed nicely higher. Great Panther (GPR/T) is cheap at these prices as are the gold stocks in general, as we will show later.
© David Chapman
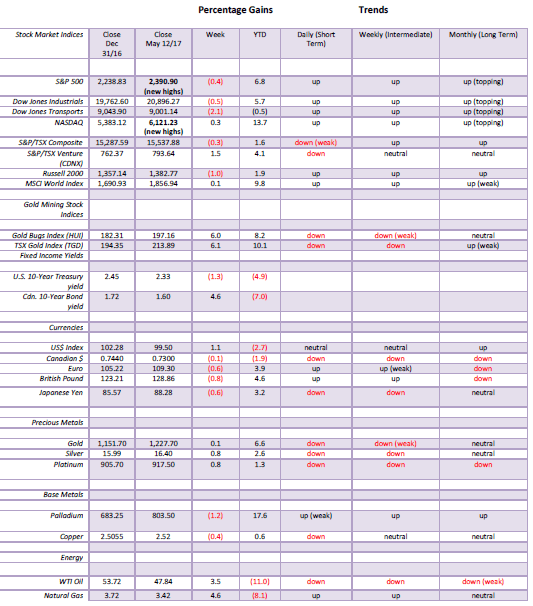
MARKETS AND TRENDS
© David Chapman
Note: For an explanation of the trends, see the glossary at the end of this article.
New highs refer to new 52-week highs.
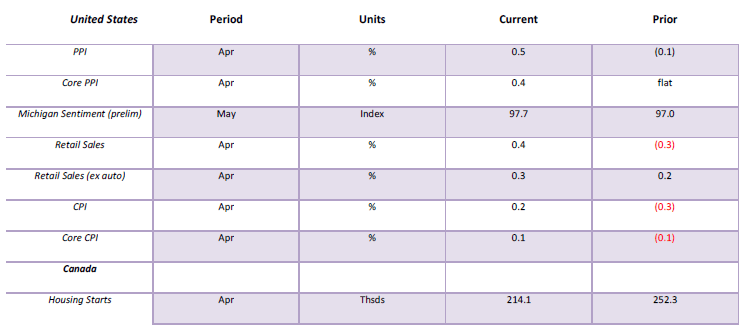
Key Economic Numbers Week May 8 – May 12, 2017
(Source)
(Source: www.shadowstats.com, www.data.bls.gov, www.statcan.gc.ca, www.tdeconomics.com)
Note: % M/M unless otherwise noted
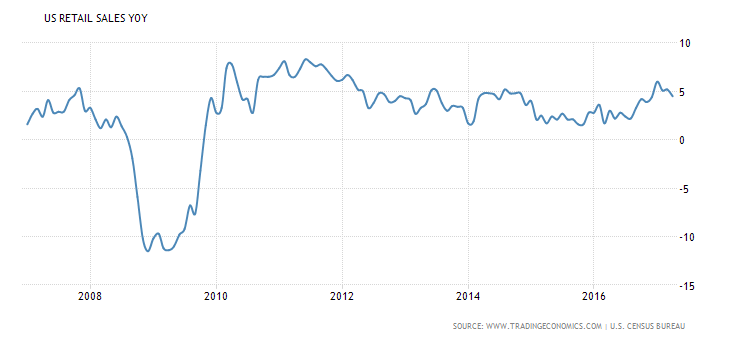
It was a very light week for economic numbers. Retail sales have been at best sluggish despite what appears to be a decent April. Year over year retail sales in the US are up 4.5% but that is down from the 5.2% reported in March. The trouble was the market had expected another reading of 5.2%. Strip out inflation and retail sales are just about 2%. But once you take population growth into consideration coupled with inflation retail sales remain well below a peak seen in 2006 before the Great Recession. When you strip out auto purchases, the result is somewhat better but it too remains below the peak of November 2007.
(Source)
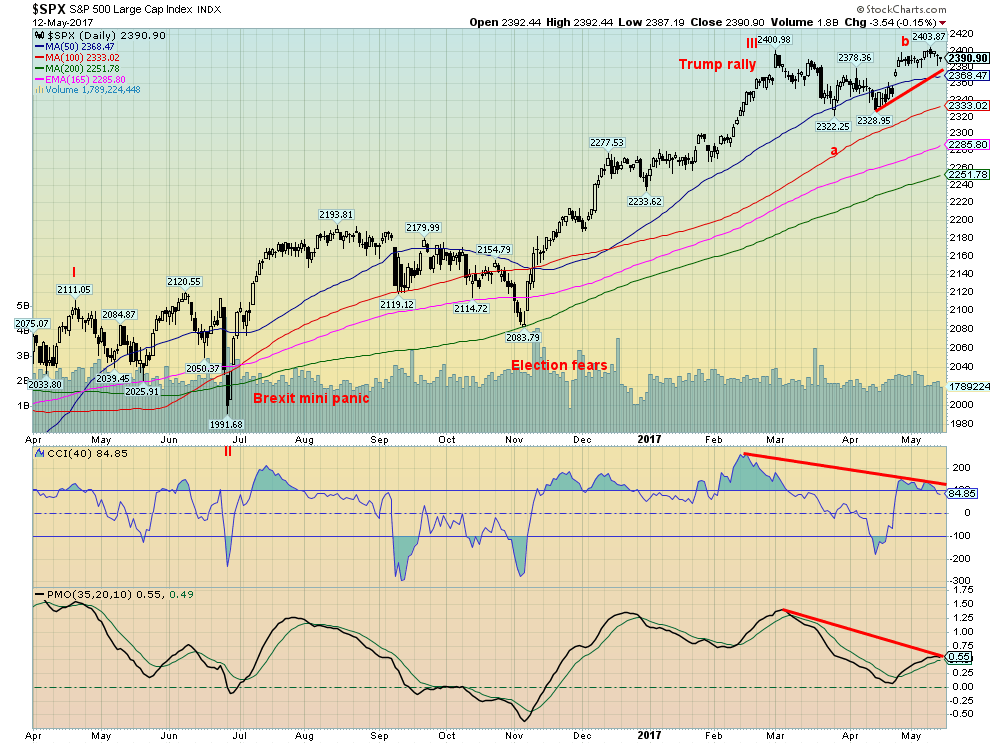
After making marginal new highs unconfirmed by the Dow Jones Industrials (DJI) the S&P 500 appears to be rolling over once again. Momentum indicators as one can see are also rolling over with negative divergences. The S&P 500 made new highs (all-time) but the momentum indicators did not, another divergence. Despite what appears to be an ongoing correction following the wave III peak on March 1, 2017 the S&P 500 has been trading in a sideways pattern. We suspect the index is in the process of making an abcde type correction with waves cde to come. Once this wave is complete (wave IV) we expect the S&P 500 will then make new all-time highs. However, the high most likely to come during the summer months may only make a slight new high or even fail the previous high. Still, it should be the final high before a more substantial correction sets in.
The market is now up for eight years with only two corrections of any substance (2011 and 2015). Both were relatively short lived and both were under 20%. The only other time we can recall such a long sustained period of market strength was seen during the 1990s and the 1950s. Long periods of relatively calm and sustained upward markets are often followed by periods of turbulence and volatile markets. While it is easy for say a more volatile period is overdue we acknowledge that the current period could continue. The calm of the 1950s was later followed by turbulence and volatility into the 1960s and 1970s. The sustained upward market of the 1990s was followed by the turbulence and volatility of the 2000s. Breakdown levels start under 2,300.
So, one shouldn’t be too complacent at these levels.
(Source)
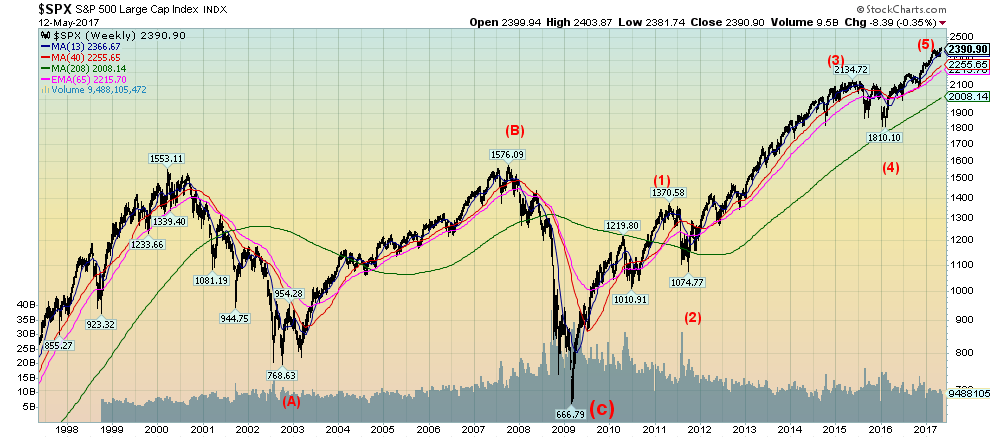
This is a longer term look at the S&P 500 showing the action since the late 1990’s. The market top of March 2000 was most likely the culmination of big wave 3 to the upside starting back in the 1980s. Wave 2 was the huge correction through the 1970s while wave 1 culminated in 1966. The huge Grand Cycle wave starts from the depths of the Great Depression. The 2000’s correction highlighted by the tech wreck (wave (A)) followed by a recovery rally (wave (B)) and ended with the Great Crash of 2008 (wave (C)). This, we suspect, was wave 4. Since March 2009 the market appears to have been working on wave 5. We now believe we are in the 5th of the 5th which as noted we suspect will be completed sometime this summer. Another sign that investors should be cautious as the market may be topping out. What could follow is a steep correction.
(Source)
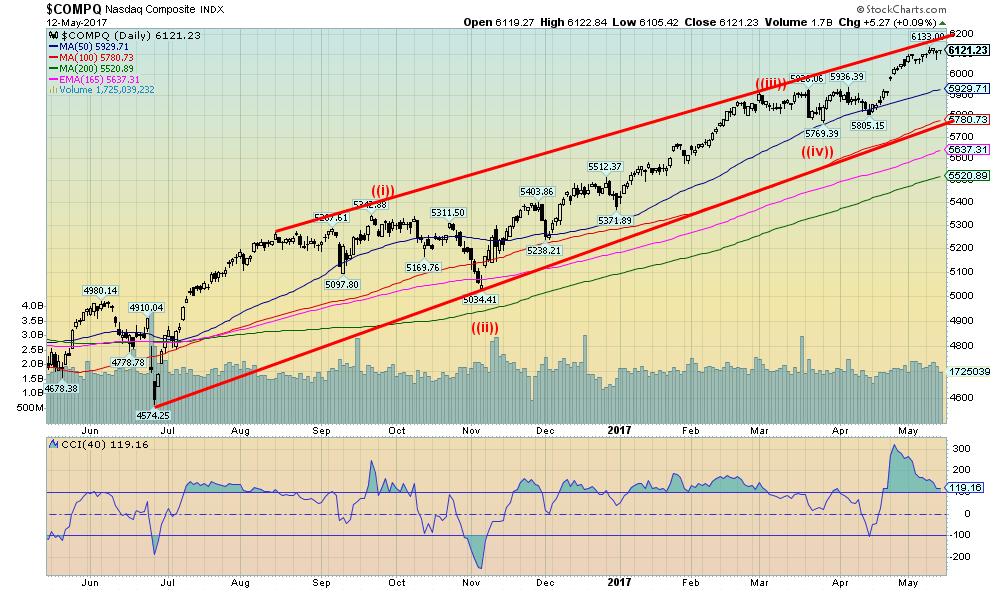
The NASDAQ also made new all-time highs this past. Overall the NASDAQ has been the strongest index. The S&P 500’s new high was barely above the previous one while the DJI and the Dow Jones Transportations (DJT) remain below their previous highs, a divergence. We suspect the NASDAQ could be approaching an important top although that high may be seen later in May or even early June. Momentum is rolling over. A breakdown under 5,900 could confirm that a top is most likely in.
(Source)
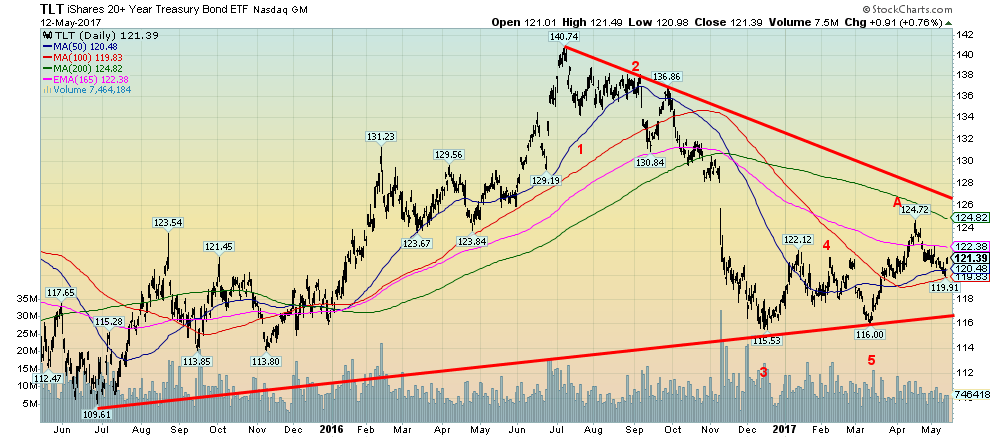
US Treasury bonds as represented here by iShares 20-year + Treasury bond ETF (TLT) appear to have completed a five-wave decline from the high in July 2016. It was an all-time high. The decline was the steepest seen since 2012-2013. The run-up to 124.72 appears to be the A wave out of a correction to the decline. We continue to emphasize bond cycles wherein they tend to move in cycles of six years with a range of 5 to 8 years. In turn, those six-year cycles subdivide into either two three-year cycles or three two-year cycles. Starting back in 1981 at the major lows clear 6-year cycle lows were seen in 1987, 1994, 2000, a double bottom in 2007–2008 and 2013. The next six-year cycle low would be due anywhere from 2018 to 2021. The current low would fit well with a subdivide into two three-year cycles. The question is how high can we rally in the interim. Odds do not favor a run to new all-time highs. 126 would provide resistance and would partially fill that gap left back in November 2016.
(Source)
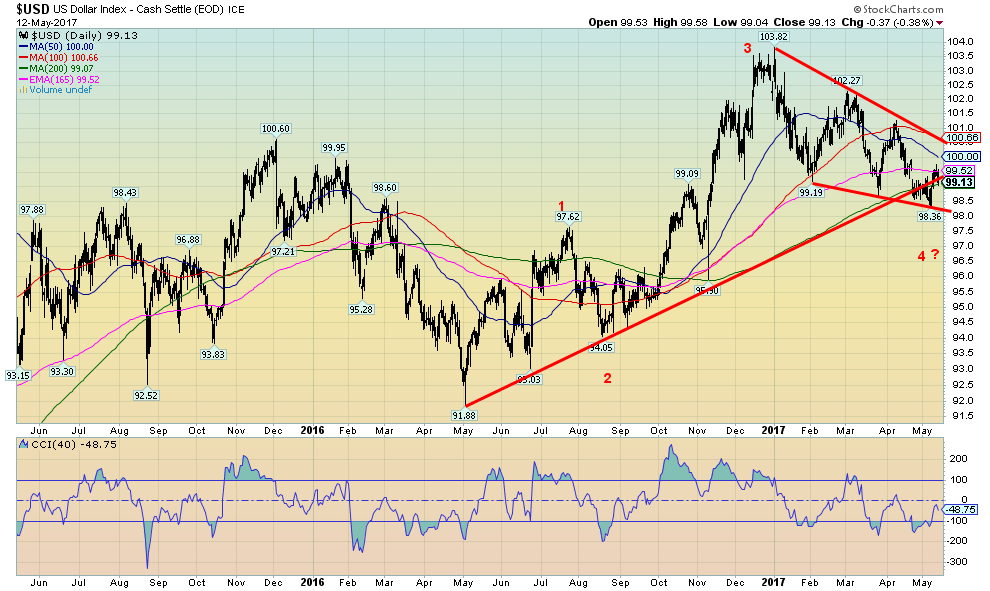
We remain in a bit of a quandary about the US$ Index. On one hand, the wave count from the 91.88 low back in May 2016 would suggest that we have completed three waves to the upside and possibly a fourth with the fifth wave to come. We have long held potential targets up to 106–108. The initial thrust to the upside failed at the 165-day exponential MA just above 99.50. Further resistance lies above at 100 and up to 100.70. Above 100.70 the US$ Index looks stronger especially above 101. The pullback seen late in the week appears to be have been driven by the Comey firing given the drop basically coincided with it. Key below is 98 to 98.50. As long as that holds on the pullback the US$ Index could resume its upward move. If it breaks under 98 then targets could be down to 94 and the entire wave structure would be in doubt. Note the high of wave 1 at 97.62. A break under that level would suggest that the move to 103.82 was the top and that we are now starting a downward move.
(Source)
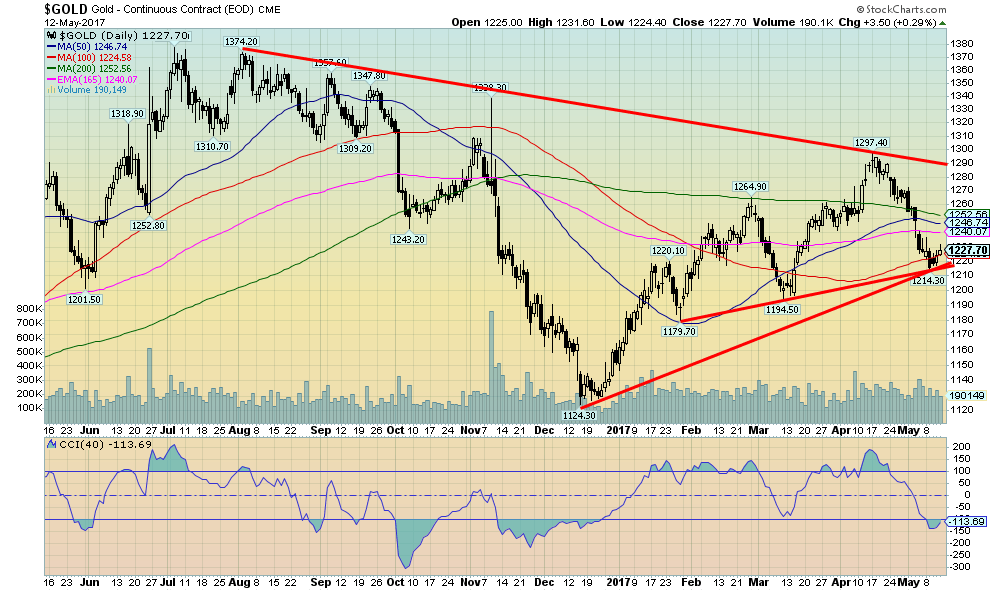
Gold came down and tested an uptrend line from the December 2016 low that also coincided with a trendline from the low of January 2017. Gold also held above its low of March 2017 at $1,194. Gold made new lows this past week for the move down from $1,297 then reversed and closed the week marginally higher (a gain just under 0.1%). Gold diverged with silver as silver did take out its March low. The gold stocks also diverged, as both the Gold Bugs Index (HUI) and the TSX Gold Index (TGD) did not make new lows this past week along with gold and silver. Instead, they had a stellar week gaining 6%. Gold sentiment remains largely neutral but as we note below the commercial COT improved quite a bit. Key resistance for gold is seen at $1,235 and up to $1,250. Above $1,250, gold improves and a run back to the April high of $1,297 is probable. Key support is now at the recent low of $1,214 then down to $1,200.
We remain quite positive towards gold once this corrective period ends. As we noted earlier the Comey firing play could an important role in starting a significant rally. Gold rebounded following the firing and ensuing rancor that surrounded the firing. Gold had a reversal week albeit small. Follow through to the upside is essential this week if we truly have made a low. We would have preferred even more negative sentiment but if the December low was truly important then pullbacks in a new up-leg can see sentiment pull back but not get truly negative as it was in December 2016 or December 2015. Key as well is the US$. Given the US$ Index reversed down at the end of the week a breakdown in the US$ would be quite positive for gold.
(Source)
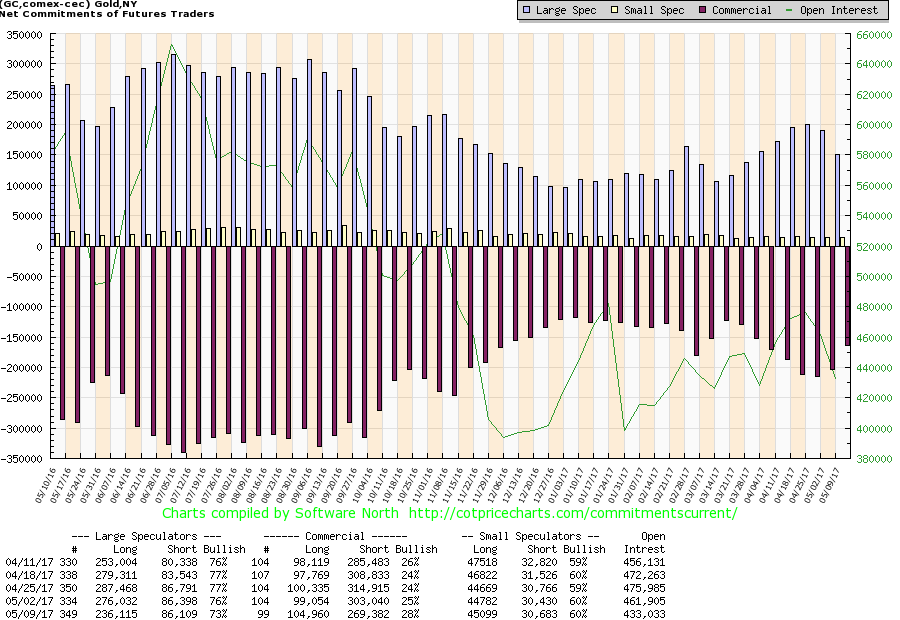
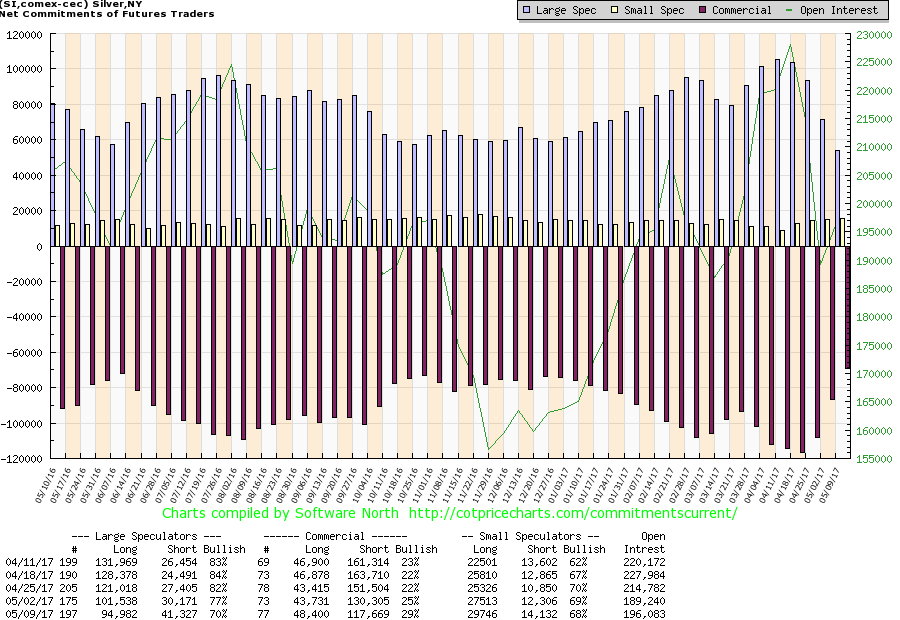
The week saw a good improvement in the commercial COT. It jumped from 25% bulls to 28% bulls the best level in weeks. Short open interest fell roughly 34,000 contracts while long open interest rose roughly 6,000 contracts. The large speculators COT (hedge funds, managed futures etc.) fell to 73% from 76% as long open interest was slashed by roughly 40,000 contracts. Open interest also declined suggesting that buying was short covering and not new longs. We hope to see further improvement for the commercial COT in this week’s report.
(Source)
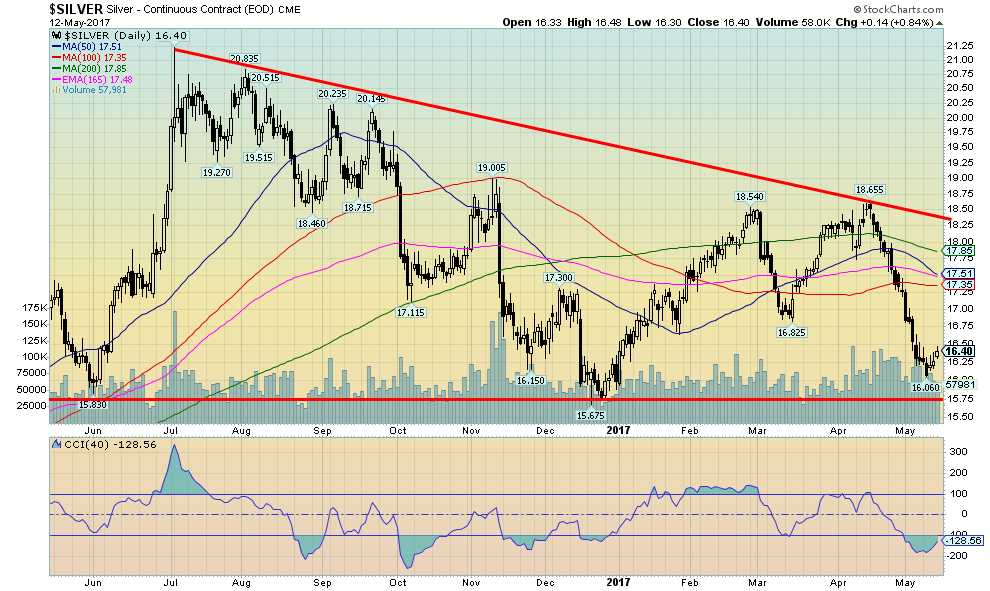
As we noted under gold, silver made new lows this past week below the March 2017 low. Like gold, silver made a new low for the move down then reversed and closed marginally higher on the week by 0.8%. Silver sentiment reached lower levels than gold on this move down but the levels have never approached the December lows. There is considerable support for silver in the $15.75 to $16 range. The low thus far is $16.06. Irrespective of whether we have made a low and are now embarking on a new up leg, silver’s sentiment was low enough to at least warrant a corrective rebound. It has been down almost persistently since the high in mid-April. There is resistance at $16.80 then up to $17.35. Key resistance is in the $17.35 to $17.85 zone. But once above that level, a challenge to the $18.66 high of mid-April should get underway.
(Source)
Silver’s COT proves interesting. First, the commercial COT jumped from 25% to 29%. Second, there was a 5,000-contract jump in long open interest coupled with a 13,000 decline in short open interest. The large speculators COT dropped to 70% from 77% and was at 84% only four weeks ago. How things change quickly. Unlike gold, there was a jump in open interest by roughly 7,000 contracts. Third, note how large speculators long open interest continues to hover around 95,000 to 100,000 open interest. This suggests to us that there is a strong core position being held by the hedge funds and managed futures accounts. This is important as it suggests that longs are not being liquidated.
(Source)
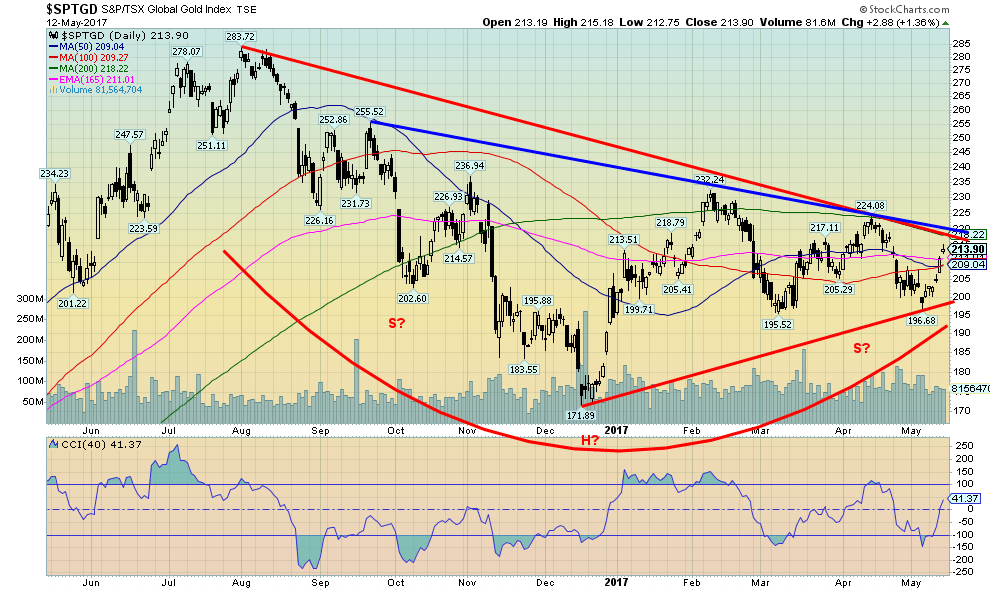
The gold stocks as represented here by the TSX Gold Index (TGD) had a stellar 6% up move this past week. The Gold Bugs Index (HUI) also gained 6%. Unlike gold and silver, the gold stocks (TGD) did not see new lows this past week. The CCI indicator improved rapidly from negative to positive, with the trend shifting from down to up albeit a weak one so far. The TGD could be making an important bottom pattern. The pattern forming appears to be a large head and shoulders bottom pattern. If there is a caveat, it is that the right shoulder did fall below the left shoulder. It’s a bit awkward as the perfect head and shoulders pattern is one where the right shoulder stays above the low of the left shoulder. The neckline is currently around 220. A solid breakout above that level could, in theory, suggest potential targets up to 300/305.
GLOSSARY
Trends
Daily – Short-term trend (For swing traders)
Weekly – Intermediate-term trend (For long-term trend followers)
Monthly – Long-term secular trend (For long-term trend followers)
Up – The trend is up.
Down – The trend is down
Neutral – Indicators are mostly neutral. A trend change might be in the offing.
Weak – The trend is still up or down but it is weakening. It is also a sign that the trend might change.
Topping – Indicators are suggesting that while the trend remains up there are considerable signs that suggest that the market is topping.
Bottoming – Indicators are suggesting that while the trend is down there are considerable signs that suggest that the market is bottoming.
—
DISCLAIMER: This article expresses my own ideas and opinions. Any information I have shared are from sources that I believe to be reliable and accurate. I did not receive any financial compensation in writing this post, nor do I own any shares in any company I’ve mentioned. I encourage any reader to do their own diligent research first before making any investment decisions.


Advances in Biomarkers and Targeted Therapies Transform Kidney Care in Autoimmune Disease
New biomarkers and targeted therapies are reshaping the management of kidney damage in autoimmune diseases like lupus and vasculitis. Experts...


Bitcoin Rises on Iran Deal as Crypto Markets React to AI and SpaceX News
Bitcoin rose above $65,000, gaining about 5% as a tentative Iran war agreement boosted markets. ETFs still show weekly outflows....


Rising Inflation, Fed Uncertainty, and Market Excess Amid War and SpaceX Mania
Rising inflation, driven by war, debt, and money growth, puts the Fed in a difficult position ahead of its meeting....


SpaceX IPO Sparks Déjà Vu as Market Risks Loom and Gold Bulls Stay Hopeful
The author compares the 2000 AOL Time Warner merger to SpaceX’s planned IPO, warning it may signal a market top....


The TopRanked.io Guide to 2026’s Biggest and Best Affiliate Opportunities
Want to earn affiliate commissions on literal billions of dollars worth of revenue? Then this week, we've got something special...
 |
|
 |  |
 |
|
-

 Africa2 weeks ago
Bank of Africa Leads Winners at African Banker Awards
-

 Impact Investing5 days ago
Transition to a Sustainable Economy as a Strategic Global Shift in a Fragmented World
-

 Cannabis2 weeks ago
Tilray Expands in Europe as Medical Cannabis Market Grows
-

 Impact Investing3 days ago
Eni Advances Energy Transition with Major Investment and Emissions Cuts
You must be logged in to post a comment Login