Markets
The global stock markets lost $1 trillion due to Trump’s and Kim Jong Un’s war of words
US and global stock markets had been hurtling ever higher and valuations are near record. A correction was most likely overdue. The war of words and tensions over North Korea was the trigger.
It hardly seems much of a contest: the world’s most powerful nation both economically and militarily vs. one of the poorest nations on earth but with a strong, or at least large, military. So far, the war has been rhetorical as both sides, though their respective leaders hurl superlatives at each other that usually end in one of them being engulfed in a ring of fire. The words, however, have unnerved global markets.
This past week saw upwards of $1 trillion shaved from global stock markets triggered by Donald Trump’s and Kim Jong Un’s ongoing war of words. The last word has so far gone to Donald Trump who did his usual tweet, asserting that “military solutions are now in place, locked and loaded, should North Korea act unwisely.” Earlier, North Korea had threatened to land a missile near the US Pacific territory of Guam in response to Trump’s promise to unleash “fire and fury.” The world can only shudder at the thought of a nuclear exchange. But words are having an impact as stock markets “hurled” and safe havens of Japanese Yen, Swiss Francs, US Treasuries, and German Bunds and gold jumped higher.
US and global stock markets had been hurtling ever higher and valuations are near record. A correction was most likely overdue. The war of words and tensions over North Korea was the trigger. How deep the correction goes is anybody’s guess at the moment. Numerous pundits believe that the odds of actual war between the verbal combatants are low, but that a correction was probably overdue and this could result in a buying opportunity.
The likelihood is that the rhetoric and war of words is liable to continue for some time. Even if North Korea were to launch more missiles into the sea, it most likely would up the ante and rattle markets further. An overvalued market and saber rattling is a recipe for the correction. Inflation numbers released this past week were benign. As a result, the combination of the saber rattling and a stumbling market could keep the Fed on the sidelines through the rest of the year. And that is not even getting into the looming fight over the budget, tax reform and the debt ceiling. Also, let’s not forget the ongoing investigation into the Trump campaign and the Russians being conducted by special counsel Robert Mueller.
The investigation into the Trump campaign continues as subpoenas have been issued and this past week subpoenas were sent to global banks for account and records of transactions involving Paul Manafort the Trump campaign’s former campaign manager. Others included Manafort’s son and a Russian oligarch. Manafort also confirmed the FBI had raided his home. The Russian ties of former National Security Advisor Michael Flynn are also under investigation as are the real estate deals of purchases of Trump properties by wealthy Russians going back a decade. This probe could yet prove dangerous for the President and rattle markets further.
Yet another potential problem has loomed into the spotlight that could rattle markets further if things worsen. The events in Charlottesville, Virginia between alt-right groups and protesters that resulted in a riot, the presence of riot police and the National Guard, three deaths and a number of arrests are not just isolated incidents. These confrontations have become almost a daily occurrence somewhere in America. Except now, they are showing signs of becoming more deadly and violent. At what point are markets forced to take notice?
Rhetorical saber rattling, deeper probing into the President’s campaign and the Russians, deepening clashes between groups in America, coupled with upcoming controversial legislation are a potential deadly recipe to send markets spinning and safe havens soaring. The world is being buttressed by a serious change. We see climate change, technological change, and globalization change where the world is moving from being interconnected to interdependent—, which means if there is a collapse in one country, it could quickly spread to others. These are the catalysts. Any or all could become the trigger.
(Source)
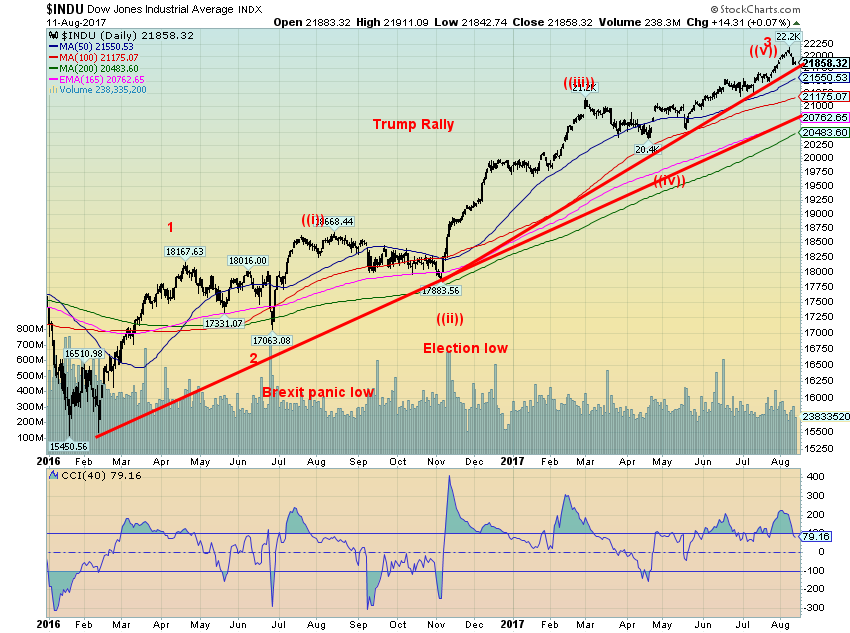
While the hiccup that got underway this past week as global stock markets reacted negatively to the ongoing war of words between US President Donald Trump and the North Korean Supreme Leader Kim Jong Un, the drop is not yet sufficient to say that a top is in. The Dow Jones Industrials (DJI) did make new all-time highs this past week, as did the S&P 500. The high was seen Tuesday August 8, 2017 at 22,179 and for the S&P 500 at 2,491. The DJI and the S&P 500 promptly reversed and closed down on the week losing 1.1% and 1.4% respectively. The DJI and S&P 500 also put in an outside reversal week meaning they made new highs above the previous week’s high and made lows below the previous week’s low before closing lower. That, in technical parlance, is known as a key reversal. Coming as it did on the weeklies, it takes on even more potential meaning.
Naturally, the key reversal week needs to follow through. The uptrend line from the February 2017 low is currently near 21,750. The 50-day MA at 21,550 is sure to provide some support so a break down under that level would be another confirmation that a top could be in. The last weekly low of any significance is at 21,200. A break below that level would be a final confirmation that a top is in. For the S&P 500, it has already broken the uptrend line from the November 2016 election low. A more significant decline could get under way below 2,400.
With the DJI and the S&P 500 making new highs this past week while no other indices did, this is a potentially significant divergence. All stock indices fell this past week, some more than others. The NASDAQ dropped 1.5%, the Dow Jones Transportations (DJT) lost 0.8%, and particularly hard hit was the Russell 2000 losing 2.7%. When sell-offs get underway small cap stocks are hit harder as they can’t offset their earnings with predominantly foreign income as the big cap stocks that dominate the major indices can. With the weakening US$ the big cap stocks whose earnings are largely out of the country benefit more so than small cap stocks whose earnings are primarily domestic.
But other indices also tumbled. The S&P TSX Composite lost 1.7%, led down by Energy, Health Care and Information Technology. At the other end of the spectrum, Golds had a strong up week. Global stocks fell as well. The MSCI World Index was off 1.6%, the German DAX was down 2.3%, the Paris CAC 40 off 2.7%, the London FTSE lost 2.7% as well, while the Tokyo Nikkei Dow (TKN) dropped 1.1%. The Shanghai Index (SSEC) lost 1.6%. And despite strength in golds, the TSX Venture Exchange (CDNX) was off a small 0.4%.
All in all, it was not a good week for stocks. Threats of fire and brimstone from two world leaders can shake markets.
(Source)
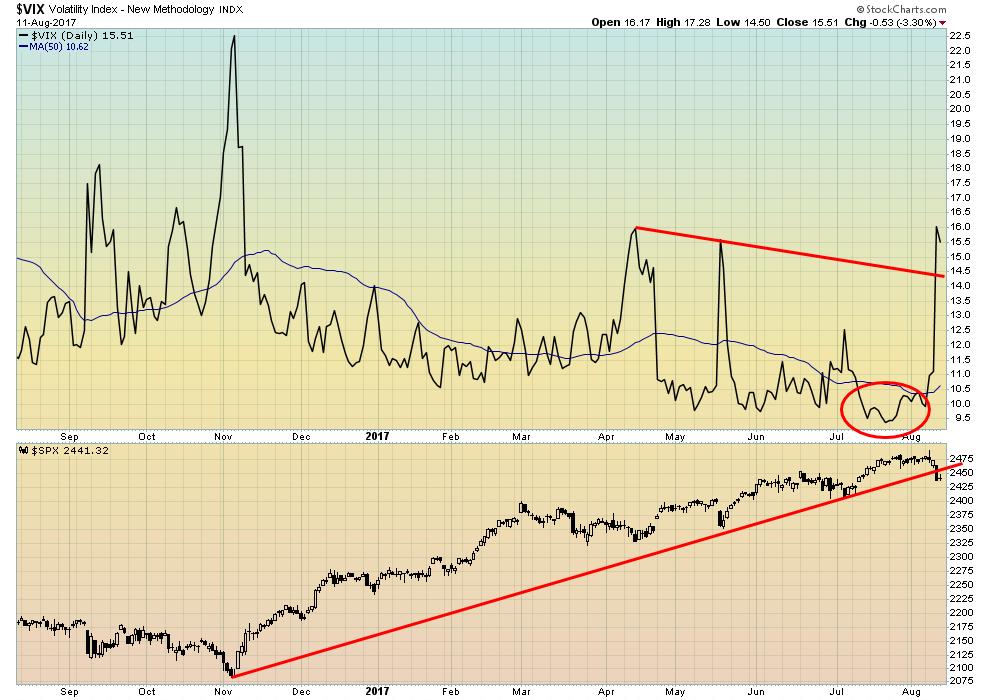
It was probably not a surprise that, following the record low seen for the VIX volatility indicator on July 21, 2017, this past week’s drop in the markets shot the VIX indicator straight up. The VIX indicator took out previous highs seen back in April and May as well. Usually, that indicates that the indicator could move even higher and challenge the high seen at the November election low. Note the S&P 500 has broken its uptrend line from the November election low as well. The short-term trend of the S&P 500 has also turned down, albeit the downtrend is still weak.
(Source)
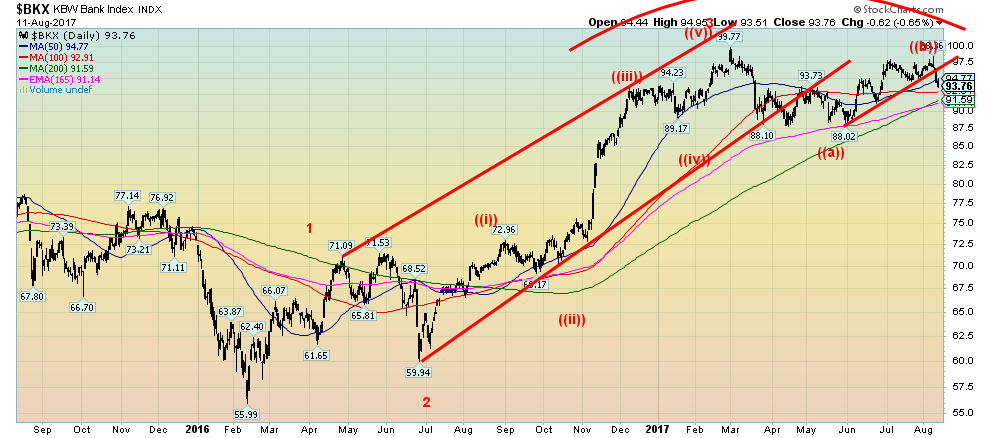
The KBW Bank Index (BKX) may already be in the process of making its wave 4 correction. The BKX topped back in February 2017. Since then, it had dropped finding support at the 165-day EMA and just above the 200-day MA and then rallied back. Now it is turning down, failing to make new highs above the February 2017 high. These negative turndown patterns are not unusual in technical analysis. A break below the May low of 88.02 could see the KBW Index fall to 77.65 as a minimum objective. As long as the index holds above the highs seen in November/December 2015 and the highs of April/May 2016, the KBW Bank Index should regroup and attempt a run back to the former highs near 100. This is in keeping with our premise that a decline at this time should not be a particularly steep one and the markets should regroup and run back to the previous highs. But, as we have noted, it could be a blow off a move or just a feeble move back to make slight new highs or it could once again fail the previous highs. Either way, that move is not expected until 2018. That could then result in the final top.
(Source)
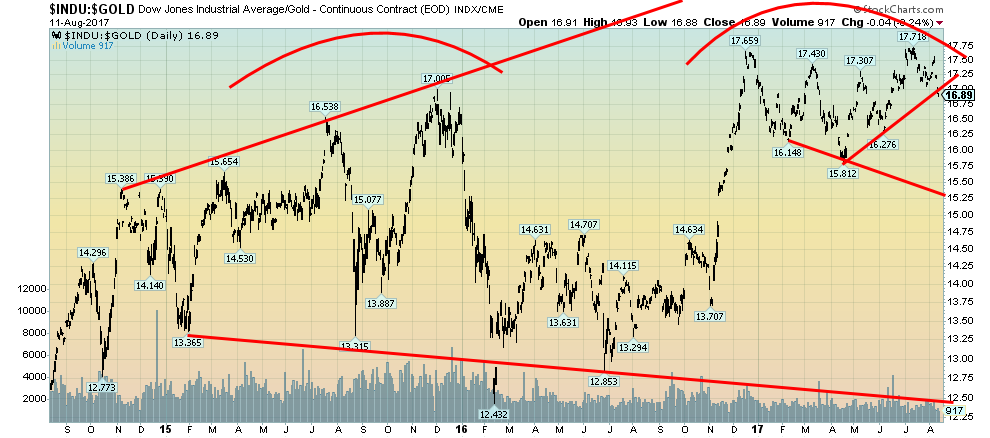
This is the Dow/Gold ratio which topped way back in August 1999 at 44.48. After that, the ratio fell into a long decline as gold was favored over the DJI. It bottomed in August 2011 at 5.02. Since then the pattern has appeared to us as a long corrective. The ratio rose quickly from 2011 to 2015 favoring the DJI over gold. There was a correction to that run-up into 2016 before the DJI began another move that favored stocks over gold. For the past several months, the ratio has been making what appears to be a significant top pattern. It just needs to break down. That may have happened this past week when the ratio cracked under the uptrend line from lows seen in June 2016. Time, of course, will tell but a move under 16.25 (currently 16.89) would confirm a breakdown underway in favor of gold over stocks. Bears watching.
(Source)
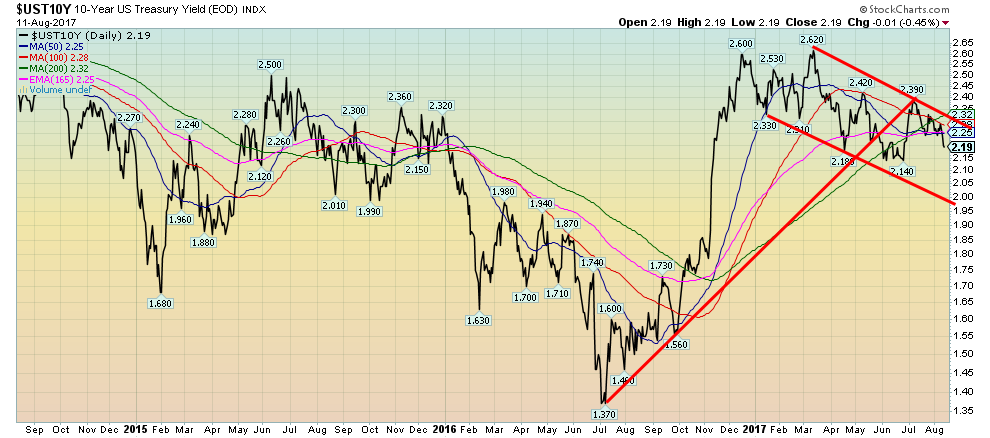
Bonds become a safe haven in times of stress and with the leaders of the US and North Korea making threats against each other this has unnerved markets. Safe havens are a beneficiary. It does, however, seem odd that a safe haven would be US Treasuries of the most indebted nation in the world. Still, the 10-year US Treasury note yield has broken below its key MAs so the odds appear now that we should fall to the lower end of the downtrend channel currently near 2.00%. That’s still a long way off from the July 2016 low of 1.37%. Only a move above 2.30% might change this scenario.
(Source)
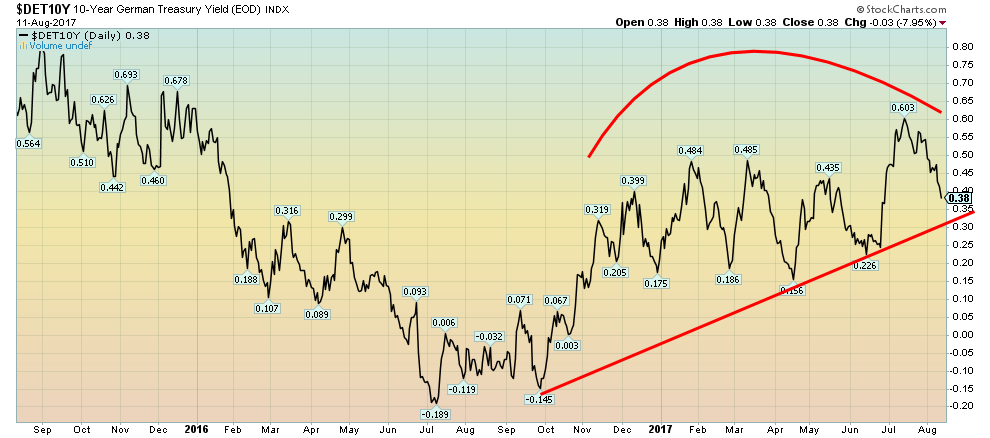
German Bunds also were a safe haven this past week in light of the ongoing shouting match. Bunds need to hold above 0.30% or we could see a return to sub-zero interest rates. The fall has already been rapid from 0.60% down to 0.38% in the space of roughly three weeks. Still, we do appear to be seeing a series of rising highs and rising lows, suggesting rates should actually go higher, not lower. A break below 0.30% might change that scenario, but a break under 0.15% would definitely suggest lower yields ahead.
(Source)
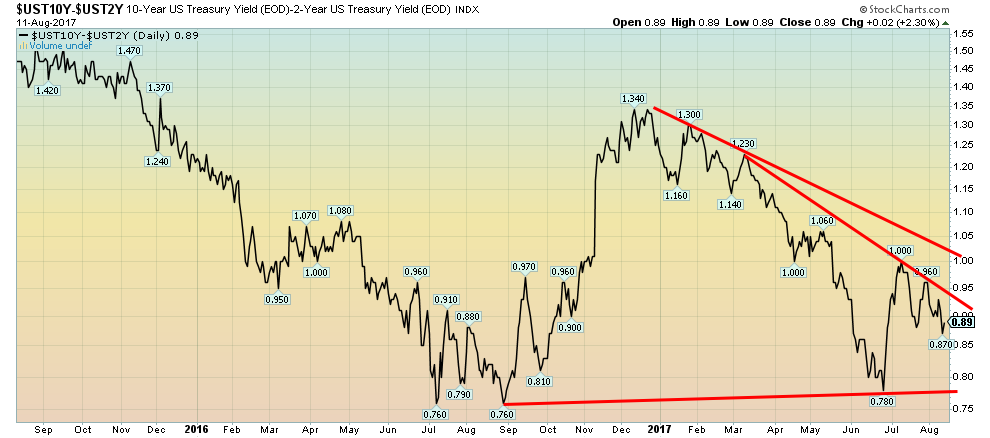
Not much happened with the 2-10 year spread this past week. The spread narrowed a whole 2 basis points (2 bp) from 0.91 to 0.89, although it did dip to 0.87 at one point. Nonetheless, it is well away from negative spreads or even very low spreads that might indicate a recession could be just around the corner.
(Source)
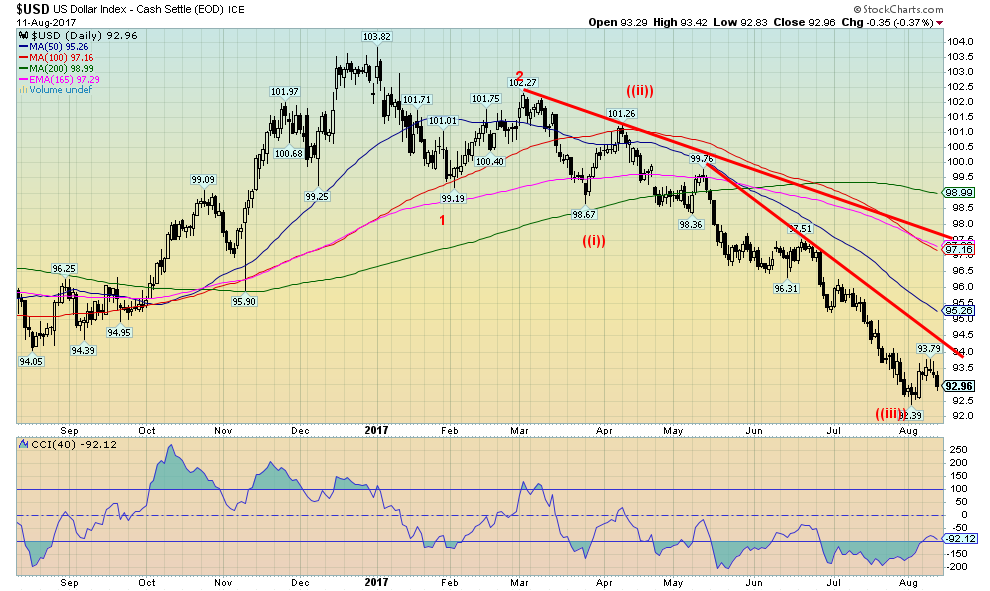
It doesn’t seem to matter too much that the sentiment (Market Vane) towards the US$ is at a 6.5 year low. After a feeble attempt at a rally, the US$ Index turned down again on Friday. So far, the US$ Index is above the 92.39 low of August 2, 2017—but only just. We still have potential objectives down to 91-91.50 so it remains possible that the target will be fulfilled. It seems that instead of rushing into US$ in the face of the ongoing verbal spat (so far) between Trump and Kim Jong Un the rush instead is into Japanese Yen, Swiss Francs, and even Euros. After all, the EU is having a spat with Kim Jong Un so he is not threatening them. Given the Swiss Franc’s close relationship to the Euro, it is sometimes seen as an even safer haven. As to the Japanese Yen, well, the thought is that the Japanese will repatriate funds from overseas and that could mean selling US stocks and converting the proceeds into Yen for repatriation. As long as 92.39, the August low so far holds, the US$ Index should work its way higher. But the reality is we need to cross 94 and preferably above 95 before one can consider that a low may be in.
(Source)
In times of trouble, investors flee to safe havens. This past week the safe havens included currencies—Japanese Yen and Swiss Franc, Bonds – US Treasuries and German Bunds, and precious metals—gold and silver. The currencies were up on the week with the Japanese Yen gaining 1.4% and the Swiss Franc jumping 1.1%. Bonds too were up, or in this case, yields that move inversely to price, fell. 10-year US Treasury notes dropped 3.5% while the 10-year German Bund was off 18.4%. The decline in the German Bund sounds like a lot, but then the yield fell from 0.47% to 0.38%. As to gold and silver, well, gold rose 2.3% while silver jumped 5.1%—their best performance in weeks.
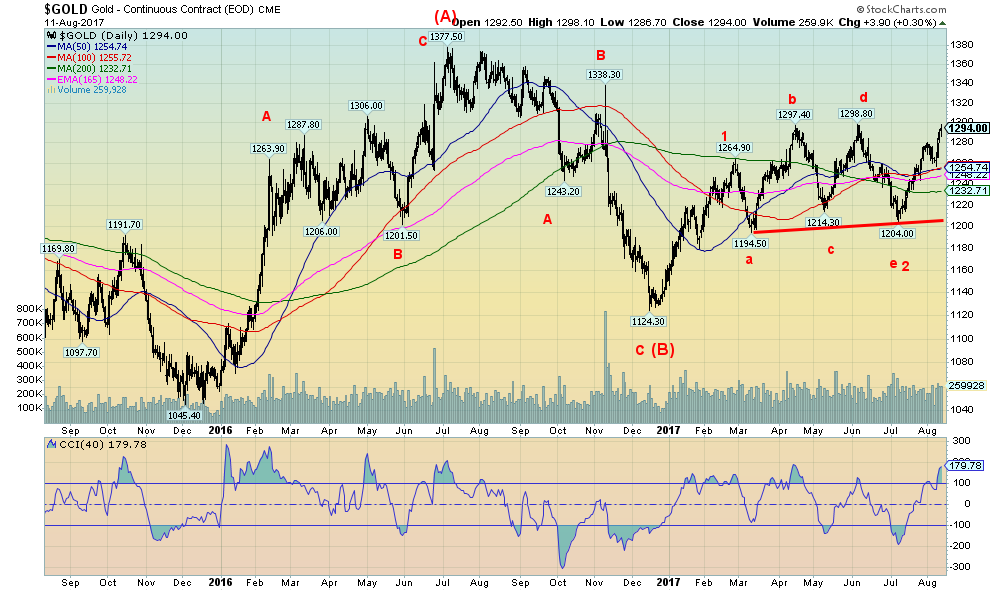
Both gold and silver have been making a five-wave advance from the lows of July 10, 2017. This suggests to us that we should be embarking on what we believe could be the C wave of large ABC type upward move as a reaction to the four-year bear market 2011–2015 that culminated in December 2015. The collapse into the lows of December 2016 was a classic test of the December 2015 low. If we are correct about a C wave advance, we note that C waves can be quite spectacular. Currently, we have a potential target of at least $1,630 for this C wave advance. If the advance were to extend, there is potential to rise to $1,800 and over $2,000.
But before we get ahead of ourselves, we note the following resistance zones. First, gold must break above $1,300. That now appears to be in the cards with this past week’s advance to $1,294. That could come this week. Triple tops are rare and given the five-wave advance to date odds favor breaking above $1,300. The next zone of resistance would come in at the July 2016 high of $1,377. Above that level, a move to $1,400 and even $1,500 could well get underway. Major resistance would be seen at $1,500 to $1,550, which was the breakdown zone in 2013.
A close under $1,270 at this time would at worst we believe put the move on hold but not kill it. There is considerable support from roughly $1,230 to $1,270.
(Source)
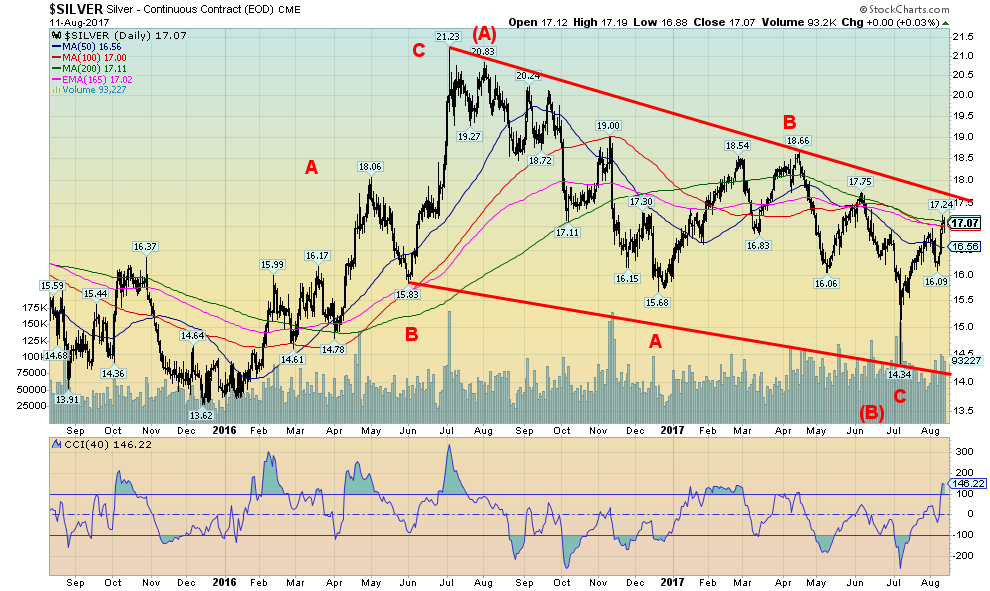
Silver is also displaying bullish signs. Silver led the advance this past week, something we have been looking for, as our expectations are that silver leads, both up and down. While silver has some hurdles here we did manage to regain the 200-day MA (currently at $17.11) and the 165-day EMA (currently at $17.02). We closed over $17 a point we had noted in previous commentaries. The next area of resistance is at $17.50 and $18 but once over $18, we should be poised to challenge the July 2016 high of $21.23. Silver has the potential to target as high as $28 with further potential to $32 and $39 on this C wave move. A close below $16.80 would suggest there is some backing and filling to do before we make the next upward move. Only a close below $16 could start to negate this move. Our expectations are higher prices going forward. Remember we are also into the sweet spot for precious metals seasonals. A sweet spot that can last until late September/early October before a correction sets in.
(Source)
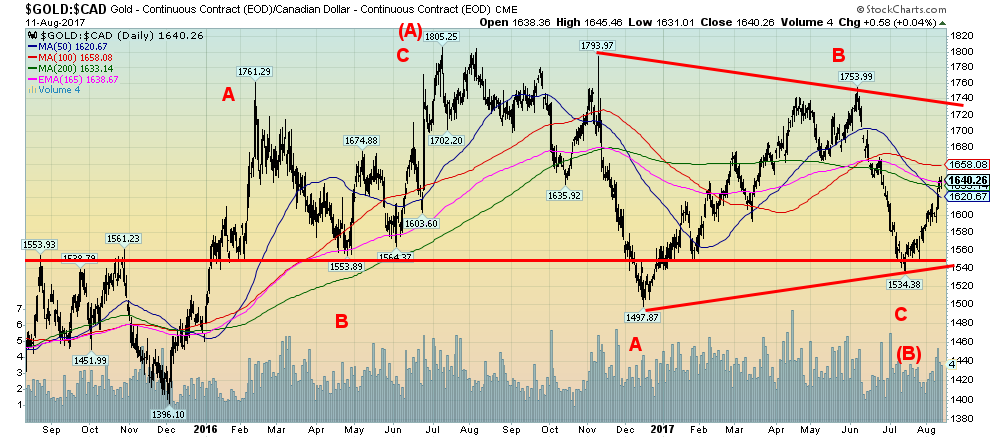
Since we live in Canada it pays to look at gold priced in Cdn$ as the picture that emerges is usually somewhat different because of the currency exchange. A falling currency as the Cdn$ experienced up until May 2017 is positive for gold expressed in Cdn$. Gold in Cdn$ hit a high of $1,754 at the time. But a strong Cdn$ can quickly take the bloom off of gold expressed in Cdn$. With the Cdn$ steaming towards 80 from 72 gold in Cdn$ fell back to $1,534. But now the Cdn$ is weakening again vs. the US$ and that has helped gold in Cdn$ rise once again to $1,640. Gold in Cdn$ is now into a band of resistance with support at $1,620 and $1,600 and resistance up to $1,660 and $1,680. Gold in Cdn$ breaks out above $1,730. Once gold in Cdn$ breaks out it has the potential to target up to $2,100 with further potential to $2,300 and $2,600. But a lot depends on the performance of the Cdn$ as well. A strong Cdn$ vs. the US$ is a drag on gold in Cdn$ whereas a weak Cdn$ vs. the US$ would help move gold in Cdn$ higher faster. As noted only a close under $1,600 might change our current outlook.
(Source)
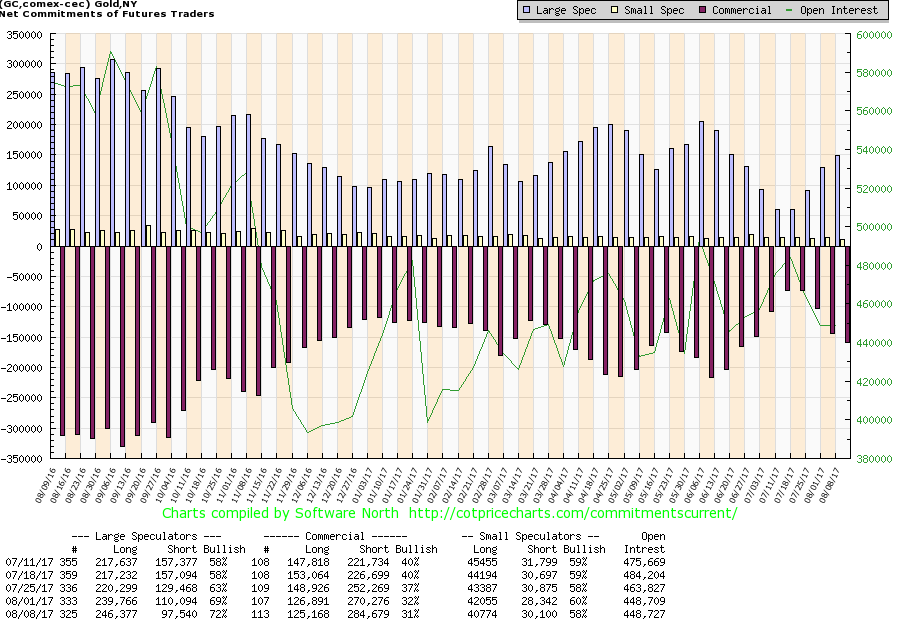
The commercials continue to pile in on the short side as the large speculators pile in on the long side. This past week the commercial COT fell to 31% from 32%. We would have to get down into the 25% range to suggest a top in gold prices may be imminent. This past week long open interest was off roughly 1,000 contracts while short open interest jumped about 14,000 contracts. The large speculators (hedge funds, managed futures etc.) saw their long open interest jump about 7,000 contracts while short open interest fell about 12,500 contracts. We continue to watch the commercial COT for clues of a possible top even if it is a temporary top.
(Source)
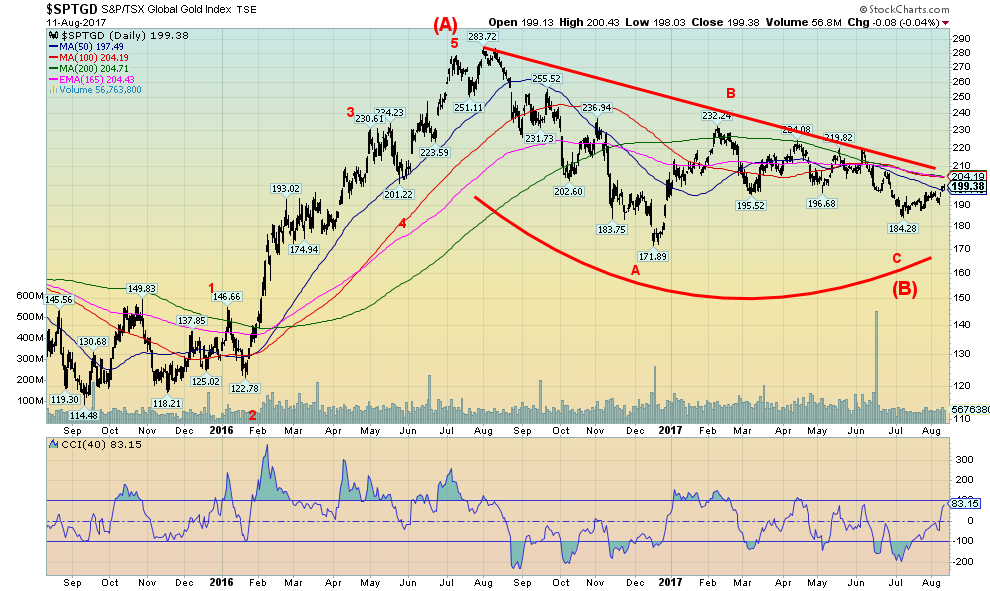
Finally, the gold stocks are showing some signs of life. They are still feeble but at least this past week the gold stocks moved more than the metals. The Gold Bugs Index (HUI) jumped 3.1% while the TSX Gold Index (TGD) was up 3.6%. Not spectacular but at least a decent move. As a result, the TGD has finally crossed above the 50-day MA but is now into a band of resistance that ranges from roughly 205 to 210. Once the TGD breaks out over 210 and especially over 220, the odds favor a much more powerful move to the upside. Gold stocks tend to lead both up and down, but of late they have generally lagged the move in the metals. Year to date the HUI is up 8.6% and the TGD up only 2.6% vs. gold up 12.4%. Silver has lagged as well up only 6.8% year to date. Silver and the gold stocks need to reassert their leadership role to confirm the up move for gold prices. Gold stocks remain cheap historically to gold prices and this could work in their favor going forward.
The TGD has the potential for a move to almost 400 once it makes new highs above 284 the July 2016 top. Further potential can be seen up to 465 and 575. The key spot on the downside is the recent low at 184. That level needs to hold on any pullback to keep the rally in place otherwise we could find ourselves testing the December 2016 low of 172.
—
DISCLAIMER: This article expresses my own ideas and opinions. Any information I have shared are from sources that I believe to be reliable and accurate. I did not receive any financial compensation in writing this post, nor do I own any shares in any company I’ve mentioned. I encourage any reader to do their own diligent research first before making any investment decisions.
Featured Image by Gage Skidmore via Flickr / CC BY 2.0


Bitcoin Stalls Near $60K as Strategy Moves, ETFs Outflow, and EU MiCA Rules Take Effect
Bitcoin hovers near $60,000 with ETF outflows, while Strategy boosts reserves, sells BTC, and raises dividends to reassure investors. Ethereum...


Cannabis Dominates Global Drug Use: Trends, Risks, and Shifting Markets
Cannabis remains the world’s most widely used illicit drug, with 256 million users in 2024, surpassing all others combined. Growth...


Italy Approves First Hydrogen-Powered Train for National Rail Network
ANSFISA has approved Italy’s first hydrogen-powered train, the Alstom HMU214, for use on the Brescia–Iseo–Edolo line. Capable of 140 km/h,...


Cotton Market Weakness Persists Despite Brief Rebound
Cotton prices fell to new lows last week before a modest rebound. USDA data shows crop conditions remain worse than...


Eli Lilly Hits $1 Trillion Valuation Amid Strong Bullish Momentum
Eli Lilly stock hit a record high, surpassing $1 trillion market value after strong product demand. Shares surged over 7%,...
 |
|
 |  |
 |
|
-

 Biotech2 weeks ago
Bavarian Biotech Sector Expands with Record Funding and Startup Growth in 2025
-

 Africa2 days ago
BOAD Approves Major Funding Boost to Drive West African Development
-

 Business1 week ago
Markets Diverge as Oil Falls, Rates Hold, and Inflation Persists
-

 Impact Investing6 days ago
Coastal Cities Lead as Heat Strains Italy’s Urban Livability
You must be logged in to post a comment Login