Featured
Gold and silver stocks correction almost exhausted
All economic sectors were affected by the coronavirus pandemic. The stock market was also on a wild ride since the outburst of the COVID-19 pandemic. However, gold and silver stocks were not as severely affected as they could have been, which shows their strength, especially in times of crisis. Gold and silver have always been considered safe havens by investors

Today, we will take a look at the damage inflicted on this sector by the recent sell-off and try to ascertain just what lies ahead for the precious metals stocks involved in gold and silver mining.
We will commence with a look at the charts for gold and silver prices followed by a comparison of gold’s progress versus that of the Gold Bugs Index (HUI) and conclude with what lies in store for the Precious Metals stocks in the medium term.
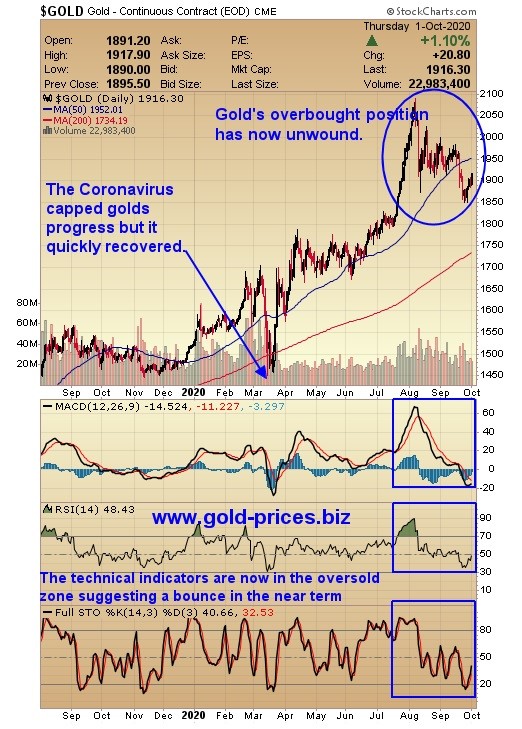
The 12-month gold chart
The coronavirus capped golds progress early this year however it recovered quickly to trade at higher levels than before this nasty virus struck. The technical indicators, the RSI, MACD, and the STO are now in the oversold zone suggesting a near-term bounce is on the cards and that this correction has run its course.
Those investors that rely purely on chart analysis they will see this set up as an opportunity to acquire gold at a discount to what gold was a few months ago and venture back into this market sector with the view to acquiring a bargain.
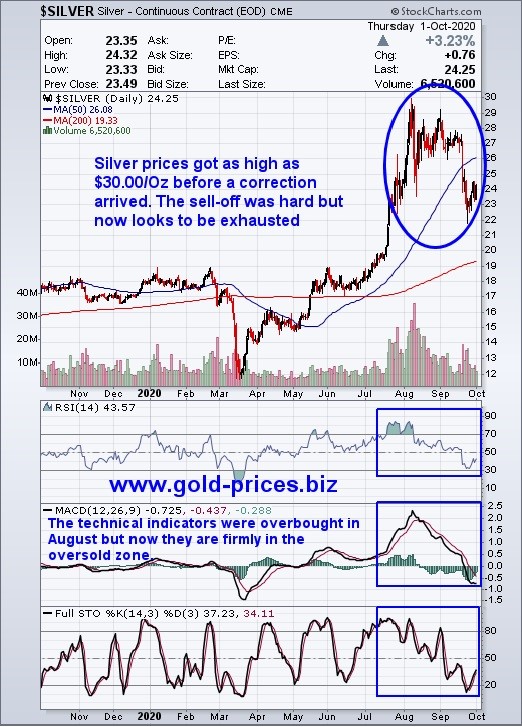
The 12-month silver chart
The technical indicators were overbought in August however, as the chart below indicates they are now firmly in the oversold zone due to the price of silver falling approximately $5.00/Oz in a few short months.
Silver is now positioned below its 50dma and above its 200dma which suggests that there is plenty of room to move higher.
It should also be noted that both of these moving averages are heading north which I view as a positive indicator as they suggest that there is support for silver going forward.
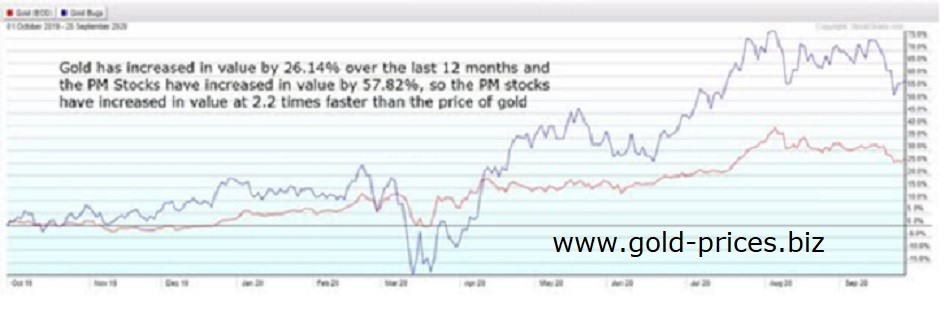
A comparison chart of gold and the precious metals stocks
What we can glean from the chart below is that gold has increased in value by 26.14% over the last 12 months and the PM Stocks have increased in value by 57.82%, so the PM stocks have increased at a speed which is 2.2 times faster than the price of gold
The Gold Bugs Index: The HUI
The chart below shows that the HUI may have found a base at 320, however, these are volatile times and wild fluctuations are to be expected. The technical indicators on the chart below are now a tad oversold so we could get a bounce from this point.
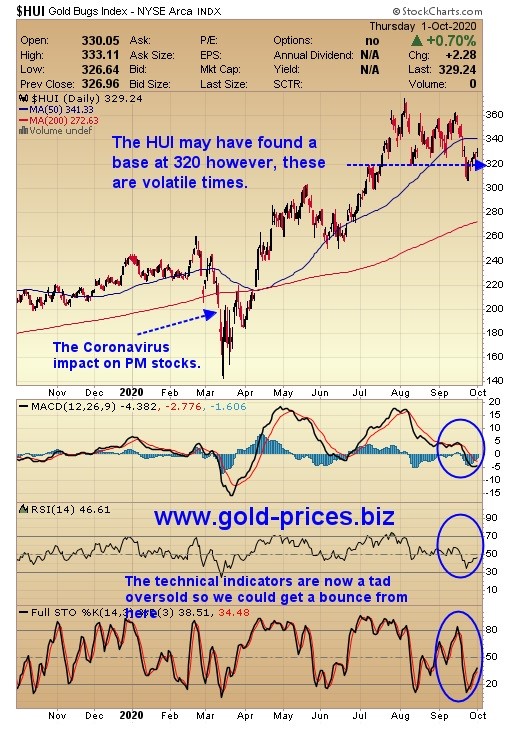
It should also be noted that that Q2 has just ended which coincides with the Quarterly Options trades expiring on 30th September 2020. The price of gold can be volatile in the lead-up to this expiry date as traders try to position themselves to generate a profit from such price oscillations.
Conclusion
A visual inspection of the above charts suggest that the PM stocks have not suffered as badly as they could have done, which is a sign of their underlying strength.
Gold and silver have been sold-off hard in a correction that was warranted. However, they are both now positioned to consolidate and form a new base in preparation of a resumption of this Bull Market.
Central Banks continue to print money at an unprecedented speed in turn they are diluting the value of their currencies and so investors will rotate out of currencies and into a form of hard assets. My preferred hard asset is gold; however, some investors prefer Land and Property as an alternative investment, a subject I will leave for better informed writers than myself, but nevertheless worthy of your consideration.
In Q3 gold was on average about $190/Oz more expensive that it was in Q2 so this next round of financial results should be sparkling and give the PM stocks a real boost.
During this dip I did managed to acquire one stock that has been on my Watch List for some time and I am actively searching for the next bargain to add to my portfolio of PM stocks.
_
(Featured image by PublicDomainPictures via Pixabay)
DISCLAIMER: This article was written by a third party contributor and does not reflect the opinion of Born2Invest, its management, staff or its associates. Please review our disclaimer for more information.
This article may include forward-looking statements. These forward-looking statements generally are identified by the words “believe,” “project,” “estimate,” “become,” “plan,” “will,” and similar expressions. These forward-looking statements involve known and unknown risks as well as uncertainties, including those discussed in the following cautionary statements and elsewhere in this article and on this site. Although the Company may believe that its expectations are based on reasonable assumptions, the actual results that the Company may achieve may differ materially from any forward-looking statements, which reflect the opinions of the management of the Company only as of the date hereof. Additionally, please make sure to read these important disclosures.
Disclaimer: This article expresses my own ideas and opinions. Any information I have shared are from sources that I believe to be reliable and accurate. I did not receive any financial compensation for writing this post, nor do I own any shares in any company I’ve mentioned. I encourage any reader to do their own diligent research first before making any investment decisions.


Bitcoin Stalls Near $60K as Strategy Moves, ETFs Outflow, and EU MiCA Rules Take Effect
Bitcoin hovers near $60,000 with ETF outflows, while Strategy boosts reserves, sells BTC, and raises dividends to reassure investors. Ethereum...


Cannabis Dominates Global Drug Use: Trends, Risks, and Shifting Markets
Cannabis remains the world’s most widely used illicit drug, with 256 million users in 2024, surpassing all others combined. Growth...


Italy Approves First Hydrogen-Powered Train for National Rail Network
ANSFISA has approved Italy’s first hydrogen-powered train, the Alstom HMU214, for use on the Brescia–Iseo–Edolo line. Capable of 140 km/h,...


Cotton Market Weakness Persists Despite Brief Rebound
Cotton prices fell to new lows last week before a modest rebound. USDA data shows crop conditions remain worse than...


Eli Lilly Hits $1 Trillion Valuation Amid Strong Bullish Momentum
Eli Lilly stock hit a record high, surpassing $1 trillion market value after strong product demand. Shares surged over 7%,...
 |
|
 |  |
 |
|
-

 Impact Investing2 weeks ago
AI Adoption in Italian Retail Stalls Despite Strong Experimentation
-
 Cannabis7 hours ago
Cannabis Dominates Global Drug Use: Trends, Risks, and Shifting Markets
-

 Impact Investing6 days ago
EU Weighs More Free Emission Permits in ETS Review to Boost Industry Competitiveness
-

 Impact Investing2 weeks ago
SBTi Net-Zero Standard 2.0 Enhances Corporate Climate Action