Business
Stock Market Goes Nowhere Fast, as Gold Approaches a New All-Time High
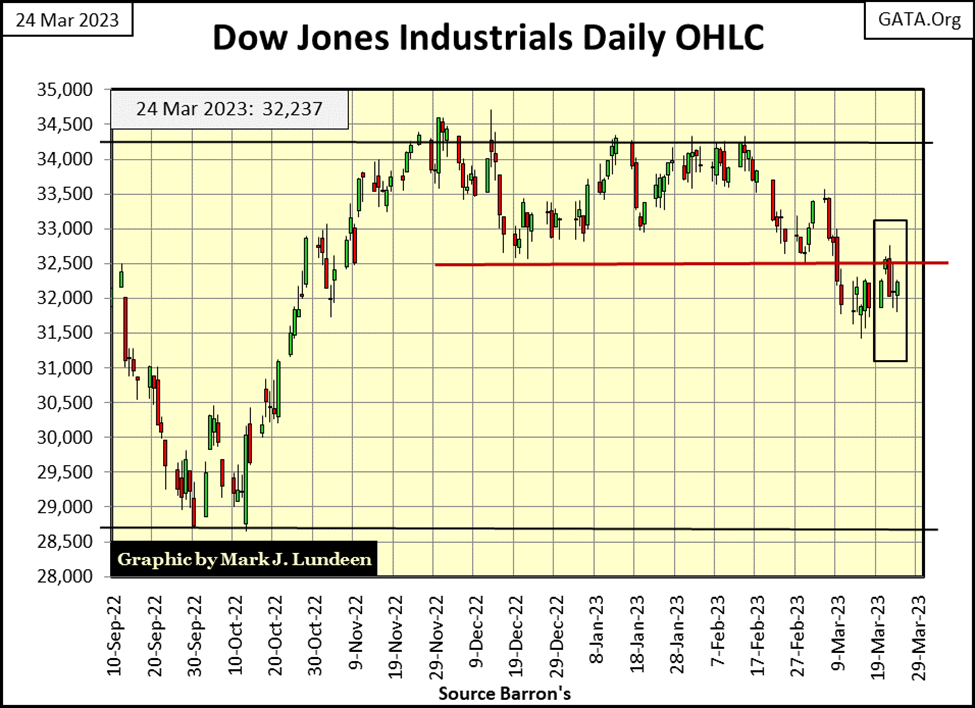
The Dow Jones former support at 32,500 became a line of resistance this week. On Tuesday the Dow Jones closed above 32,500. Gold, silver, and precious metal miners are in a bull market. It’s just their advancement so far in this bull market has been tedious. That is how it goes sometimes. For times such as this, one must be patient, keeping an iron hand on the tiller.
Two Friday’s ago, the Dow Jones was at a BEV of -13.29%. Two weeks later it has advanced by 0.89% BEV points, or 327.89 in dollar terms over the last ten NYSE trading sessions. It’s as if everyone is just fooling around under the BEV -10% line, waiting for something to take the Dow Jones either up, or down from it.
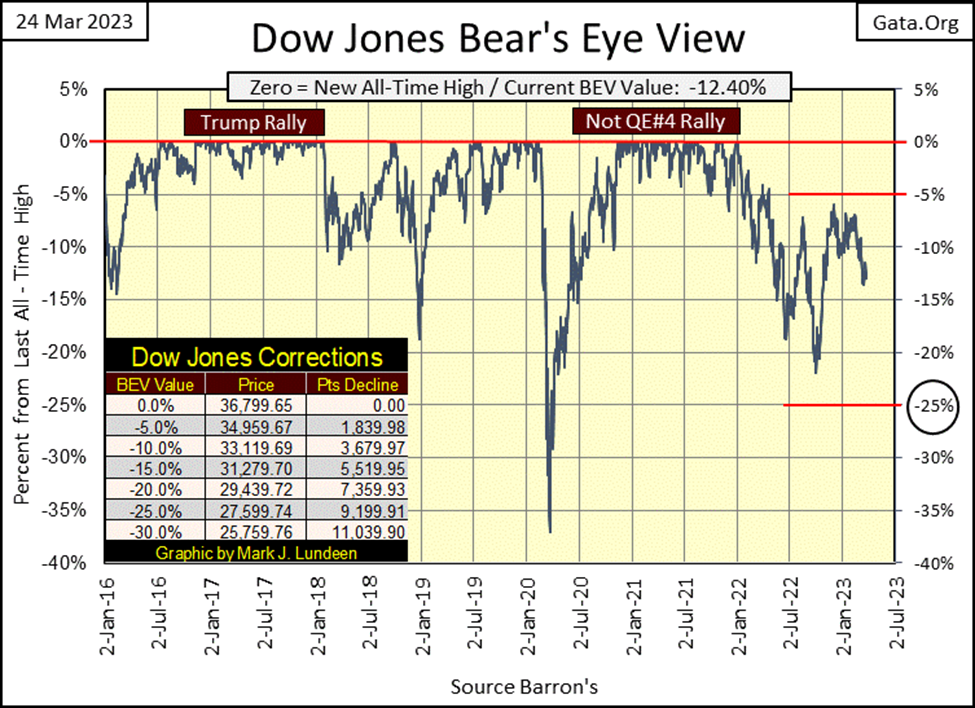
I remain an Ursus Major for the long term. Mr Bear, when he does come to clean up the mess left behind by the bulls and idiot savants at the FOMC, is going to deflate market valuations like no one alive today has seen. A BEV value of -60% or more for the Dow Jones is possible; that would be a close on the Dow Jones below 14,775. However, Mr Bear may not be happy until the Dow Jones closes at something below 5,000. That would be a Great Depression decline in the Dow Jones of 86.41% from its last all-time high of 36,777.
Is this possible? Damn right it is. But until then, I still don’t rule out a few new all-time highs (BEV Zeros / 0.00%) in the Dow Jones’ BEV chart above.
This week we find ourselves only 12.40% from a market top in the Dow Jones, a market top that occurred on 04 January 2022 (36,777). At market tops, investors will never be rewarded for the risks they take. Why is that? Because at market tops, there is only one way for market valuations to go – down. It may go down quickly, and then it may deflate tediously slow. As this market begins deflating in earnest, sometime in the future, that is something I don’t want to expose my money to.
Keep in mind, I’m not anyone’s investment advisor. I’m just a market enthusiast enjoying a hobby I took up decades ago. So, if you make a few million dollars off anything I wrote, you keep it all. But if you lose money off something I wrote, like your gains, that loss is also all yours.
I primarily write these articles for my own benefit to help me identify market trends. There is just something about sitting down and writing that focuses the mind. I share my market research with others as, well why not? And currently, my research on the market tells me this market poses risks to investment funds not seen since the Great Depression. Unless an asset has some exposure to gold and silver, in March 2023 I’m not interested in it.
Below, under the next chart are the BEV values for the major market indexes I follow. Like the Dow Jones, not too much movement in these indexes since my last article. But the interesting thing in the table below is how the NASDAQ Banking Index is about to replace the XAU as #20 in the table. The NASDAQ Banking index will be the first of many, as the XAU rises to #1 in the table, when the precious metals bull market once again dominates the investment universe.
Here is a BEV chart for the XAU and the NASDAQ Banking index, and what is there to learn from them? First, the XAU, unlike the Banking Index, is going the right way – upward from its bear market low of January 2016. It may be like watching paint dry, but the XAU is trending upward off an 83% bear market bottom from seven years ago.
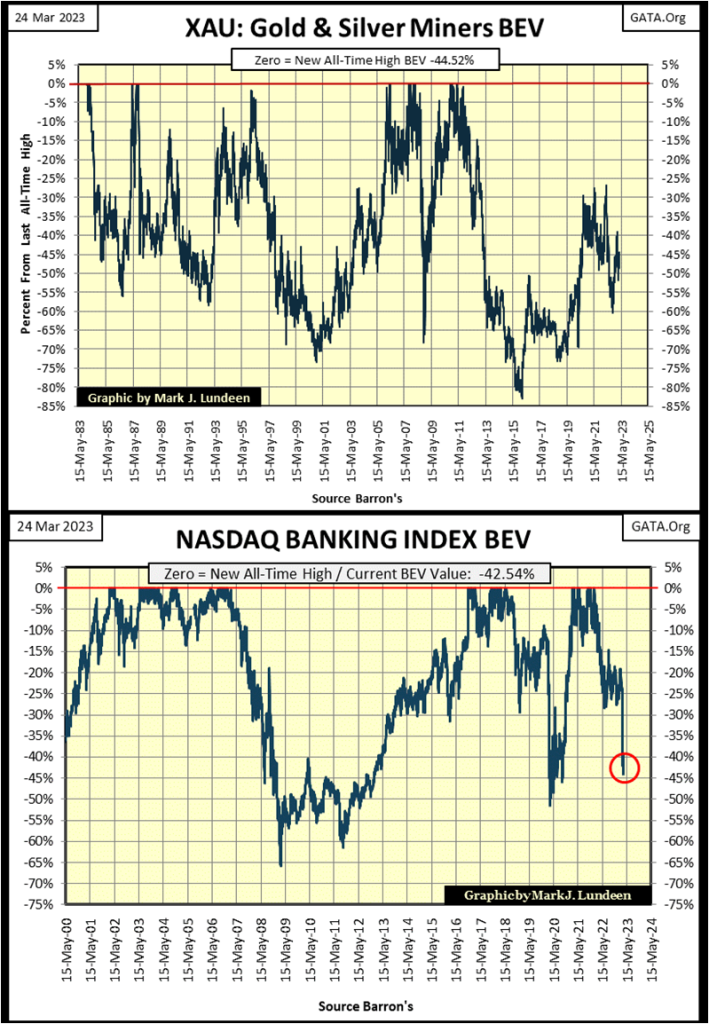
Now look at the NASDAQ Banking Index; it’s going the wrong way – down. And deflating valuations for the banks have a lot more to go before they find a bottom.
Banks used to collect deposits from retired people, and wage earners which they’d use to make short-term loans to local businesses. Decades ago, if someone wanted a home remodeling loan from a bank; well good luck with that, as banks for the most part didn’t do consumer loans before the 1970s. This was a profitable business model, but that is no more.
Today, banks wish their depositors would go away and not come back, as they get their money now from the Federal Reserve, and then lend it to anyone with a pulse via credit cards, or consumer loans.
Is this a problem? I believe it is. Unlike old people in the 1950s, many, if not most with no debt and money in the bank, many old people today are as deeply in debt as are people in their 20s and 30s. Why is someone who is 65 years old still paying off their mortgage? This change in personal finance; from avoiding debt and valuing thrift, to leveraging income via loans from the banking system can be laid at the door of the Federal Reserve System, and their toadies in academia, who for generations have promoted the virtue of debt in personal finance to their students.
Also, the idiots from the FOMC have made life very hard for the financial establishment with their manipulation of the bond market for the past several decades. Rising bond yields, when they rise above some currently unknown threshold level, are guaranteed to take down many, if not most of the large banks in North America and elsewhere. Why would that be? The banking system’s exposure to derivatives.
My gut feeling about the BEV chart above is; the BEV lows of March 2009 (-66%), will be taken out before this decline in the banking sector is over. And with the banks, so goes the rest of the stock market.
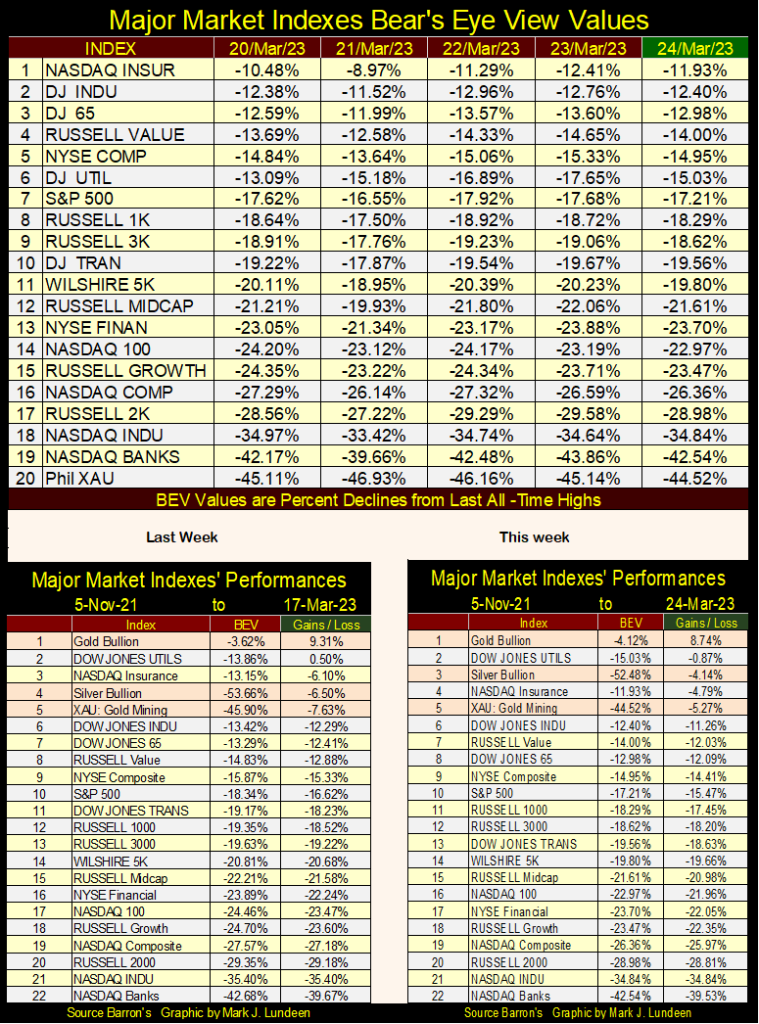
Looking at the performance tables above, precious metals assets continue outperforming the broad market, and have for a while. Where are the NASDAQ Banks in the tables above? #22, far below the XAU at #5.
Gold, silver, and precious metal miners are in a bull market. It’s just their advancement so far in this bull market has been tedious. That is how it goes sometimes. For times such as this, one must be patient, keeping an iron hand on the tiller.
The Dow Jones former support at 32,500 (chart below), became a line of resistance this week. On Tuesday the Dow Jones closed above 32,500, and then ran, not walking back below it on Wednesday.
Looking at the Dow Jones in dollars below; this level at 32,500 is key. Can the Dow Jones close above it, and then stay above it as it advances towards its next line of resistance at 34,250? The Dow Jones must then close above its current all-time high of 36,777 to once again make market history. And do all that as the American / global banking system is in the early stages of an epic meltdown.
Being bullish on the stock market today brings to my mind that line from Clint Eastwood’s movie; Dirty Harry;
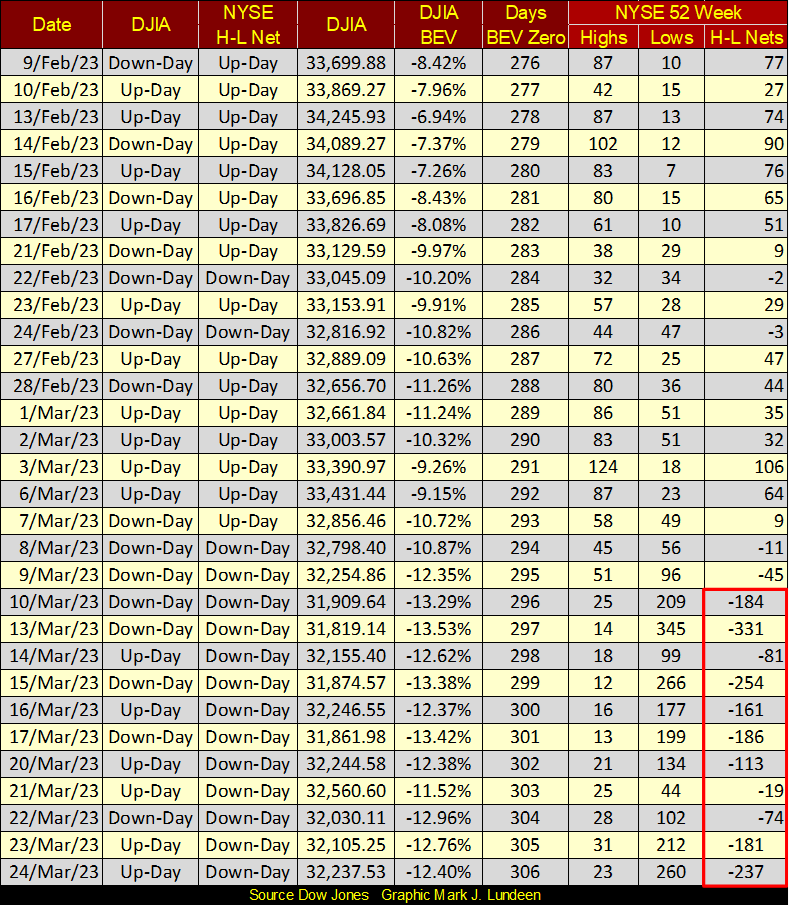
Over at the NYSE, 52Wk Lows continue dominating 52Wk Highs. Nothing extremely bearish, as when 52Wk H-L Nets increase to something over -700. But seeing so few 52Wk Highs at the NYSE since the beginning of the year, it doesn’t justify being a big bull on the stock market. After all, that’s what a bull market on Wall Street is; plenty of 52Wk Highs, week after week at the NYSE. Something I don’t see in the table below.
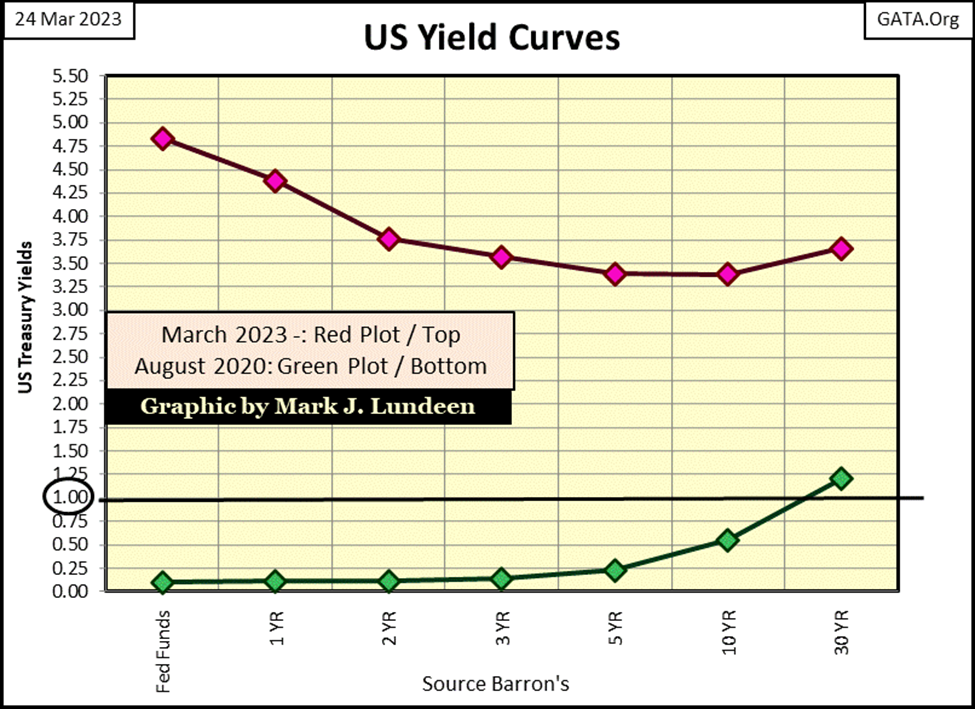
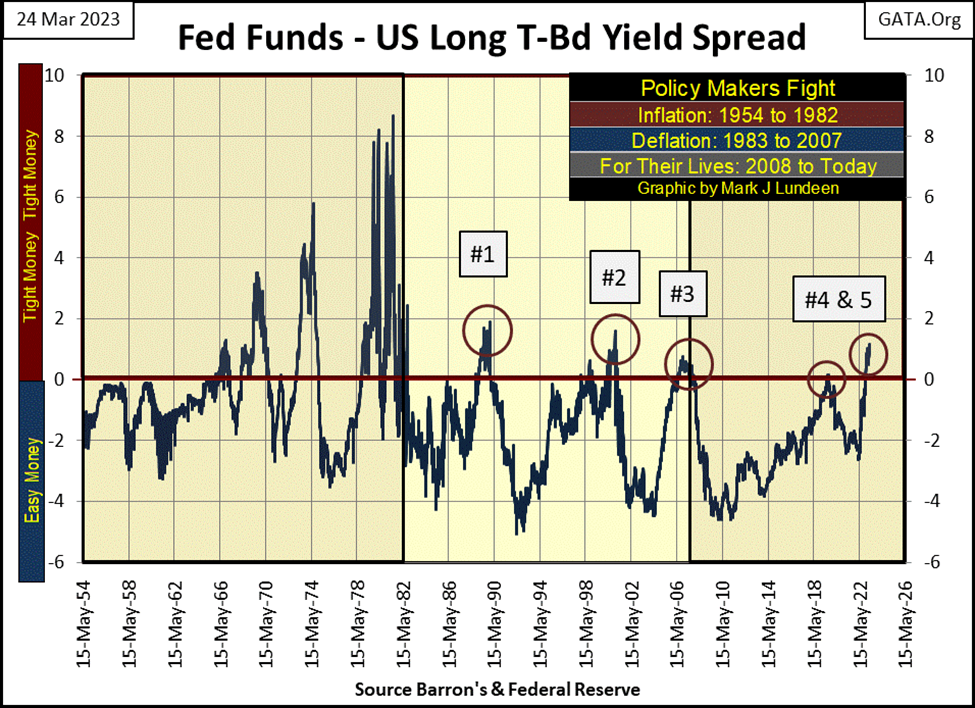
What I do see, is after this week’s rate increase by the idiots at the FOMC, our yield curve (Red Plot Below) is steeply inverted. Years ago, when I used to follow the financial media, anytime the yield curve was inverted as we see below, the financial media would have plenty of “market experts” warning the public that a recession in the economy, and a pullback in the stock market was at hand.
Is the financial media warning of this today? I don’t know, or care. Not that it matters one way or the other what the media is saying. What matters is the idiots have inverted the yield curve, and that is reason enough for me to expect a recession in the economy, and pullback in the stock market sometime in the not too distant future. Maybe starting next week, and maybe not until next August.
For the bulls, it’s just one bad thing after another with this market.
This week the idiots increased their Fed Funds Rate by twenty-five basis points (0.25%), which aggravated the current inversion of the yield curve above and below. Bad things happen when the idiots invert the yield curve. With #1 they triggered the October 1987 flash crash. Yield inversion #2 popped the 1990s NASDAQ High-Tech Bubble. #3 instigating the collapse in the mortgage market in October 2007, and #4 the March 2020 flash crash. One wonders what happens now, with the yield curve inverting for the fifth time.
The economic and market consequences aren’t instantaneous with the inversion. And the severity of the pending problems in the market depends on how much leverage (debt) is weighing down financial assets that are actually profitable. For example, if a company’s annual debt service to the bond market is a billion dollars, but its operations today generate $1.3 billion, that company can pay its bills, and so has no problems. Then there are the millions of people who are gainfully employed, but carry debt for everything from their homes to automobiles.
But, what happens when the economy turns down, with rising unemployment and falling sales, and this same company can now generate only nine-hundred million to service its annual obligation of a billion dollars to the bond market? That formerly solvent company is now an insolvent company, a company you don’t want to own shares of. Of course, many people now gainfully employed will become unemployed in the next recession. How many trillions of dollars now serviced by wage earners will be defaulted on?
This is the service Mr Bear and his cleanup crew provides the market; they provide a reality check on economic assumptions underlying the market’s valuations. Before September 1929, things on Wall Street never looked better. Like trees, the market did only one thing – go up. Testing that assumption, Mr Bear and his cleanup crew discovered the critical flaw to that assumption; debts taken on during an inflationary boom may go bust come the deflationary collapse. As a consequence, the Dow Jones collapsed 89% in the next three years.
Returning to 2023, when the economy begins turning down, many companies that currently can service their debts, will find it impossible to do so as sales begin to drop. Ditto for the debts of many “consumers.”
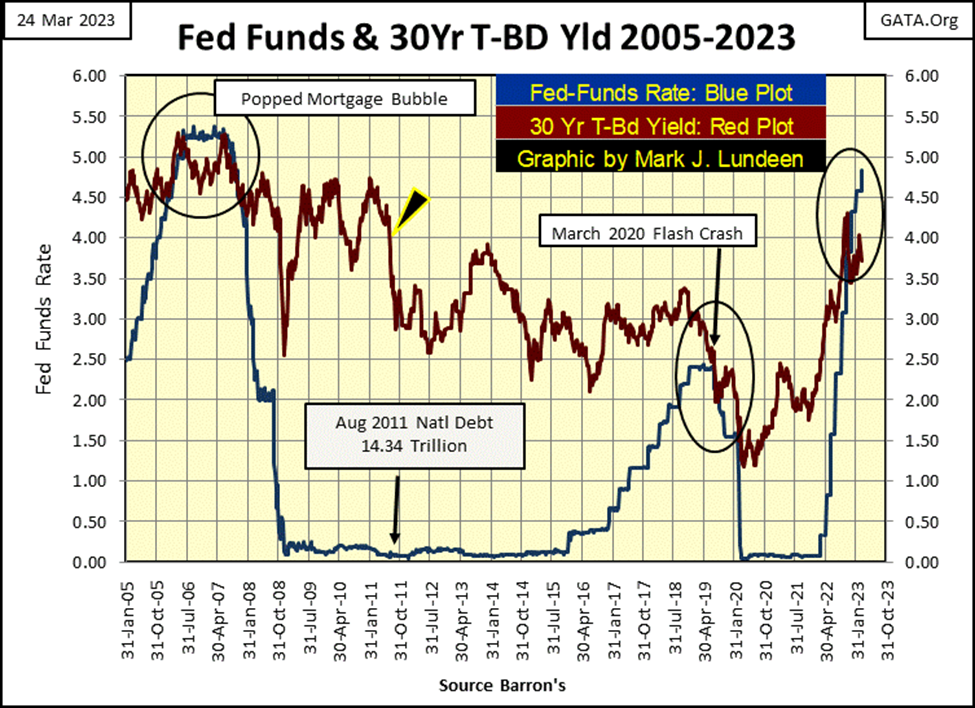
It’s not only seeing the yield curve inverted that should catch your attention in the chart below, but how long the idiots kept their Fed Funds Rate down at an effective 0.00%, far below yields for long T-bond; about ten years total below. Wall Street was borrowing money for free from the Federal Reserve, and getting a good “risk free” return in the Treasury Market, a “risk free” return on an asset whose market valuation was rising as bond yields continued to decline.
In return, and by design, Wall Street made going into debt for corporations, individuals and governments easy. Debts that corporations, individuals and governments may not have taken on had rates and yields hadn’t collapsed since the bottom of the 2007-09 mortgage crisis.
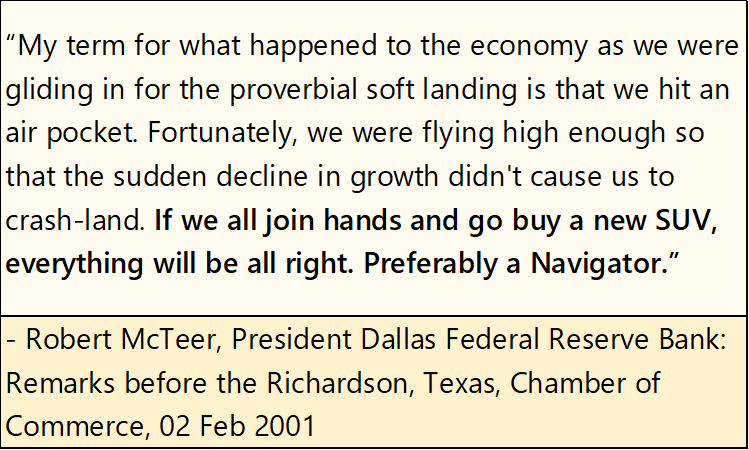
And for the longest time, “market experts”, academics appearing on TV or in the print media, and officials from the Federal Reserve urged people to take on ever more debt as a solution to economic problems caused by too much debt weighing down the economy. The quote below by the then Dallas Fed President, Robert McTeer from 2001 during the 2000-2002 high-tech wreck is one of many told to trusting individuals, foolishly looking for guidance from those in authority.
All that changed in August 2020 (circle chart below), when yields in the T-bond market bottomed, and once again began trending upwards. In August 2020, the yield for the 30Yr T-Bond bottomed at 1.20%, and have been trending upwards ever since, as bond valuations have deflated.
Here is a 30Yr T-bond issued in February 2011. When issued, long-bond yields were at 4.75%, and this bond was priced at par; 100. In the next nine years, this bond’s yield collapsed to 0.95%, as its valuation inflated to 170.25.
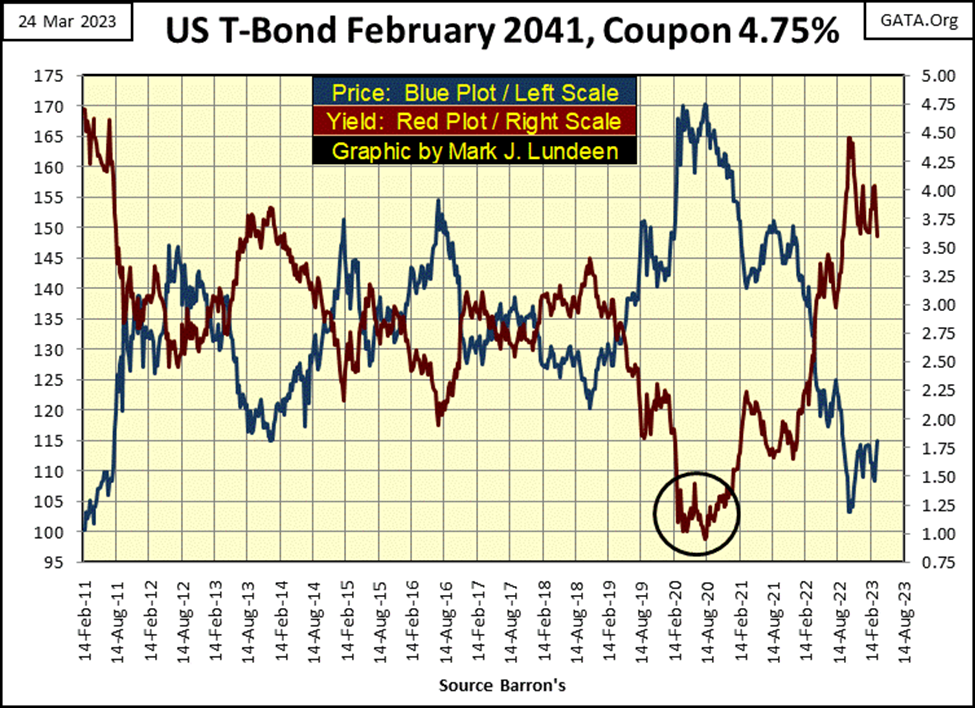
But that was then, and this is now. At week’s close this bond was yielding 3.62% as its valuation closed at 114.23, a 33% loss in valuation from its highs of August 2020.
These T-bonds are an important part of the reserves underlying the financial system. The collapse in bond valuation seen above were a part of the Silicon Valley banks’ liquidity problem. As time goes on, the illiquidity crisis will grow as bond yields continue to rise, as they must, as the bond market begins pricing in market risks for inflation and growing credit risks in corporate America and the US Treasury itself.
Gold has demonstrated much strength since its lows of last autumn. It closed the week only $84.96 (4.12%) from its last all-time highs of August 2020 ($2061). On a good day, gold could easily make a new all-time high. But silver remains mired in a funk that began in January 1980, when it saw its last all-time high.
To compare the market performance between gold and silver for the past forty-three years, I indexed their daily prices below to 1.00 = 02 January 1969. Without a doubt, gold has outperformed silver since 1980.
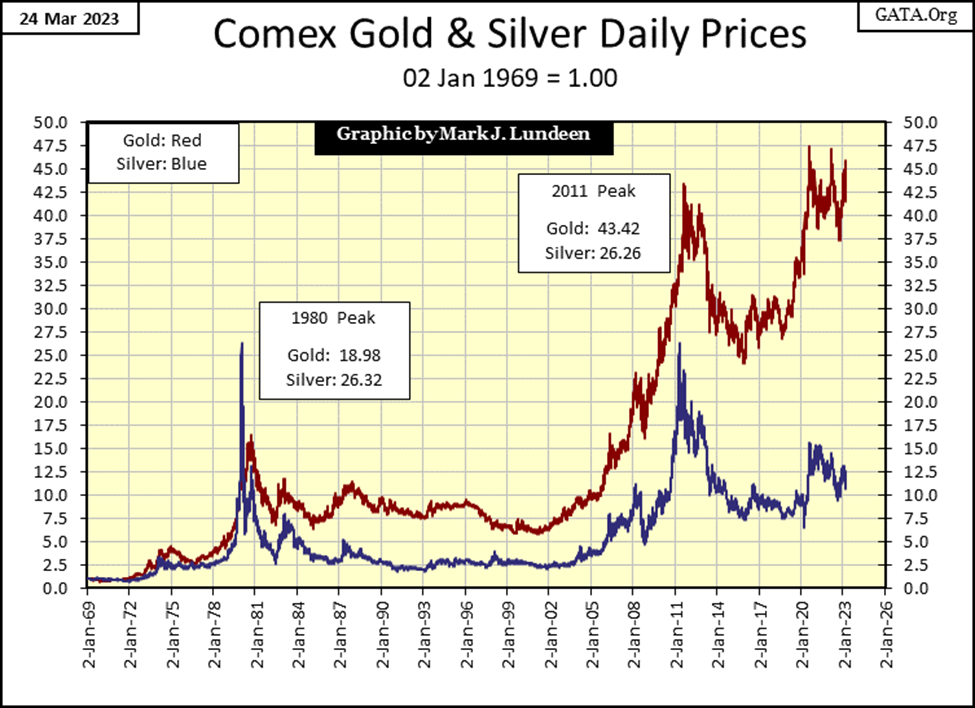
But this week, silver closed with a BEV of -52.48%, meaning silver in March 2023 is selling for 52.48% of what it was in January 1980, forty-three years ago. Besides silver, what else today can be purchased for half of what it cost in 1980? Nothing I’m aware of.
It’s not as if silver were no longer in demand in the economy. Just for solar power, demands for silver are huge, and growing. So, why is silver so cheap today? Silver, like gold used to be money. There is absolutely no interest at the highest levels of finance and government to see silver and gold rise to new all-time highs. So, the precious metals markets are manipulated in the futures markets, where tons of metal can be bought or sold on a promise to deliver in the future, a future delivery that never comes.
It’s no different for corn or soybeans, but agricultural commodities in the futures markets are for farmers and food processors to hedge market risks, market risks like no rain or too much rain in Iowa. What risks are present in the gold and silver market that require a futures exchange to hedge?
I expect the major risk being hedged in the silver and gold futures market is should the old monetary metals rise to where they should be, that is a big problem for the global central banking cartel. A morgan silver dollar used to be a dollar; it’s was what a dollar once looked like. Long ago, silver dollars and paper dollars were exchanged on a one-to-one basis, as each were a dollar.
I just looked at a site where the lowest grade of morgan silver dollars were selling for $33.99. Today, it takes 33.99 dollars of paper or credit to purchase one dollar of silver from yesteryear. Don’t tell me we don’t have a huge problem with inflation.
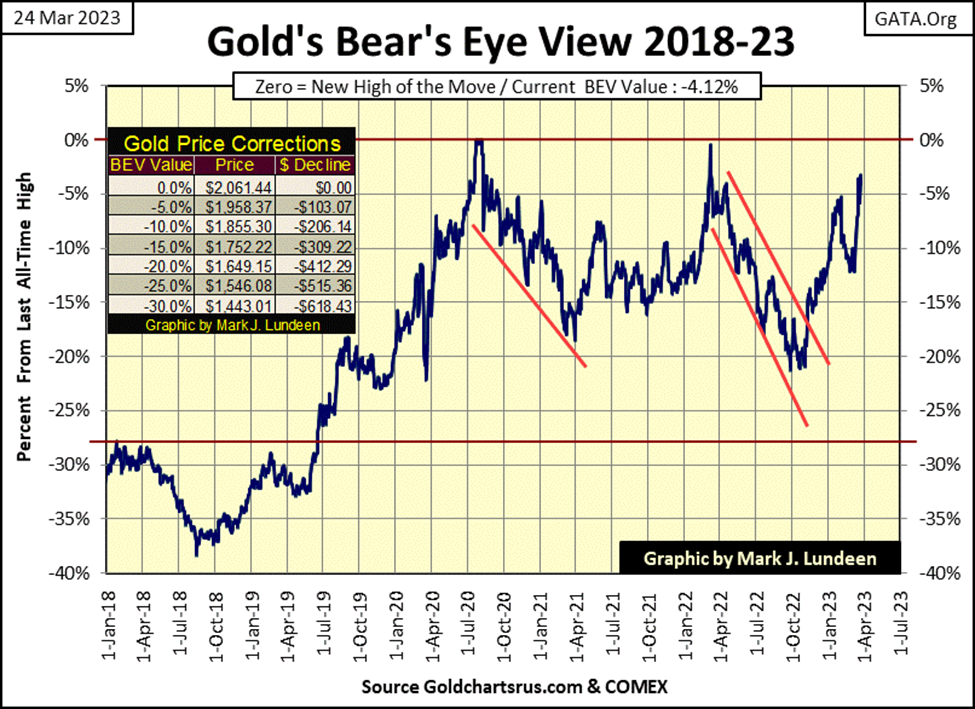
Look at this; gold is in scoring position, within 5% of its last all-time high in its BEV chart below. Gold is now in position to make a new all-time high any day of next week; whether it does or doesn’t I don’t dare to speculate on. But the possibility for it to do so is real.
Daily volatility for gold is increasing in its step sum table below, closing the week at 0.74%. Bull markets for gold and silver are volatile markets, so rising volatility in the gold market is good.
Gold also became overbought last week, with a 15-count of +7 & +9. Markets don’t like being overbought and tend to sell off when they do. Now look at gold’s trading last week. It closed lower for three out of five trading sessions. Yet on Thursday, gold still closed higher than on Friday, March 17th. It seems gold wants to go up, and make some market history in the days and weeks to come.
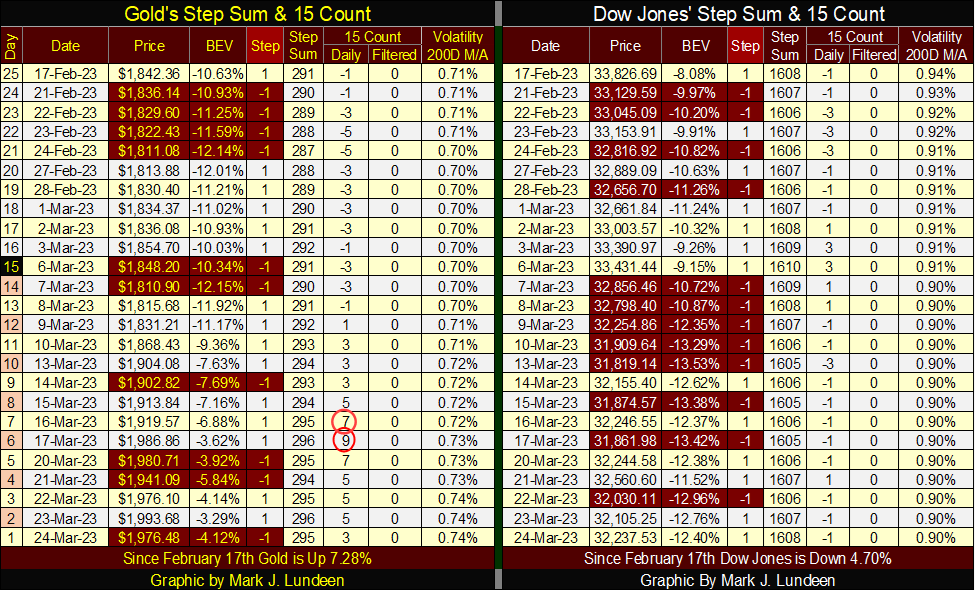
A quick look at the Dow Jones’ step sum; it was at 1608 on February 17th, and again on March 24th. That tells us in the past twenty-five NYSE trading sessions, the Dow Jones closed up as frequently as it closed down. So, what’s with the Dow Jones losing 1589 points from February 17th to March 24th? And this happened as daily volatility for the Dow Jones fell from 0.94% on February 17th, to 0.90% at the close of this week.
A reduction in daily volatility should be bullish for the Dow Jones, but hasn’t been for the past month. That isn’t surprising due to the growing awareness of problems in the global banking system.
Somewhere out there, there is a domino waiting to fall that will begin a chain reaction of defaults and bankruptcy throughout the economy and financial market. I don’t know what it is, just that it is there, and waiting for something or somebody to knock it down. 2023 promises to be a year of high drama.
But for now we wait, and not be tempted back into the stock market. Gold and silver bullion, as well as the mining companies that produce them, are the investments of choice in this market.
__
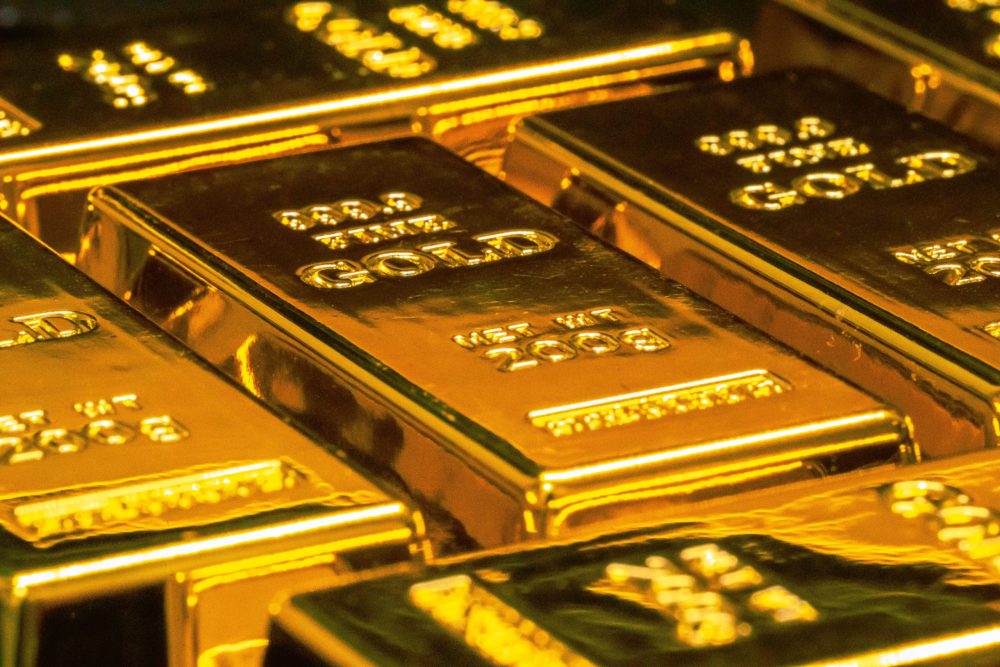
(Featured image by Jingming Pan via Unsplash)
DISCLAIMER: This article was written by a third party contributor and does not reflect the opinion of Born2Invest, its management, staff or its associates. Please review our disclaimer for more information.
This article may include forward-looking statements. These forward-looking statements generally are identified by the words “believe,” “project,” “estimate,” “become,” “plan,” “will,” and similar expressions. These forward-looking statements involve known and unknown risks as well as uncertainties, including those discussed in the following cautionary statements and elsewhere in this article and on this site. Although the Company may believe that its expectations are based on reasonable assumptions, the actual results that the Company may achieve may differ materially from any forward-looking statements, which reflect the opinions of the management of the Company only as of the date hereof. Additionally, please make sure to read these important disclosures.


Avant Devices Moves Toward Electric Wheelchair Kit Production with New Funding Drive
Murcia-based Avant Devices is seeking €260,000 in crowdfunding to launch mass production of its electric wheelchair conversion kit. The funds...


Legend Biotech: Growth Driven by CAR-T Innovation and Carvykti Expansion
Legend Biotech's stock reflects demand for innovative CAR-T cancer therapies. The US biotech focuses on commercializing Carvykti with partner Janssen...


Senegal’s Debt Strategy: Choosing Between Restructuring and Financial Innovation
Senegal’s upcoming choice of debt advisor, with Lazard reportedly leading the race, reflects a broader strategic decision. Rather than pursuing...


Pictet Raises $253 Million for Environmental Investment Fund
Pictet Group closed its Environment Co-Investment Fund I at $253 million, surpassing its $200 million goal. The Article 8 SFDR...


Virginia Cannabis Market Could Reshape Regional Competition
Virginia’s planned recreational cannabis market could reshape the Washington region’s economic landscape. With nine million residents, it may draw consumers...
 |
|
 |  |
 |
|
-

 Crypto2 weeks ago
Crypto Platforms Expand Stock Perpetual Trading
-
 Africa16 hours ago
Senegal’s Debt Strategy: Choosing Between Restructuring and Financial Innovation
-

 Crypto1 week ago
SpaceX Bitcoin Move Sparks Debate Amid Market Uncertainty
-

 Impact Investing2 weeks ago
ReLife Recycling Acquires Palcart Recycling Operations in Verona