Featured
Volatility in the Stock Markets Is Never a Good Sign
All the turmoil surrounding the collapse of SVB and Signature plus bail-outs of Credit Suisse and First Republic resulted in flights of safety as gold and bonds soared. Gold leaped 5.7% to new highs and the U.S. and CLDN 10-year soared (price) with yields falling. The inverted yield curve also flattened somewhat. That suggests to us that we are getting closer to a recession, possibly Q2 but more likely Q3.

If it’s not one bank, it’s another. The collapse of a bank like Silicon Valley Bank (SVB) never ends just with SVB. Following quickly was Signature Bank. Then, First Republic Bank was mentioned as potentially failing. Others just catch the flu. Then Credit Suisse’s name comes up. As to market cap, the listings are: Credit Suisse (CS) – $10 billion; SVB (SIVB) – $6 billion but may be nothing now; Signature Bank (SBNY) – $4 billion; First Republic Bank (FRC) $6 billion. But all those market caps were then; the question is, what are they now? Depending on which list you are looking at and at what point in time, SVB was ranked 17th, First Republic 23rd, Signature Bank 37th, and Credit Suisse USA 41st in the U.S by assets. Credit Suisse Group is ranked 18th in a list of European banks with assets of €726 billion. Note: these lists were last updated in mid-2022.
What all this has done is thrown a pile of uncertainty into the market. Or, as we said, bubbled up a cauldron of fenny snake and a whole pile of other unsavoury things. For 14 years, central banks kept interest rates at or near zero for the most part, and at or below zero in the case of the eurozone and Japan due to the 2008 financial crisis and the 2020 pandemic. Then, when they suddenly raised them to levels not seen since 2007, someone(s) somewhere was sure to be caught, positioned the wrong way. Yes, there were rate hikes from roughly 2015 to 2019, but not at the current pace or height. Then came the pandemic and rates plunged to zero (or below) once again.
Not only were interest rates suppressed, but the flood gates opened up and trillions of dollars in the form of quantitative easing (QE) were lavished on markets and even individuals, and taxpayer bailouts were the modus operandi of the day. The alternative was potentially worse. The deadly combination of low interest rates and oodles of monetary stimulus plus fiscal stimulus resulted in massive speculation. Stocks, housing, cryptos—you name it. It was a speculative frenzy creating the everything bubble. And the attitude was there was nothing to worry about as the Fed (and other central banks) have your back. We even called it the Fed put. Inevitably, all the monetary largesse, coupled with a pandemic and then war, sparked the highest level of inflation since the late 1980s, more akin to the inflation of the 1970s. While the timing is odd, the rate hikes by the Fed (and others) never really got underway until war broke out in February 2022, a good year after inflation started rising. War inevitably always brings more inflation.
The word is that the Fed caused SVB to fail as they hiked interest rates. The reality is that SVB failed, most likely because of mismanagement and a heavy dose of inexperience. And we suspect that many other banks have similar problems. When interest rates are rising and the yield curve becomes inverted, lending long and borrowing short no longer work. It’s called duration risk, the difference between long-term and short-term rates on an investment portfolio. As a former money manager, that is one of the key things you learn when managing a portfolio of loans and other assets. That, along with how to manage in multi-interest rate environments.
When depositors get nervous and start bailing and potential inter-bank lenders get nervous and take you off their credit list, you have a major problem. Even a bank the size of Credit Suisse knows that. SVB inevitably had to start selling its long-dated assets (Securities that were liquid) to cover the disappearing deposits. Depositors’ money is call-money. It can be here today, gone tomorrow. Inevitably the sale of securities led to huge losses in their portfolio wiping out their capital. So how many others are there out there? We don’t know. We just suspect there are others.
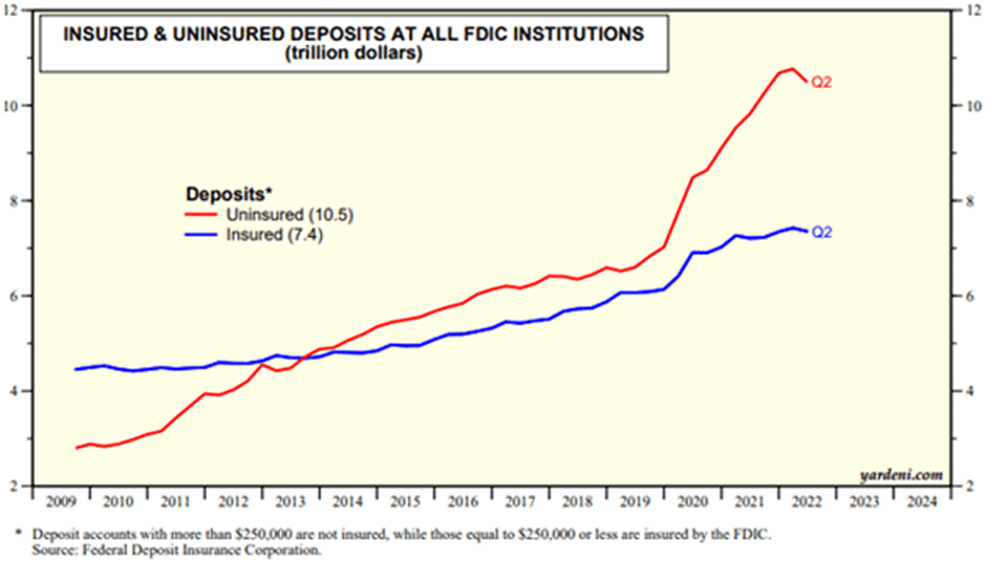
Now the Fed, the Treasury, and the Federal Deposit Insurance Corporation (FDIC) are scrambling to ensure that $10.5 trillion in uninsured bank deposits don’t fail. A bail-out? Or a bail-in? No losses will be borne by the taxpayer, so the President has declared. Instead, it will be fees from banks that pay into the Deposit Insurance Fund (DIF) that covers deposits above the limits of the FDIC. The trouble is, during the 2008 financial crisis the FDIC had to be bailed out by, you guessed it, the taxpayer. Given that the level of uninsured deposits in financial institutions far exceeds insured deposits could a bigger problem develop?
If the losses are substantial, the fees in the DIF will not be enough. Then what? A bail-out of the DIF? Hike fees? As to shareholders of SVB and others, they will not be protected. Executives and management will be job hunting. Simply put, SVB (and Signature) while they may had the liquid assets to cover the withdrawals they couldn’t unload these assets without suffering huge losses. Add in being cut off in the inter-bank market and the result is bankruptcy. As to the depositors, are they to be bailed again sending the message they have no risk?
While SVB and Signature Bank will have their depositors protected (up to a point), nothing yet is in store for the large money center banks. This is not (yet) a global contagion. Thoughts of the Savings & Loan (S&L) crisis of the late 1980s come to mind. That led to the early 1990s recession, but it never threatened the global banking system. The major money center banks are estimated by some to be already suffering losses at over $600 billion. That far exceeds what they have set aside for loan losses. Losses do not become realized unless they sell or they have defaults. The money center banks have set aside an estimated $11 billion, although it could be more. The market cap of the big five money center banks (J.P. Morgan Chase, Bank America, Wells Fargo, Charles Schwab, and Morgan Stanley) was $1.1 trillion as of December 2022.
As to Credit Suisse? Credit Suisse is in the category of “too big to fail.” Just like JP Morgan Chase, Bank of America, etc. The result: it was announced that the Swiss National Bank (central bank of Switzerland) is lending them $74 billion to shore up their capital and ensure depositors that their funds are safe. It’s one thing having a run on a bank like SVB and another having it on Credit Suisse or any large money center bank. The ink was barely dry on that loan when along came another save in the form of $30 billion from a consortium of banks for First Republic Bank of San Francisco in order to shore it up. Seems that everyone is getting in on the deal to protect the banks. Maybe the Fed breathed a sigh of relief. The S&P 500 reversed course and rose Thursday after being down. First Republic had been considered next to fail if nothing was done. On Friday, however, the bank jitters returned and markets fell once again.
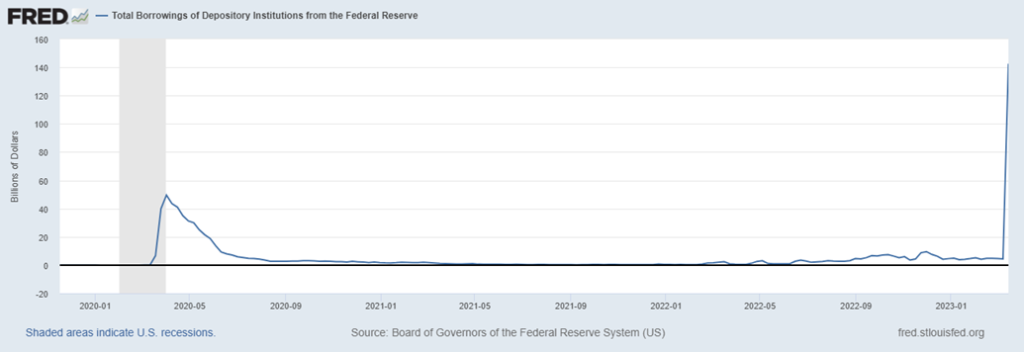
Against this backdrop, maybe it is no surprise to discover that there has been a surge of borrowings at the “discount window” of the Federal Reserve. What is the discount window? It is just a big credit line at the Fed for depository institutions to access funds in the event of liquidity problems. The borrowings at the discount window have surged to $142.6 billion as of March 15 from $4.4 billion on March 8. We haven’t seen that level of borrowing since the financial crisis of 2008. Back then, it hit a peak of over $400 billion. It surged during the 2020 pandemic as well but peaked out at about $50 billion. Is this current round of borrowing underlying the problem? The Fed is, after all, the lender of last resort.
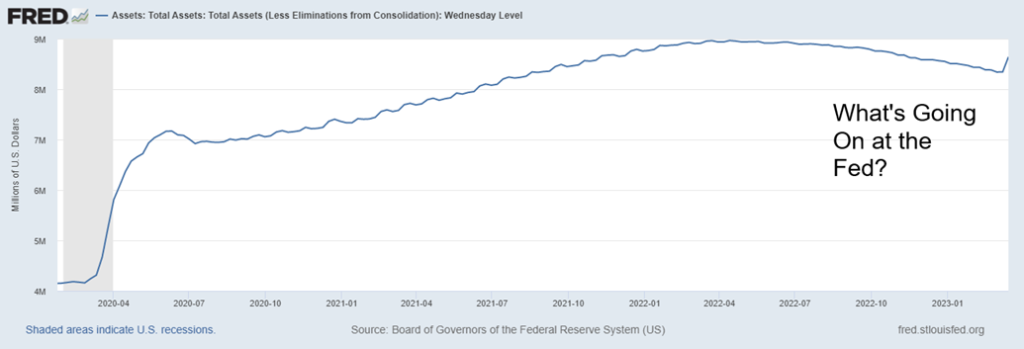
Curiously, the Fed’s balance sheet has also taken a jump. Since March 8, the Fed’s assets have jumped $297 billion. Grant you, part of it is most likely the discount window borrowings, although overall it’s larger. What it isn’t is another round of QE. But between this and the discount window borrowings, it is clear that the banking system needed funds and in a hurry. Maybe the Fed put is alive and well after all.
Borrowings at the Federal Reserve’s Discount Window 2020–2023
Federal Reserve Assets 2020–2023
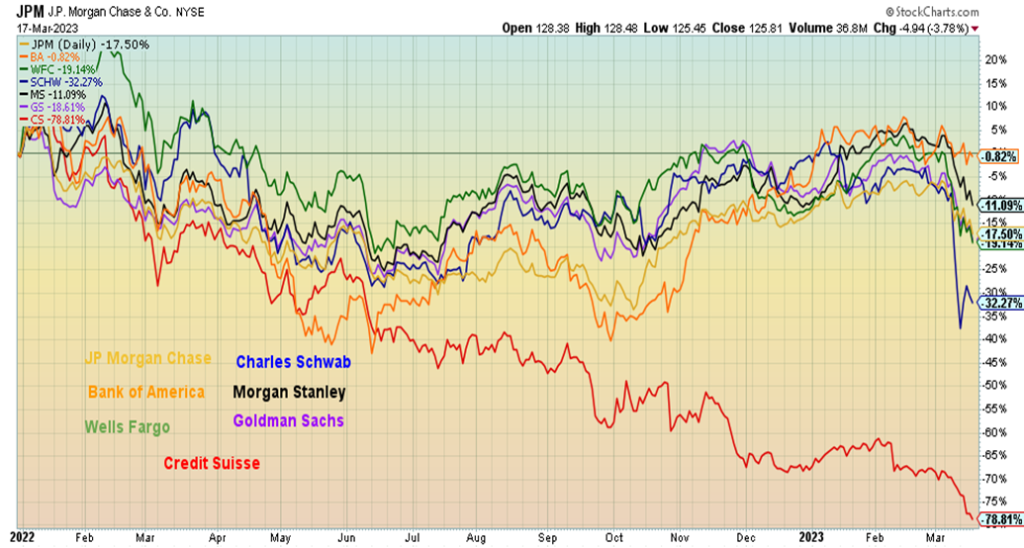
None of this has stopped banks from being at the center of attention and suffering a sell-off. Nobody, it seems, has been spared. Since the markets peaked in early January 2022, all six major money center banks have fallen, with Charles Schwab leading the way, down 32%. We added Credit Suisse for comparison’s sake. It’s down a whopping 79%. The best-performing bank has been Bank of America, but even it has lost about 1%.
Down, Down, Down We Go – Money Center Banks and Credit Suisse Performance 2022–2023
Yes, inflation is cooling. The February CPI came in up 0.4%, right on consensus. Year-over-year (y-o-y), the CPI is up 6.0%. The PPI for February came in down 0.1% which was a surprise as it was expected to be up 0.3%. Y-o-y it was at 4.6%, well below consensus of 5.4%. Retail sales fell 0.4% in February but were still up 5.4% y-o-y. But as population grows, retail sales can grow as well. However, housing starts remain strong at 1.45 million, well above the expected 1.31 million. Weekly jobless claims fell back below 200,000 again, coming in at 192,000, well below the expected 205,000. All are signs that the economy remains relatively strong. But the Philly Fed was negative 23.2%, well below the expected negative 15.6% but continuing with last month’s negative 24.3. Then, on Friday, industrial production came in below consensus while the Michigan Consumer Sentiment Index fell from the previous month and below consensus.
EU inflation remains high, last reported at 8.5% y-o-y. Despite jitters in the banking sector, especially with Credit Suisse, that didn’t stop the European Central Bank (ECB) from hiking the bank rate once again 50 bp to 3.5%. That remains below the Fed rate of 4.75%. The 50 bp was expected and the fact that the ECB hiked despite all the problems continues to suggest to us that the Fed will hike a further 25 bp at next week’s FOMC March 21–22. For the Fed, what’s key is that inflation is coming down, but there is little sign of a recession because economic numbers remain relatively good. But could the Fed surprise us and do nothing?
CPI, PPI, Fed Funds – 2001–2023
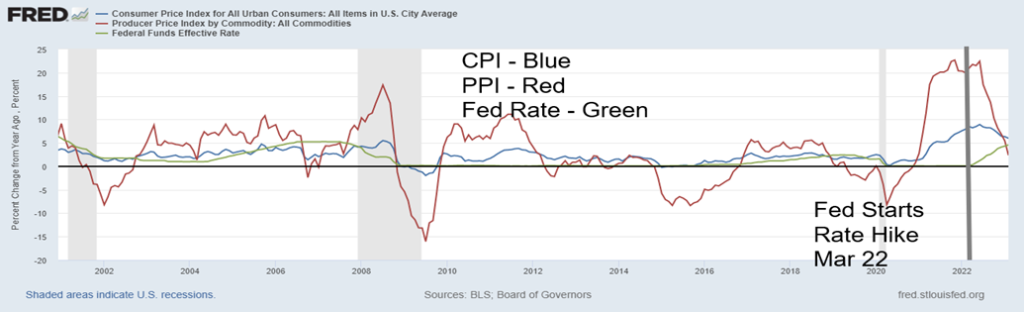
Note how the PPI annual rate of change has fallen below both the CPI and the Fed rate. That is usually a good sign and could signal the ending of Fed rate hikes. While the expectation is still for another 25 bp in March, could it be the last? Or will the Fed do nothing as some expect? The straight line denotes when the Fed started hiking interest rates. Well after inflation was underway.
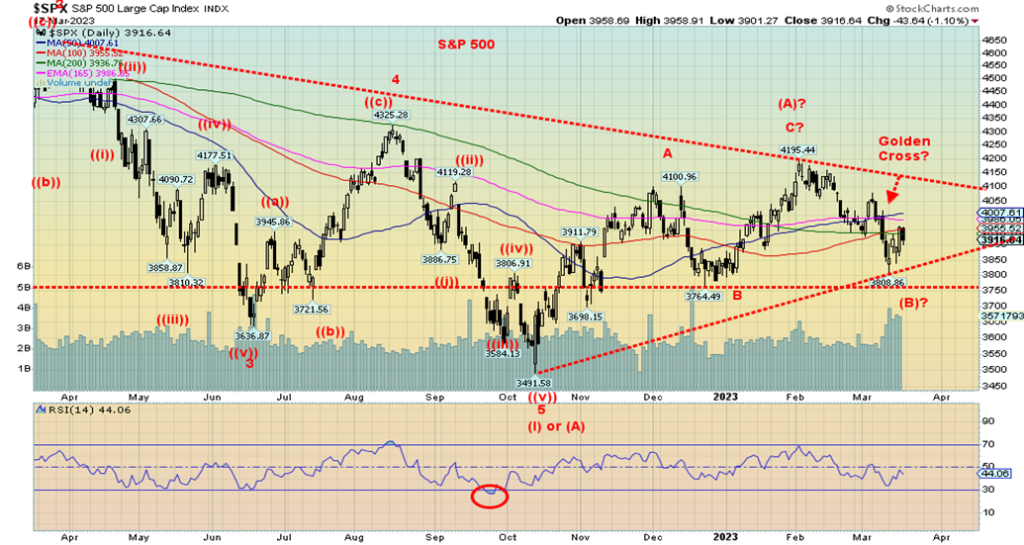
The stock market has wobbled. Volatility has picked up. Breadth has not been impressive. Fear is gripping the market. But word of the loan to Credit Suisse, plus the save for First Republic, coupled with some good economic numbers, sparked a rebound in the stock market, at least initially. The stock market is wobbling but it is not collapsing, yet. What’s key is that December low at 3,764 holds. A breakdown under that level would negate the positive January and suggest that 2023 could be a negative year. If we are truly making a corrective pattern to the decline from January 2022 to that low in October 2022, it is a not unusual to witness a large ABC pattern that unfolds as an A wave abc, a B wave of abc, and a five-wave advance for the C wave. However, we note that the recent down wave has fallen in five waves, indicating that a bigger wave to the downside could be underway. Ergo, why that December low has become important. We note that the 50-day MA appears to be in the process of crossing over to the upside. Will it succeed? Or give off a false signal?
As depositors’ funds are pulled from banks, they flee to the safe havens of gold and treasuries. It is no surprise therefore that the U.S. 10-year treasury bond has fallen recently from a peak of 4.07% to a recent 3.44%. The 3-month treasury bill has dropped from a peak of 5.04% to 4.45% and the closely followed 2–10 spread has fallen to 42 bp from 90 bp. Normalization of the yield curve? Gold has gone from a low of recent low of $1,810 to $1,974, a jump of 9.1%. Gold stocks, as measured by the Gold Bugs Index (HUI), have jumped about 15%. But in a surprising move Bitcoin and cryptos have surged. Bitcoin gained 32% this past week. Bitcoin as a safe haven? Hardly. Meanwhile, the S&P 500 has fallen about 7% from its recent highs and WTI oil has dropped 17.3% on recession fears. Oil, however, is near the bottom of a channel but could still tick lower towards $63. While the S&P 500 has given up most of its earlier gains the Dow Jones Industrials (DJI) is now down on the year as are the S&P 400 (Mid) and the S&P 600 (Small). Are they leading the way?
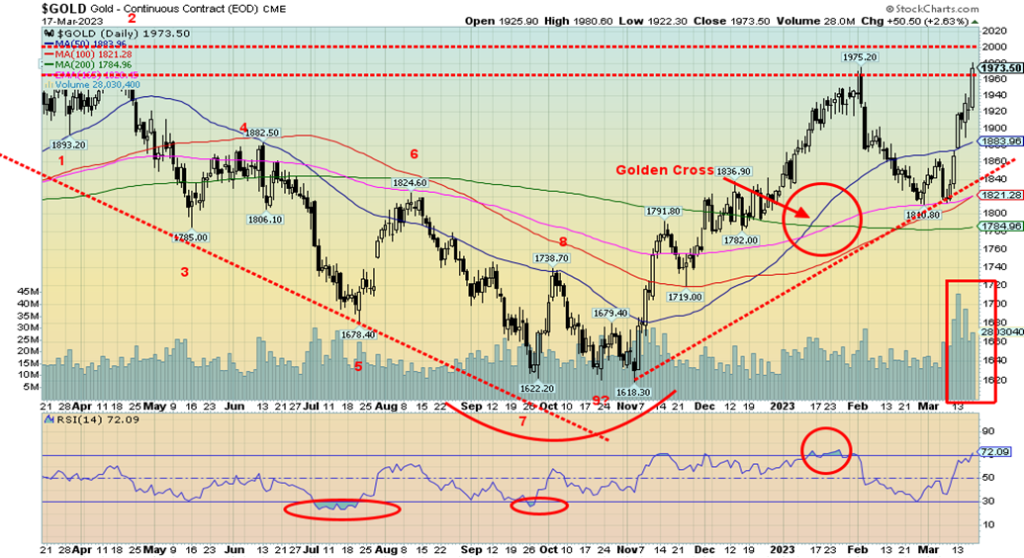
Meanwhile, gold needs to take out the previous high of $1,975 to suggest higher prices. (Note: April gold closed at $1,973 but pushed to a high of $1,993 in after-hours trading). Above $2,000, new highs are quite possible. Targets could then be easily up to $2,300/$2,500. To the downside, $1,875 remains important and below $1,700 new lows are probable. We remind ourselves that we have had no confirmation of our long-dated cycle lows of 7.83 years and 23.5 years. Only new highs above $2,100 will confirm that. Note how volume has picked up on the recent run-up for gold. That’s a positive sign. Gold is just starting to get a little overbought according to the RSI. But it can stay that way for a time. And while bullish sentiment is rising, it is not as yet at extremes. Gold stocks, especially the junior mining stocks, remain grossly undervalued. Silver and other precious metals are somewhat lagging. But they could soon catch up.
Previous lessons it appears are never learned. Countries should never grow complacent about the risk of a financial disaster according to economists Carmen and Vincent Reinhart. Carmen Reinhart also co-authored with economist Kenneth Rogoff This Time is Different, Eight Centuries of Financial Folly. No, this time is not different. Only the players are different. But they keep making the same mistakes again and again.
Maybe we should let the last word come from Dr. Doom, economist Nouriel Roubini of the Stern School of Business of New York University. To quote: “The bloodbath has just begun. We are in the beginning of a debt crisis in the U.S., we are only in the first few innings.” We could echo those sentiments.
Markets & Trends
| % Gains (Losses) Trends | ||||||||
| Close Dec 31/22 | Close Mar 17/23 | Week | YTD | Daily (Short Term) | Weekly (Intermediate) | Monthly (Long Term) | ||
| Stock Market Indices | ||||||||
| `S&P 500 | 3,839.50 | 3,916.64 | 1.4% | 2.0% | down | neutral | neutral | |
| Dow Jones Industrials | 33,147.25 | 31,861.98 | (0.2)% | (3.9)% | down | neutral | neutral | |
| Dow Jones Transport | 13,391.91 | 13,773.46 | (3.1)% | 3.9% | down | neutral | up | |
| NASDAQ | 10,466.48 | 11,630.51 | 4.4% | 11.1% | neutral | neutral | neutral | |
| S&P/TSX Composite | 19,384.92 | 19,387.72 | (2.0)% | flat | down | neutral | up | |
| S&P/TSX Venture (CDNX) | 570.27 | 605.08 | (1.1)% | 6.1% | down | neutral | down (weak) | |
| S&P 600 (small) | 1,157.53 | 1,133.88 | (3.3)% | (2.0)% | down | down | neutral | |
| MSCI World Index | 1,977.74 | 1,986.01 | (4.4)% | 0.4% | down | up (weak) | neutral | |
| Bitcoin | 16,535.23 | 19,944.06 | (10.8)% | 20.6% | down | neutral | up | |
| Gold Mining Stock Indices | ||||||||
| Gold Bugs Index (HUI) | 229.75 | 242.00 | 13.2% | 5.3% | neutral | up | down | |
| TSX Gold Index (TGD) | 277.68 | 298.11 | 12.2% | 7.4% | up | up | down | |
| % | ||||||||
| U.S. 10-Year Treasury Bond yield | 3.88% | 3.44% | (6.8)% | (11.3)% | ||||
| Cdn. 10-Year Bond CGB yield | 3.29% | 2.78% | (7.0)% | (15.5)% | ||||
| Recession Watch Spreads | ||||||||
| U.S. 2-year 10-year Treasury spread | (0.55)% | (0.42)% | 52.8% | (23.6)% | ||||
| Cdn 2-year 10-year CGB spread | (0.76)% | (0.77)% | 22.2% | (1.3)% | ||||
| Currencies | ||||||||
| US$ Index | 103.27 | 104.15 | (0.3)% | 0.9 | up | down (weak) | up | |
| Canadian $ | 73.92 | 73.02 | 0.8% | (1.2)% | down | down | down | |
| Euro | 107.04 | 106.63 | 0.2% | (0.4)% | down | up | down | |
| Swiss Franc | 108.15 | 107.89 | (0.6)% | (0.2)% | neutral | up | neutral | |
| British Pound | 120.96 | 121.74 | 1.2% | 0.6% | neutral | down | down | |
| Japanese Yen | 76.27 | 75.76 | 2.2% | (0.7)% | up (weak) | neutral | down | |
| Precious Metals | ||||||||
| Gold | 1,826.20 | 1,973.50 | 5.7% | 8.1% | up | up | up | |
| Silver | 24.04 | 22.46 | 9.5% | (6.6)% | neutral | up (weak) | neutral | |
| Platinum | 1,082.90 | 978.60 | 1.7% | (9.6)% | neutral | up (weak) | up | |
| Base Metals | ||||||||
| Palladium | 1,798.00 | 1,386.10 | 1.8% | (22.9)% | down | down | down | |
| Copper | 3.81 | 4.89 | (3.5)% | 2.1% | down | up | up (weak) | |
| Energy | ||||||||
| WTI Oil | 80.26 | 66.93 | (12.7)% | (16.6)% | down | down | neutral | |
| Nat Gas | 4.48 | 2.34 | (3.7)% | (47.8)% | down | down | down (weak) | |
New highs/lows refer to new 52-week highs/lows and, in some cases, all-time highs.
__
(Featured image by Adam Nowakowski via Unsplash)
DISCLAIMER: This article was written by a third party contributor and does not reflect the opinion of Born2Invest, its management, staff or its associates. Please review our disclaimer for more information.
This article may include forward-looking statements. These forward-looking statements generally are identified by the words “believe,” “project,” “estimate,” “become,” “plan,” “will,” and similar expressions. These forward-looking statements involve known and unknown risks as well as uncertainties, including those discussed in the following cautionary statements and elsewhere in this article and on this site. Although the Company may believe that its expectations are based on reasonable assumptions, the actual results that the Company may achieve may differ materially from any forward-looking statements, which reflect the opinions of the management of the Company only as of the date hereof. Additionally, please make sure to read these important disclosures.
Copyright David Chapman 2023
David Chapman is not a registered advisory service and is not an exempt market dealer (EMD) nor a licensed financial advisor. He does not and cannot give individualised market advice. David Chapman has worked in the financial industry for over 40 years including large financial corporations, banks, and investment dealers. The information in this newsletter is intended only for informational and educational purposes. It should not be construed as an offer, a solicitation of an offer or sale of any security. Every effort is made to provide accurate and complete information. However, we cannot guarantee that there will be no errors. We make no claims, promises or guarantees about the accuracy, completeness, or adequacy of the contents of this commentary and expressly disclaim liability for errors and omissions in the contents of this commentary. David Chapman will always use his best efforts to ensure the accuracy and timeliness of all information. The reader assumes all risk when trading in securities and David Chapman advises consulting a licensed professional financial advisor or portfolio manager such as Enriched Investing Incorporated before proceeding with any trade or idea presented in this newsletter. David Chapman may own shares in companies mentioned in this newsletter. Before making an investment, prospective investors should review each security’s offering documents which summarize the objectives, fees, expenses and associated risks. David Chapman shares his ideas and opinions for informational and educational purposes only and expects the reader to perform due diligence before considering a position in any security. That includes consulting with your own licensed professional financial advisor such as Enriched Investing Incorporated. Performance is not guaranteed, values change frequently, and past performance may not be repeated.


Avant Devices Moves Toward Electric Wheelchair Kit Production with New Funding Drive
Murcia-based Avant Devices is seeking €260,000 in crowdfunding to launch mass production of its electric wheelchair conversion kit. The funds...


Legend Biotech: Growth Driven by CAR-T Innovation and Carvykti Expansion
Legend Biotech's stock reflects demand for innovative CAR-T cancer therapies. The US biotech focuses on commercializing Carvykti with partner Janssen...


Senegal’s Debt Strategy: Choosing Between Restructuring and Financial Innovation
Senegal’s upcoming choice of debt advisor, with Lazard reportedly leading the race, reflects a broader strategic decision. Rather than pursuing...


Pictet Raises $253 Million for Environmental Investment Fund
Pictet Group closed its Environment Co-Investment Fund I at $253 million, surpassing its $200 million goal. The Article 8 SFDR...


Virginia Cannabis Market Could Reshape Regional Competition
Virginia’s planned recreational cannabis market could reshape the Washington region’s economic landscape. With nine million residents, it may draw consumers...
 |
|
 |  |
 |
|
-

 Cannabis2 weeks ago
Virginia’s Cannabis Journey: A Lesson in Why Legalization Requires More Than a Law
-
 Impact Investing2 days ago
Pictet Raises $253 Million for Environmental Investment Fund
-

 Fintech1 week ago
Payhawk Reaches $100M ARR Milestone with AI-Driven Growth
-
 Cannabis2 weeks ago
Uruguay and Brazil Deepen Medical Cannabis Cooperation