Featured
Gold declines as Trump urges the Fed to cut rates
The Fed does not report to the White House so these calls from Kudlow and Trump are unprecedented. The Fed (FOMC) next meets April 30 and May 1.

Thanks to Elliott Wave International (EW) we are repeating our thoughts on it for our readers of an interesting market symmetry EW noted in a recent commentary. EW titled it “Two Similar Topping Processes.” It looks at three tops in our current market 2018-2019 and compares them with three similar tops seen in 1999-2000.
In addition to the fascinating potential topping process, we look at gold’s drop this week, and we comment on the recent calls by Trump’s economic advisor Larry Kudlow and President Trump himself for the Fed to immediately cut rates by 50 bp. We close with a note on the stronger than expected January GDP reported for Canada.
EW recently noted an interesting piece of market symmetry in an addendum to its March 2019 Elliott Wave Theorist dated March 26, 2019. We thought it interesting enough to repeat it to the readers of the Technical Scoop.
What EW showed was how the topping process of 2018–2019 has mirrored to a “striking degree” the topping process of 1999–2000. It is not exact, as we do note. We also note below some minor differences in our chart and EW’s chart.
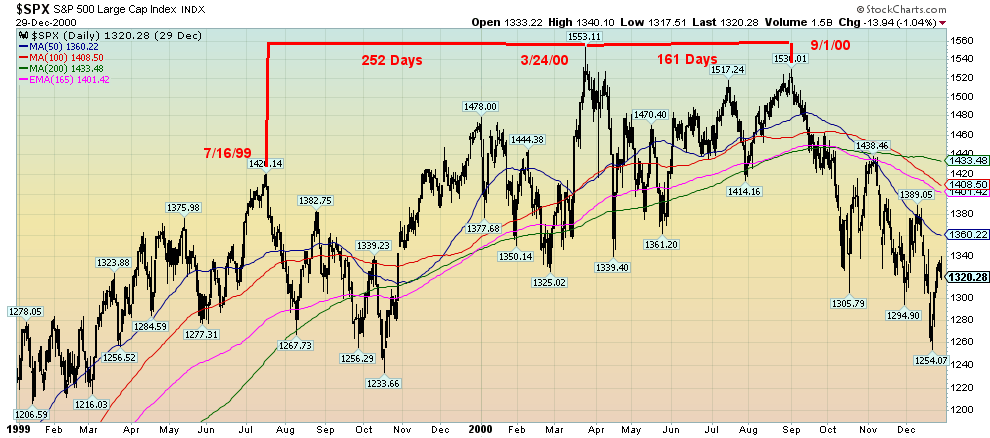
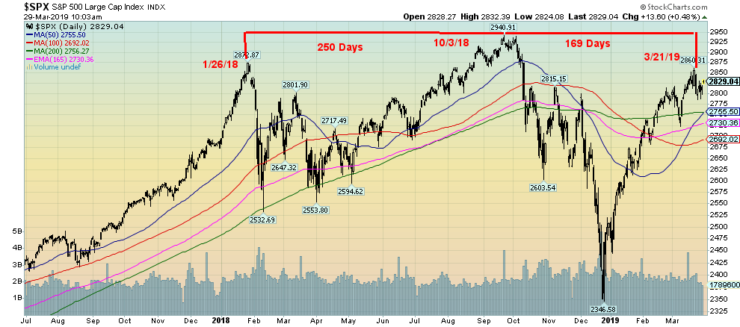
The high on July 16, 1999, was an interesting one. On that date, both the S&P/Gold and S&P/CRB ratios made their all-time highs. What that means is the S&P 500 in terms of both gold (real money) and the CRB (commodities) made their all-time high. Interestingly, the NYSE Composite made its all-time high (to date) also on the first date January 26, 2018. Some more interesting comparisons. In the second peak period, the S&P 500 made its all-time high at the time on March 24, 2000. The second peak period of October 3, 2018, marked the all-time high (to date) of the Dow Jones Industrials (DJI). As to the third peak, we have noted the high day of the S&P 500; however, EW notes instead of the intra-day high of the NYSE on September 11, 2001. That date aligns better in terms of days with the high of March 21, 2019.
We note this as the stock markets have been on a downswing since topping on March 21, 2019. Naturally, if that high is subsequently taken out then this exercise is just that—an exercise, albeit a somewhat interesting one. Given the rise since December 2018, we have wondered whether that five-wave rise is just an A wave up. A B-wave down should now be underway. Once that wave is complete, a C wave to the upside could get underway.
To preserve the March 21, 2019 top, it may be that the C wave up is a flat that does not quite take out that high. The wave could also unfold an ABCDE-type triangle before beginning a wave to the downside. Following the high of September 1, 2000, the market did begin a choppy decline that found a low on October 18, 2000. A short-lived rally followed that made a lower top on November 6, 2000. That high was nowhere near the September 1, 2000 high. Another decline took place that found a low on December 21, 2000, followed by another lower high on January 31, 2001. It was after that high that the stock market began a more serious decline. If markets were to follow a similar path today that would take us to August 10, 2019, for a final top.
Our focus shifts to two lows of importance. The first low is the recent one on March 25, 2019, at 2,785 and the second one of more importance is the low of March 8, 2019, at 2,722. If these two lows are taken out, then odds highly favor a steeper decline. An even more concerning decline could take place if the S&P 500 were to break below 2,600 and the low of January 23, 2019, at 2,613. The final line in the sand would be seen below 2,367. Below that level, new lows could be possible.
Matching Triple Tops? July 1999 – September 2000, January 2019 – March 2019
The EW comparison is fascinating, given the symmetry in the markets. As noted, however, new highs would make this an academic exercise. As long as key areas noted above hold then the potential for the market to regain the highs remains alive and well. We can’t help but note that the NYSE advance-decline line once again shot to new all-time highs this past week. Other stock market indicators such as the McLellan Oscillator, McLellan Summation Index and the NYSE new highs-new lows Index, and the NYSE up volume-down volume Index remain positive. We note as well that comparable indicators on the NASDAQ are not quite as robust. So, a few mixed signals here. But the new all-time highs of the NYSE advance-decline line suggests that the stock market could once again make new all-time highs.
Gold, along with silver and the gold stocks, took a tumble this past week. Gold fell 1.1 percent while silver was off almost 2.0 percent. The gold stocks as represented by the Gold Bugs Index (HUI) and the TSX Gold Index (TGD) both fell roughly 1.9 percent. Pushing gold down was a higher US$ Index (+0.7 percent on the week) and a lower Euro (down 0.6 percent). Gold was pushed down at one point by almost $25 on March 28, 2019. There were rumors of central bank selling, in particular, the Bank for International Settlements (BIS). The story was the BIS forced gold lower to help the mark-to-market of gold derivatives at the bullion banks. That forced gold into backwardation and strong physical buying of gold at lower prices were noted. We note as well that the commercial COT for gold slid to 34 percent from 38 percent, but the commercial COT for silver only slipped to 37 percent from 38 percent. Most of the selling by the commercials was unwinding of long open interest although some short selling also took place. We do not view the commercial COT as being overly bearish.
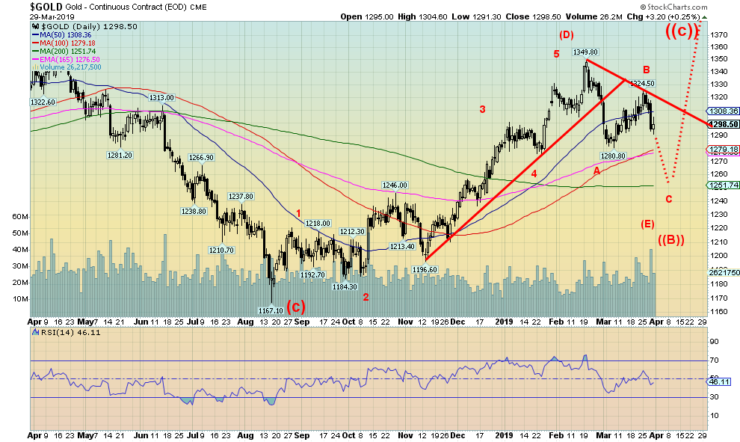
All of this fits with our thoughts that gold is the throes of an E wave to the downside. The E wave could unfold as an ABC pattern or an ABCDE-type pattern. Ultimately, potential targets are around $1,250, give or take, and we could go into May before we see the final low. We note that sentiment, as reported by EW, is still around 63 percent so it has a lot of room to move lower. A move to 15 percent or lower in sentiment would not be surprising at the lows.
Silver broke its channel line at $15.15, closing at $15.11. Silver now appears to be targeting down to $14.40 to $14.80. Palladium finally put in a bad week, falling almost 14 percent to $1,341. Nothing, in particular, was noted for the fall except the rising U.S. dollar and high prices scaring off buyers.
As gold goes lower, we expect the U.S. dollar will move higher above 97. The US$ Index was up 0.7 percent this past week to 96.85. While U.S. economic numbers are softening, they remain more buoyant than comparable numbers in the eurozone. China is softening but still maintains 6 percent plus growth. The eurozone is slowing but it is not officially in recession. Same with Japan.
There are a number of economic numbers to watch this coming week, including retail sales for February (expected +0.3 percent), U.S. PMI (expected +52.5, anything above 50 is positive and suggest the economy remains healthy), and nonfarm payrolls for March (expected +170 thousand following the 20 thousand gain in February). The unemployment rate is expected to remain at 3.8 percent.
We are hearing increasing cries from President Trump’s economic advisor Larry Kudlow and President Trump himself for the Fed to immediately cut its benchmark rate by 50 bp. The cry is also being repeated by Trump’s nominee for the Fed Stephen Moore. Moore has not yet been confirmed and there is some doubt he will be confirmed given his lack of an economic banking background and that he is seen as too much of a Trump partisan. Nonetheless, the cries are strongly emanating from the White House for the Fed to immediately acquiesce to their demands.
It is highly unlikely to happen. The FOMC does not meet again until April 30, May 1. The Fed does not take direction from the White House. The Fed is an independent agency created by an Act of Congress. Its policy decisions do not have to be approved by the White House, nor any legislative branch of government. It does not receive funding from Congress. Its board of governors spans multiple congressional and presidential terms. The Chairman of the Fed (Jerome Powell) is appointed by the President but does not report to the President or Congress. The Chairman can only be fired “for cause” and not because he fails to do the President’s bidding as to interest rate policy.
Nonetheless, the constant barrage from the White House is “high theater,’’ but the Chairman of the Fed and the Fed itself can and do ignore it.
Interest rates have continued to fall. This past week the 10-year U.S. Treasury note fell to 2.41 percent down from the previous week’s 2.44 percent. The low on the week was 2.39 percent. The 10-year minus 2-year spread, however, rose to 14 bp from 13 bp. That closely watched spread is not signaling recession any time soon. After slipping into negative territory the previous week, the 10-year minus 3-month treasury bill spread returned positive +1 bp.
There was heavy demand for 3-month treasury bills this past week as traders shortened their maturities. Bond sentiment as reported by EW hit 93 percent this past week, a level often associated with tops in bond prices (low in yields as yields move inversely to prices). If that proves to be correct then bond yields could rise in the coming weeks. That is something the market is not expecting. The fall in yields may have to have overshot its mark. Over the past week or two recession hysteria has hit the market. However, while there is admitted slowing there are few signs that a recession is imminent either in the U.S. or the eurozone and certainly not China.
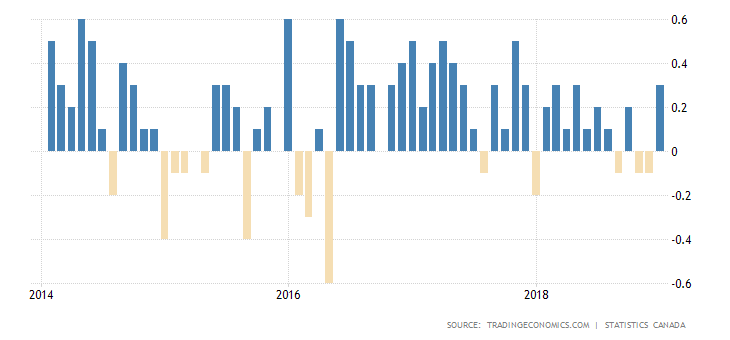
With Canada reporting stronger than expected economic data for January for both the trade data and GDP, this helped strengthen the Canadian dollar in the past week and held the 10-year Government of Canada bond, unchanged on the week at 1.60 percent. The 10-year minus 2-year spread rose slightly to 7 bp from 6 bp, indicating that a recession remains sometime in the future.
Canada GDP Month over Month
(Featured image by Oliver Le Moal via Shutterstock)
—
DISCLAIMER: David Chapman is not a registered advisory service and is not an exempt market dealer (EMD). We do not and cannot give individualized market advice. The information in this article is intended only for informational and educational purposes. It should not be considered a solicitation of an offer or sale of any security. The reader assumes all risk when trading in securities and David Chapman advises consulting a licensed professional financial advisor before proceeding with any trade or idea presented in this article. We share our ideas and opinions for informational and educational purposes only and expect the reader to perform due diligence before considering a position in any security. That includes consulting with your own licensed professional financial advisor.


Youth Cannabis Use in Colorado Is Falling — But the Full Story Is More Complex
The 2026 Colorado survey shows teen cannabis use fell to 10 percent in 2025, down from 21 percent in 2015....


Morocco’s Growth Holds at 4.6% as Agriculture Offsets Economic Pressures
Morocco’s economy grew 4.6% in Q1 2026, driven by a strong agricultural rebound offsetting declines in industry. Services expanded moderately...


Abivax Shares Surge as New Trial Data Eases Safety Concerns Over Ulcerative Colitis Drug
Abivax shares surged nearly 36% after positive updated trial results for its ulcerative colitis drug obefazimod reassured investors following earlier...


El Dorado Raises $9M to Expand Cross-Border Fintech Platform
El Dorado, a Latin American fintech improving cross-border financial services, raised a $9 million Series A led by Paradigm with...


Bitcoin Stalls Near $60K as Strategy Moves, ETFs Outflow, and EU MiCA Rules Take Effect
Bitcoin hovers near $60,000 with ETF outflows, while Strategy boosts reserves, sells BTC, and raises dividends to reassure investors. Ethereum...
 |
|
 |  |
 |
|
-

 Impact Investing1 week ago
Edison Accelerates Renewable Growth and ESG Impact in 2025
-
 Africa3 hours ago
Morocco’s Growth Holds at 4.6% as Agriculture Offsets Economic Pressures
-

 Cannabis1 week ago
Spain Cannabis Laws: Private Use, Fines, and Grey Areas
-

 Crowdfunding2 weeks ago
Wyrmgold Launches Crowdfunding Campaign for Believe in me! (please)