Featured
Stock markets surge ahead of US, Canada holiday
The major U.S. indices rose on average 3%. Most are now up 10%-15% on the year. Are we on the cusp of a blow-off move?

Since the low in December stock markets have gone almost straight up with barely a pause. Bears will continue to say this is temporary while bulls are becoming excited. We look at some indicators that continue to support a rising market. We note potential targets up to 30,000 DJI. Does it all make sense? Blow-offs never make any sense.
Debt is the bane of the world and no more so than in the U.S. that holds roughly 29% of all global debt. We take a look at the U.S. where the national debt just passed $22 trillion with barely a mention anywhere. The U.S. is now adding to that by another trillion every year. Debt it seems has also become a runaway train.
Our recession spread narrowed again this week and now appears to be headed lower. But still far from being negative. The U.S. dollar soared but then pulled back abruptly on Friday. That helped push gold higher.
The big news in Canada is the SNC Lavalin scandal. So we look at SNC’s chart. It’s not pretty. The fear is that this company could go into freefall if it was criminally convicted. Given its importance to the Quebec economy and large investments held by Quebec’s pension fund the Caisse de Depot, it would not go over well in Quebec. Right now the chart is in no man’s land. It doesn’t look as if it is going to go up any time soon and the risk remains heavily to the downside.
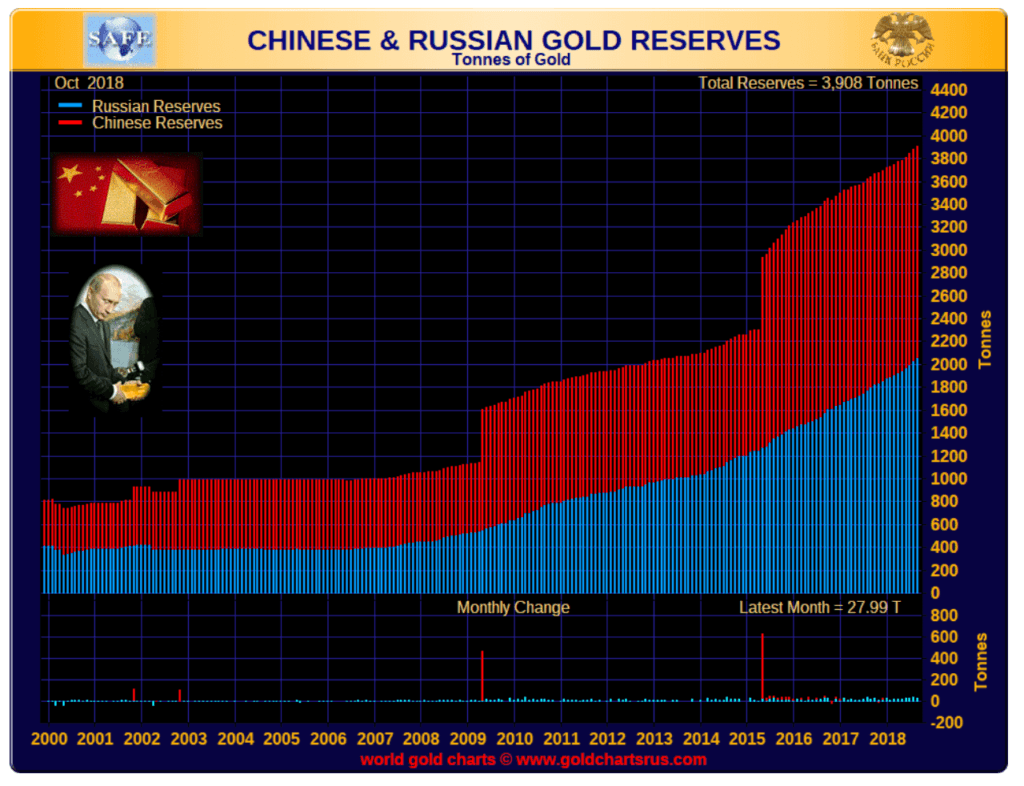
Our Chart of the Week looks at Central bank gold purchases particularly Russia and China.
The US national debt
$22 trillion. Or to be more exact $22.023 trillion. That’s the U.S. national debt. It is 105% of GDP. In passing $22 trillion, no announcements were made, no bells went off, no alarms were sounded, and there were no celebrations. That is almost 9% of global debt and nobody cares. Why? Because it is the U.S. government and they can write unlimited dollars through the Fed. It will never be paid back. Interesting because China owns $1.121 trillion as of November 2018, the largest foreign holder of U.S. national debt.
U.S. total debt is now $72.249 trillion and nobody seems to care about that either. Total debt is the U.S. national debt plus state and municipal debt, corporate debt, and personal debt (mortgages, student loans, car loans, credit card debt). That’s almost 29% of global debt which is now at least $250 trillion. Ten years ago, it was around $140 trillion.
And nobody cares. After all, it fuels the economy and the stock market. But, at some point, a crisis develops. Then there is bankruptcy, followed by a major bankruptcy, and then a debt crisis. This is not a “maybe” or a “might.” There will be, over the next few years, a debt crisis of considerable proportion. We don’t know where it will start or how big it will be, but it is highly likely to happen.
The signs are all there. Shaky banking systems in the EU, particularly Italy and Spain, which could leave German and French banks vulnerable. A shaky banking system in China that could bring down the massive amount of Chinese debt, much of it borrowed in U.S. dollars. PBOC (People’s Bank of China) could bail them out. PBOC is probably one of the few central banks that might have the capacity for a bailout. Not the other ones—not the ECB, not the Fed, not the BOE, or the BOJ. No wonder they passed laws that in the next banking crisis depositors and bondholders will pay as their deposits and debt are converted to equity. A bail-in, not a bail-out.
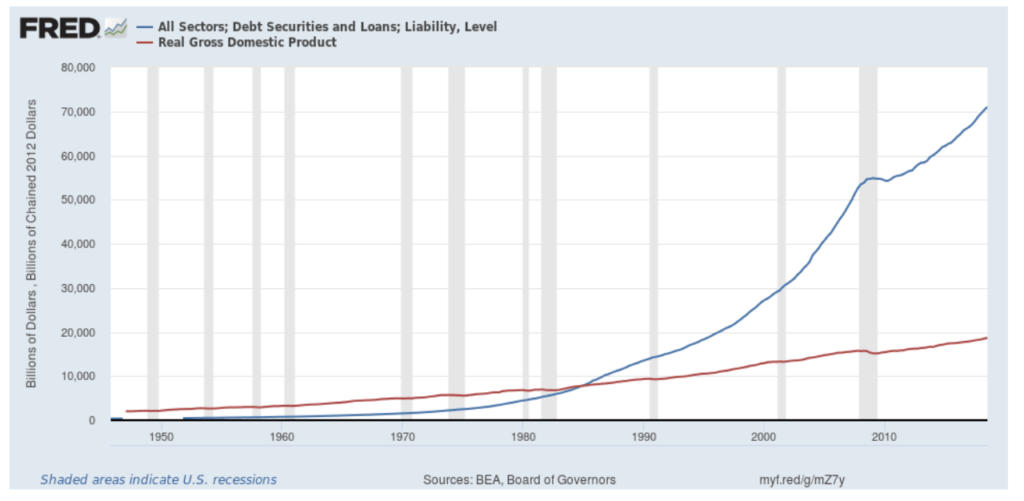
Here is a picture of the massive debt growth vs. the growth of GDP. In Q4 1984 the two were about equal. Now debt is almost four times GDP. From 1984 onward it has taken $5.80 of new debt to create $1 of GDP. Debt is in a bubble, a bubble that is growing skyward at an incredible pace. To add to the debt there is also what is known as unfunded liabilities. That totals $122.6 trillion. Unfunded liabilities are primarily Social Security and Medicare.
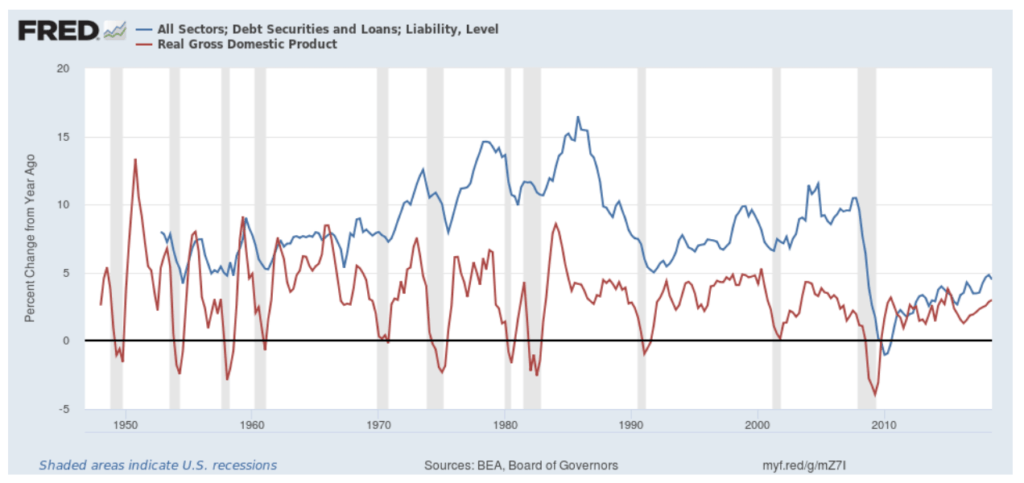
The above chart shows the annual growth of debt vs. annual growth of GDP. The growth of debt has clearly outstripped growth in the GDP. It is interesting that annual growth for debt picked up in the 1970s, peaking in the 1980s. It was in the 1970s that debt growth got underway, generally coinciding with the end of the gold standard in 1971.
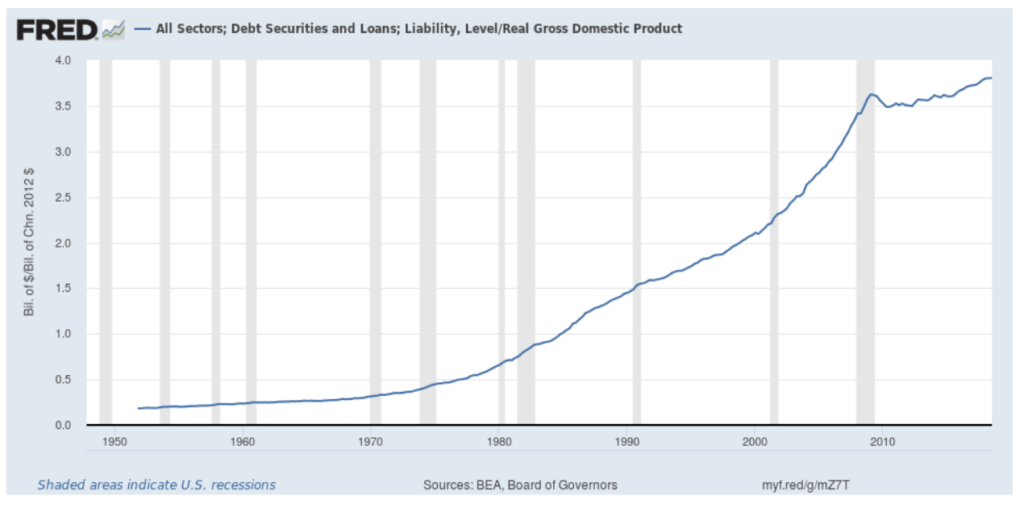
This is a chart of all debt to GDP. As of Q2 2018, the total debt to GDP stood at 380% or 3.8:1. In 1984, the ratio was 1:1. All G7 nations have seen their debt to GDP soar in the past 35 years or so. Global debt-to-GDP stands around 320% with some nations such as the United Kingdom and Japan having a total debt-to-GDP exceeding 600%. Debt growth has fueled the stock markets and has helped keep GDP growth positive.
After dipping following the 2008 financial crisis, debt growth has started to rise again, but at a much slower pace. Unless debt growth continues to rise, slowing debt growth would have a negative impact on GDP growth and the stock market. Debt is essential to the growth of the economy and to the rise of the stock market. Debt is essential to our way of life.
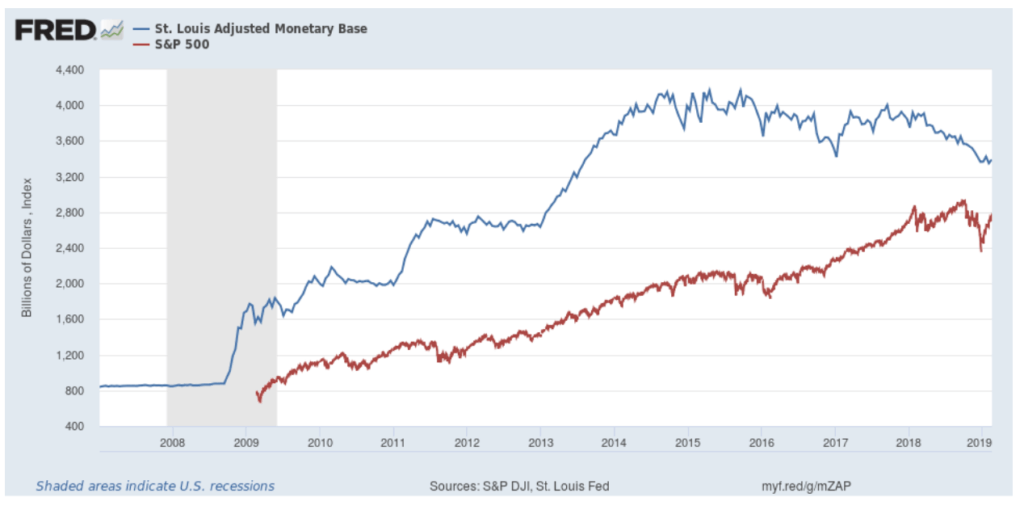
Here is another view of what drove the stock market and the economy over the past several years. After the 2008 financial crisis, the Fed poured billions (trillions?) into the markets through quantitative easing (QE). The monetary base exploded from about $900 billion in 2008 to $4.1 trillion by September 2014. When it was announced that QE would be ending, the stock market hesitated through 2015/2016.
Despite no more QE, the stock market resumed its rise in 2016 on hopes of massive tax cuts and business-friendly policies from the Trump administration. That started to change in 2017 when the Fed started quantitative tightening (QT). With funds being pulled out of the financial system by the Fed, trade wars, and rising interest rates it hit the stock markets. By year-end, the stock markets finished down on the year.
Now the stock market is rising again on hopes that the Fed is finished hiking interest rates and they might even begin to ease. The Fed has also announced a slowing in QT. There are some signs that the economy is softening. In December, retail sales ex-autos plunged 1.8% when the market expected a gain of 0.1%. Given that November was flat, retail sales are actually falling into a slump. That was the Christmas season and it hints that it was not very good.
With slowing debt growth, QT, and slowing economies in the EU, Japan, and China, the odds of the U.S. escaping a slowdown are slim. That should eventually work its way into the stock market too. The question is when. Right now, nothing seems to stop the rising stock market. It is rising on hope. Hope that the worst is over for the consumer because the most recent consumer sentiment numbers rebounded from the previous month’s low, hope that the U.S.-China trade talks are successful, and hope that with the shutdown averted things might return to normal. While Trump’s declaration of a national emergency in order to obtain funding for the “wall” will face a constitutional challenge, that is not expected to have any negative impact on the market.
Everything looks rosy right now. Confidence has come back into the markets. But is it false confidence? Or complacency? This is not unusual following the initial breakdown in the market. But if the market is going to rise higher, it needs fuel. And fuel means debt. It would help as well if the Fed eased and even supplied some QE. We have seen how it fuelled the market from 2009. But debt reaches its limits and it may be at that point. And the Fed needs to return to the easy monetary conditions of 2009–2014. But that is not about to happen any time soon.
Can debt grow further? Consumer and corporate debt growth are stalling, but government debt continues to grow. Delinquencies are rising in auto loans, student loans, and corporate debt. The U.S. national debt is now growing by $1 trillion a year. There were no celebrations when it hit $22 trillion and it is not likely to see any celebrations when it hits $23 trillion less than a year from now.
Markets and trends
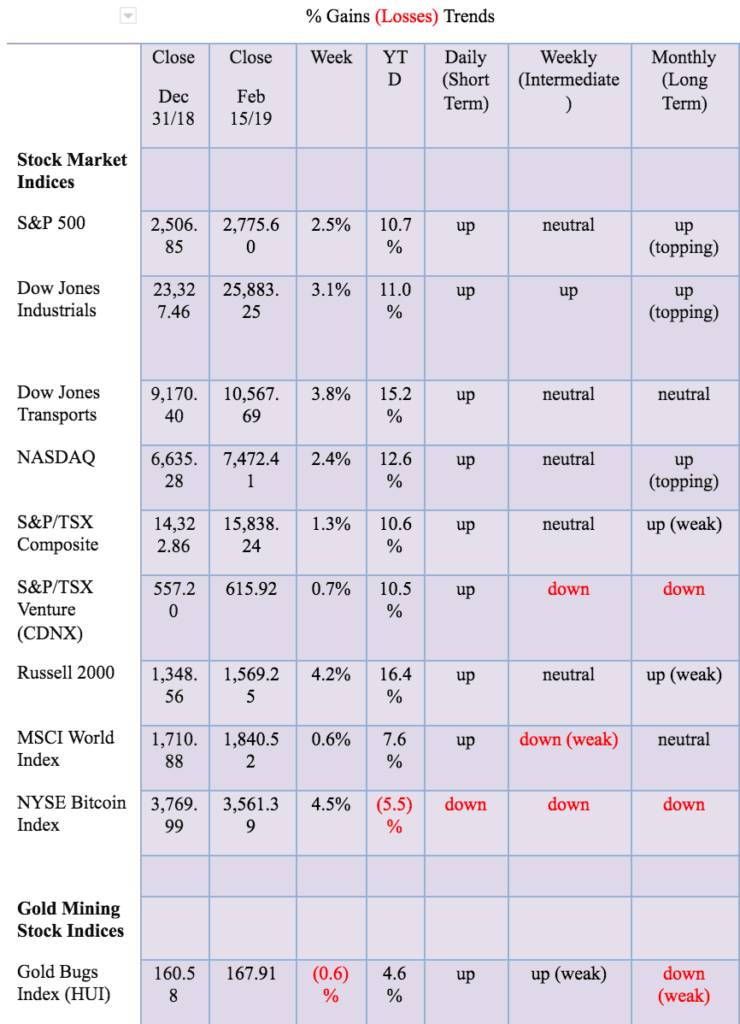
Equities surged again this week. This week, it was rising consumer sentiment, the potential for advances on the China/U.S. trade front, and, dare we say, Trump getting his “wall,” even if it will face a challenge on the constitutional front. They also appear to be averting another shutdown. The S&P 500 jumped 2.5%, the Dow Jones Industrials (DJI) was up 3.1%, the Dow Jones Transportations (DJT) was up 3.8%, while the NASDAQ gained 2.4%. The advance was a broad one. Elsewhere, the TSX Composite gained 1.3% while the TSX Venture Exchange (CDNX) was up 0.7%. The small-cap Russell 2000 index gained 4.2%. Internationally, the FTSE 100 was up 2.4%, China’s Shanghai Index (SSEC) continued its recent winning ways up 3.9%, the Tokyo Nikkei Dow (TKN) gained almost 4%. In the eurozone, the Paris CAC 40 was up 3.9% while the German DAX was up 1.7%.
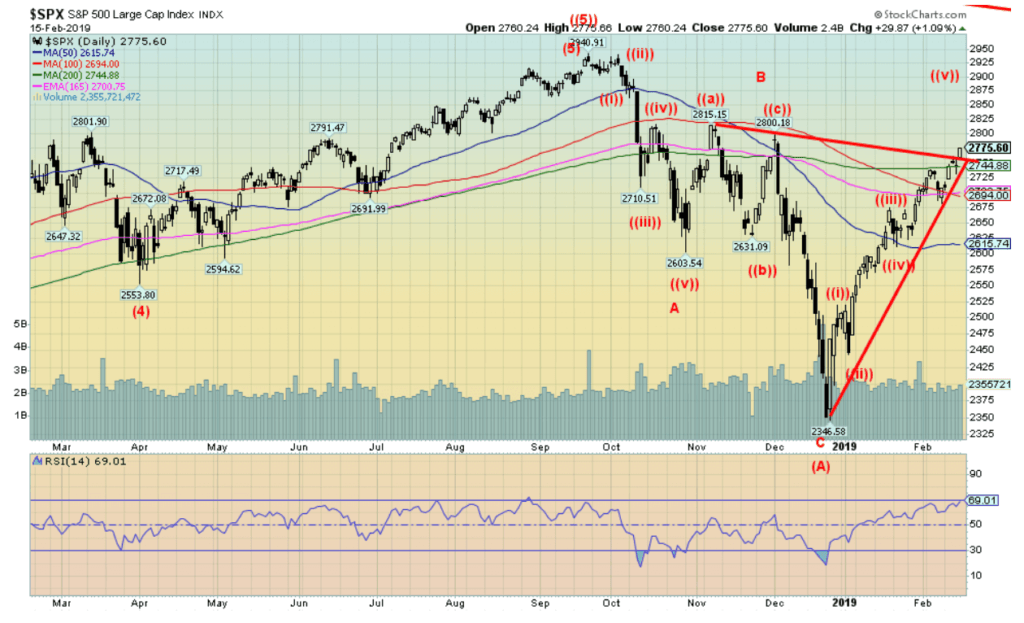
We continue to wonder whether we could really be on the cusp of a blow-away move. While we think that is a bit incredulous, we can’t dismiss it altogether. Just remember to exit before the top. The recent drop in the market from October/December 2018 raised the bearish level to high levels. The market continues to remain bearish, fueling the thought of a blow-off. Along the way so far, the stock market has barely pulled back. Now the S&P 500 appears to break out of a bottom pattern. We could argue that the pattern suggests a bull move to new highs at 3,200. The DJI’s target would be around 30,000.
We haven’t seen evidence that the Fed (or others) have flooded the system with liquidity as the market plunged in October/December. But there is no denying that if this rise continues, it could trigger panic buying. The other side of this is that a correction could hit at any time. A break under 2,700 would suggest that a correction is coming. Under 2,600 and it suggests the mini-bull is over.
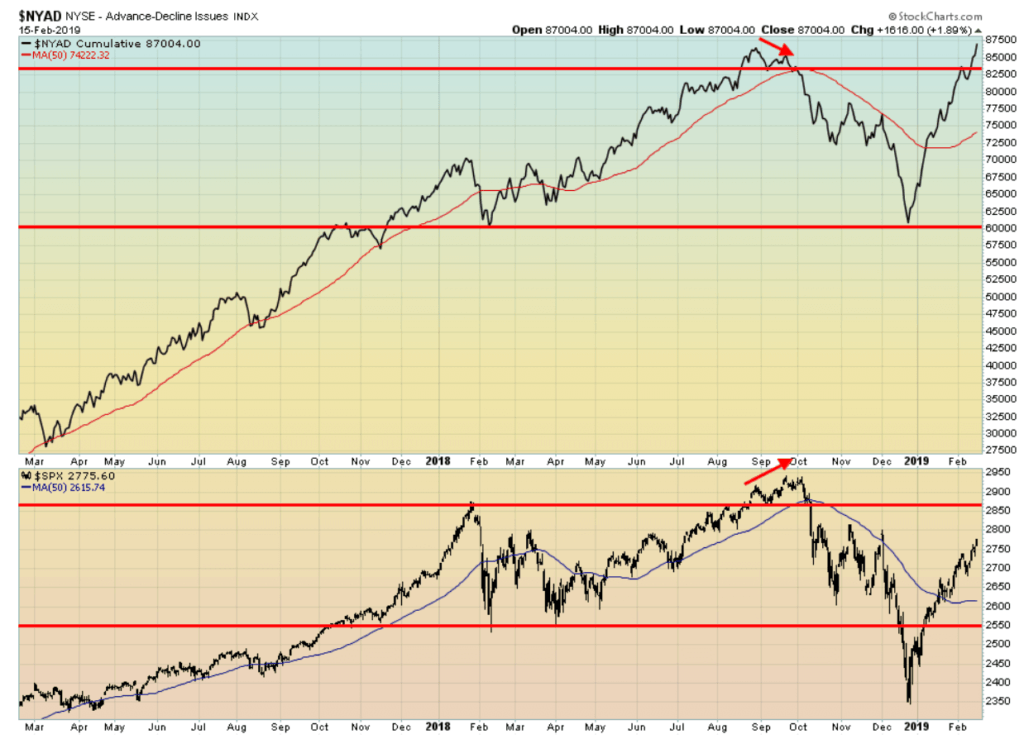
The advance-decline line appears to be leading the way as it has now made new all-time highs. That suggests to us that this market has further to move. The market itself has not made new all-time highs, but this suggests it will.
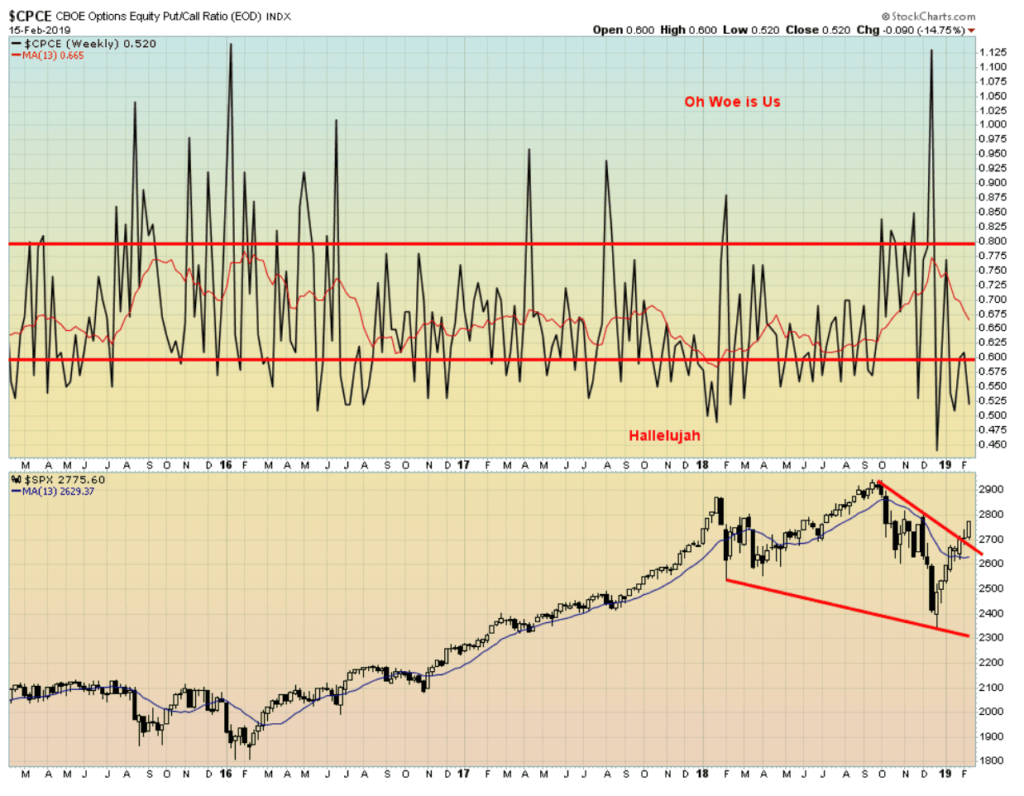
The CBOE equities put/call ratio remains firmly in hallelujah territory with calls outweighing puts. This should suggest that the market could pull back, but so far it is doing the opposite.
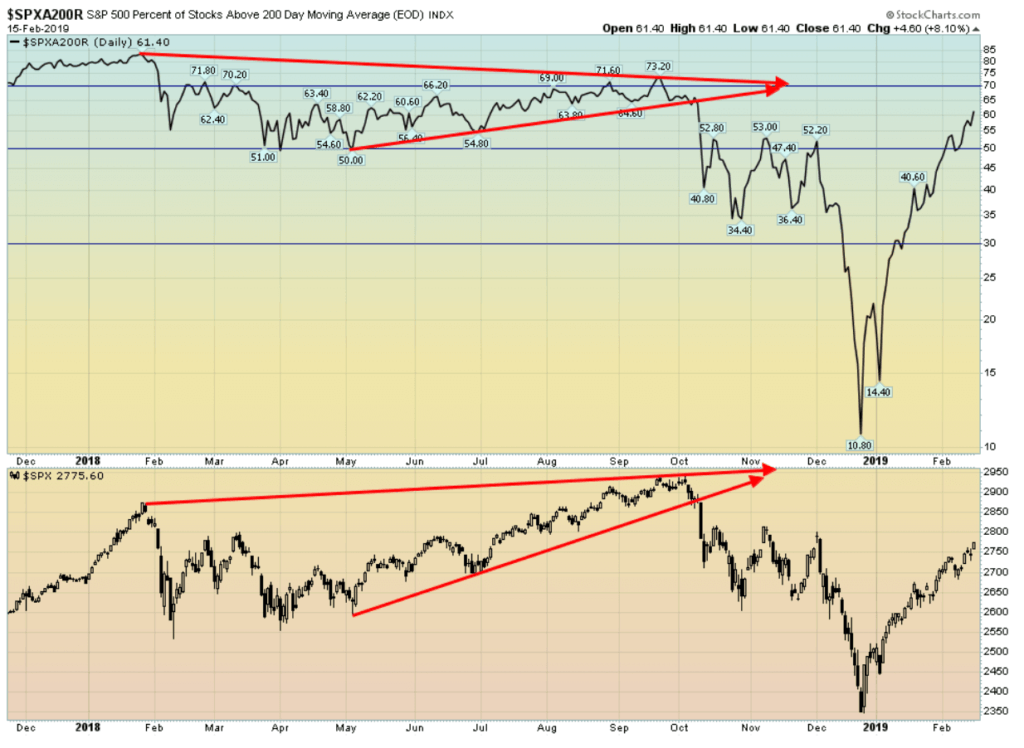
The number of stocks trading over their 200-day MA continues to rise. It is now at 61.4%. That is approaching the territory that was seen during the rise from May to October. It also suggests a very strong move and evidence of a broad advance.
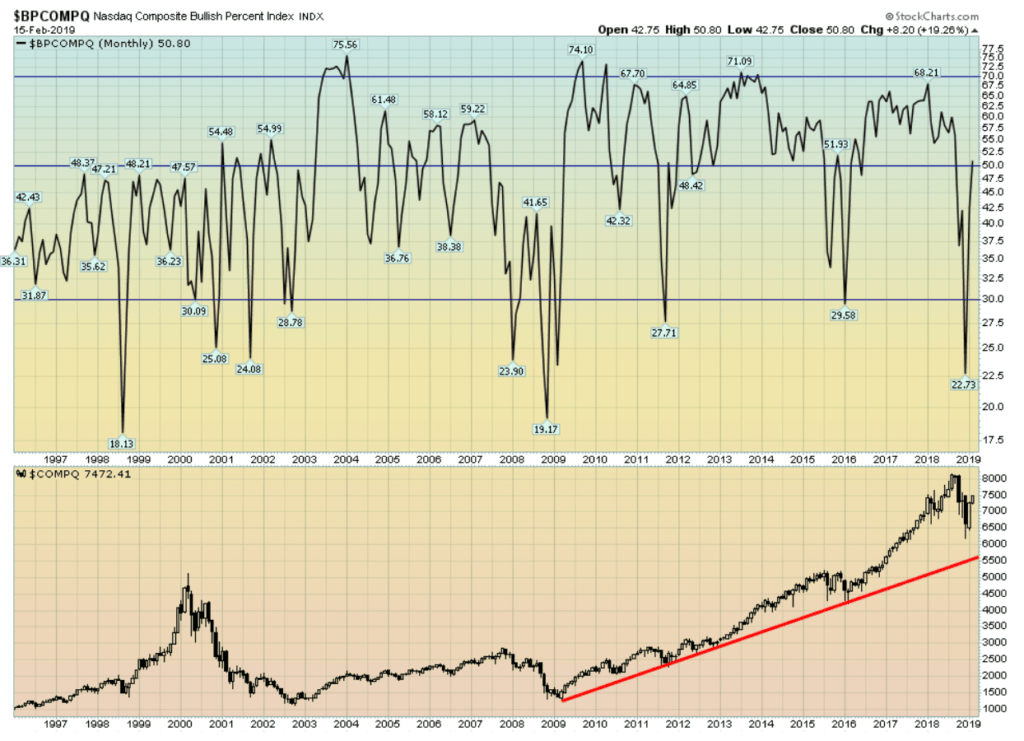
The NASDAQ bullish percent index is also up now over 50%. However, we are not yet at levels that could suggest a top over 70%. So, the NASDAQ could have more upward potential.
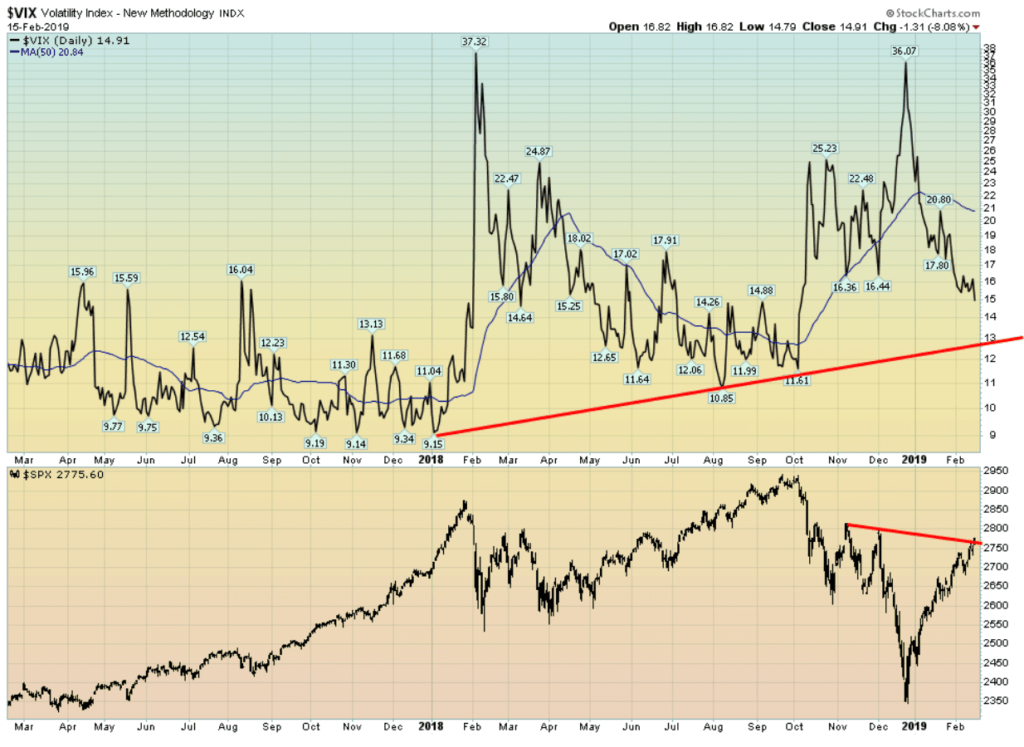
The VIX volatility indicator continues to fall now down to 15. That is still well above the lows of early 2018 when it fell to close to 9, a record low. We see support at 13. We do not believe that, even if the S&P 500 was to make new all-time highs, the VIX will confirm by making a new low.
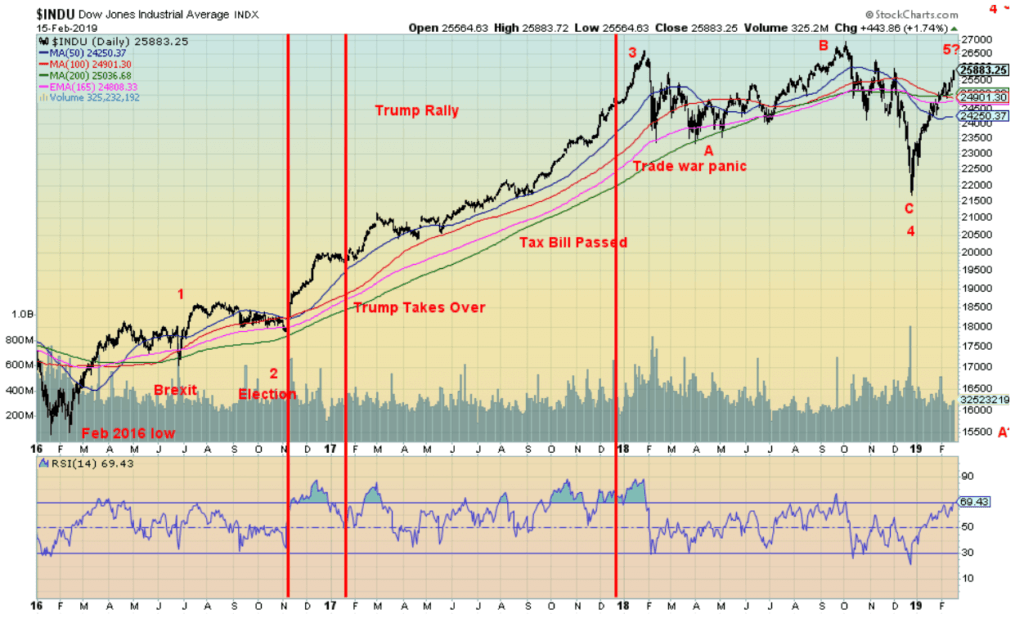
We are playing with the wave count. What if the correction that got underway in January 2018 was it really just a large ABC with the final bottom in December? Wave 2 was a rising correction with the Brexit and election lows. If correct, however, this wave 4 was longer and deeper than what one would expect. However, this would give support to a potential blow-off move for the final up wave.
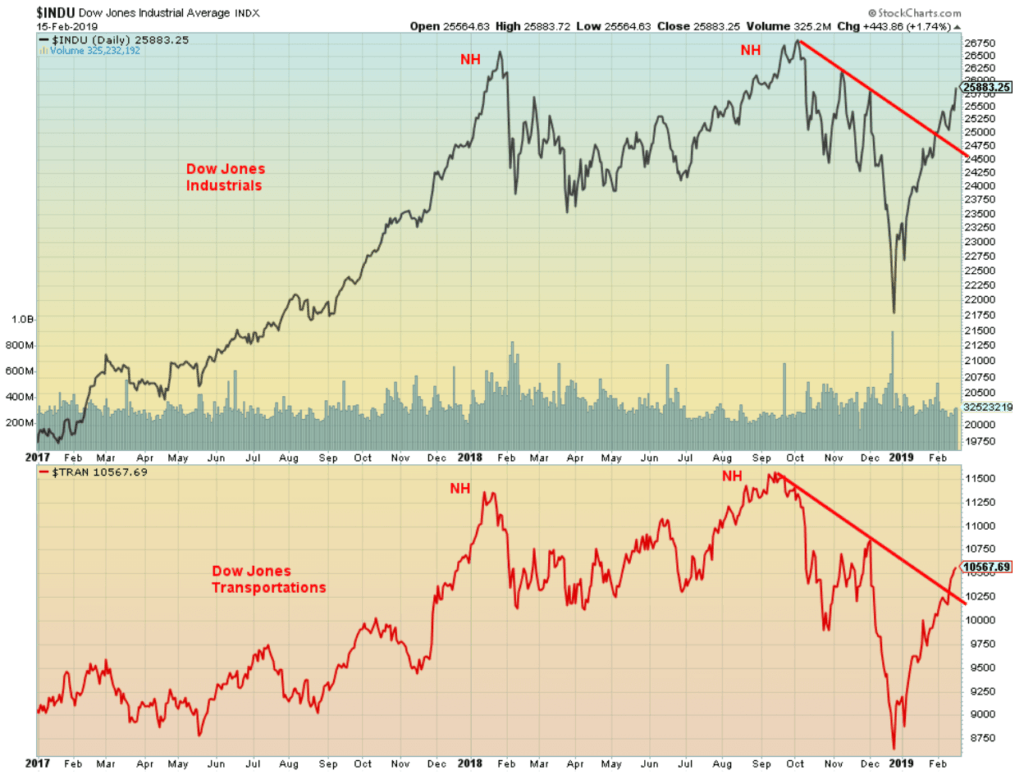
As we continue this advance, we might want to watch the action of both the DJI and the DJT. In October, both the DJI and the DJT made new highs together. If this was a major top, our preference would have been for one to make new all-time highs but not the other. That sets up the Dow Theory divergence that the indices must confirm each other. So, keep an eye on this as we continue to rise. Only one of them should make a new all-time high. However, at the rate they are both rising, both of them making new all-time highs would not be all that surprising. Right now, the DJT is lagging the DJI.
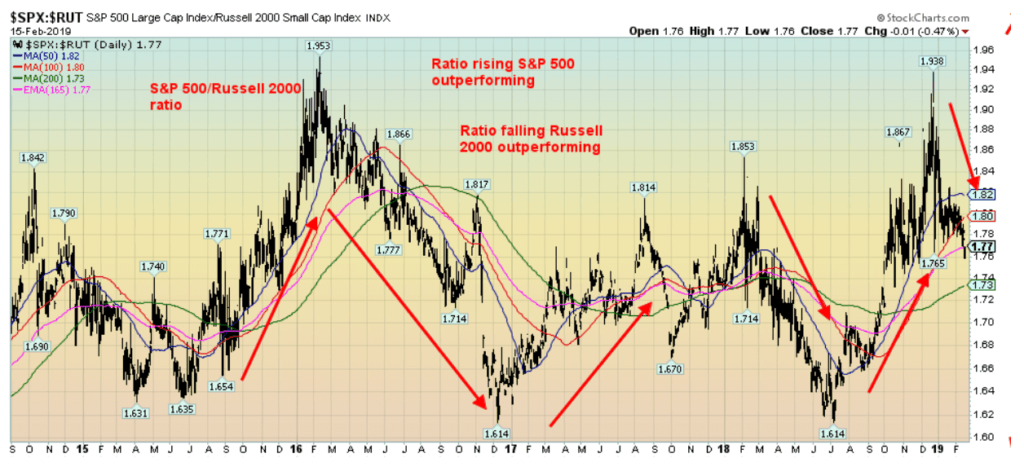
Small-cap vs. large-cap. When the S&P 500/Russell 2000 ratio is rising, the S&P 500 is outperforming. When it is falling, the Russell 2000 is outperforming. During the collapse, it is no surprise that the S&P 500 outperformed. But now the tables have turned and the Russell 2000 is outperforming. This past week the S&P 500 gained 2.5%, but the Russell 2000 was up 4.2%. We expect that, in a market rally, small-cap stocks should outperform large-cap stocks.
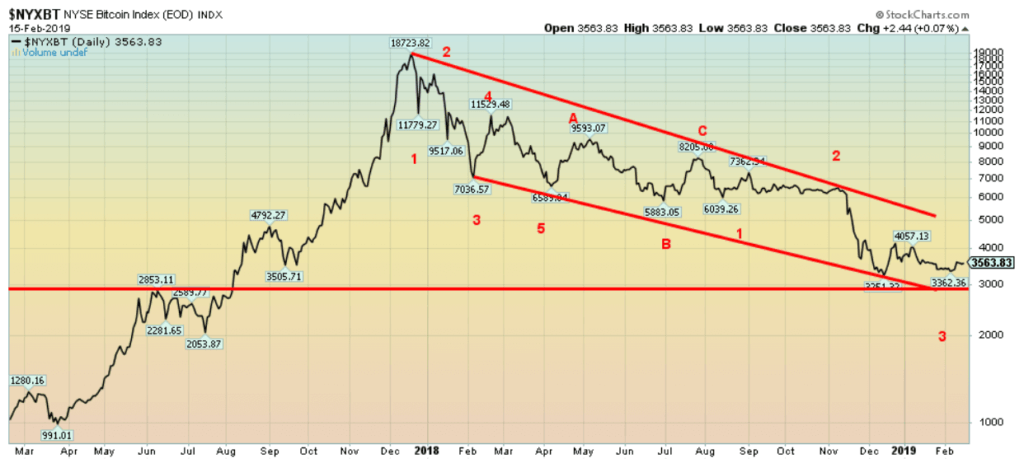
Bitcoin treaded water this past week. But, lurking in the background, is the Quadriga scandal where investors have lost upwards of $250 million. Considering the market cap of the entire crypto industry is $121.2 billion, $250 million is a healthy chunk. We don’t believe it is being reflected yet in Bitcoin’s market cap. Many small cryptos and the exchanges are struggling to stay alive. They’d probably be better off just closing their doors now. Amazingly, Coin Market Cap still listed 2,068 different cryptos, 12 of which still have a market cap of over $1 billion. We read that an ETF slated to have exposure to cryptos was withdrawn, as requested by the SEC. Regulators are hovering. Articles we read at Coin Desk talk about Quadriga, but it doesn’t seem to be considered a big deal, on the surface, at least. We expect that Bitcoin will eventually break $3000 and head for its next level of $2,000, eventually going to levels to $1,000 and lower before this bear is over.
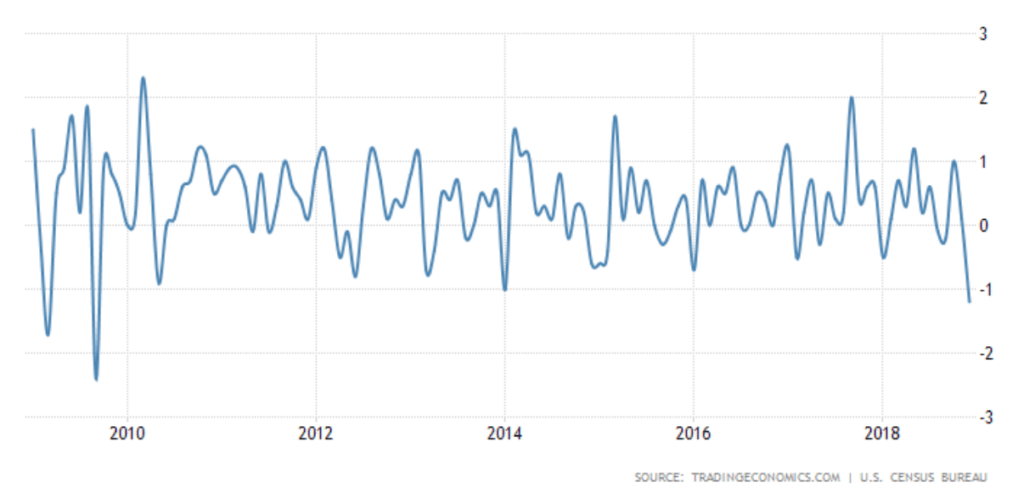
Retail sales broke down last month. In December, they fell 1.2% from the previous month. November was revised to a 0.1% gain. This is one of the biggest monthly drops in the past decade since the financial crisis and recession of 2007–2009. To be precise, it was the biggest drop since September 2009. Can retail sales recover, or is this a sign that things are about to slow down? Our next chart seems to suggest no.
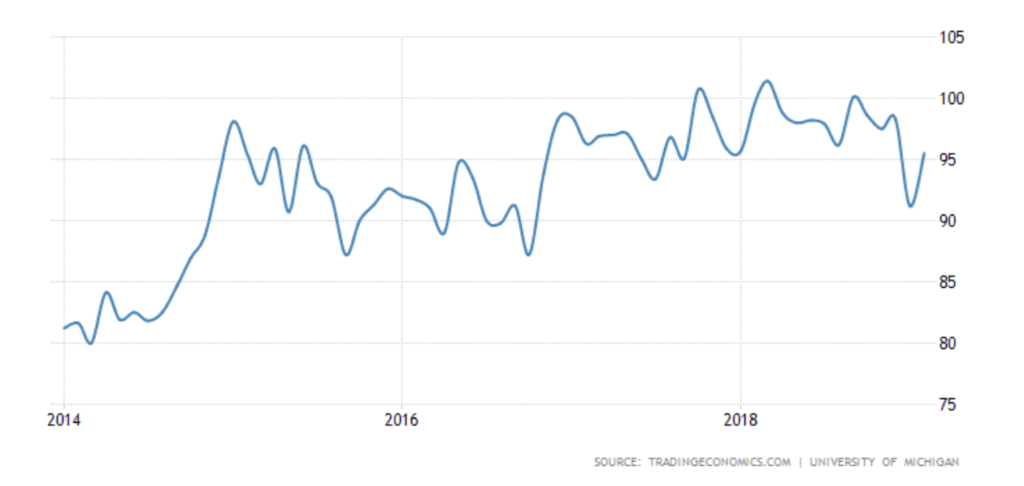
The February University of Michigan consumer sentiment index jumped to 95.5% in February. In January, it had fallen to 91.2% as the shutdown dragged on. But, with the shutdown out of the way and seemingly a deal in the works to prevent another one—plus hopes on the China trade front—the sentiment indicator improved. This, in turn, boosted the stock market as they put the poor December retail sales behind.
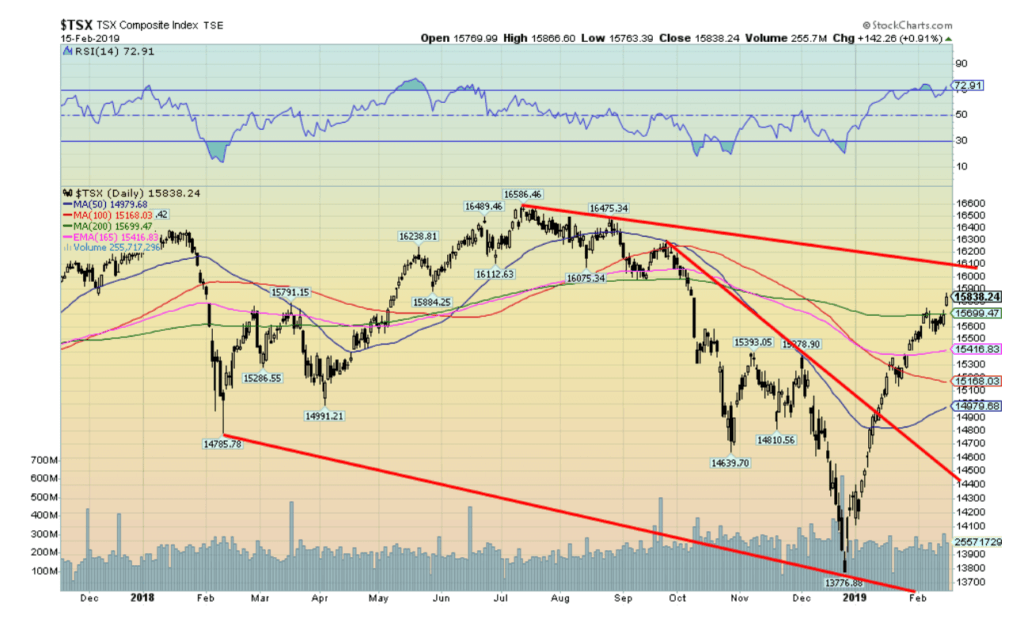
The TSX Composite burst through the 200-day MA this past week after spending a week or two treading water just under it. That is usually positive and suggests that next, the TSX could go up to test that downtrend line near 16,100. If the TSX does break through that trendline, then new highs are most likely next. Like the U.S. indices, the TSX has moved almost straight up since the late December low. And, like the U.S. indices, the TSX is starting to take on the characteristics of runaway move. Corrections since the December low have been shallow to non-existent. Obviously, a break back under 15,500 would be negative and suggest lower prices. We doubt that is going to happen right now.
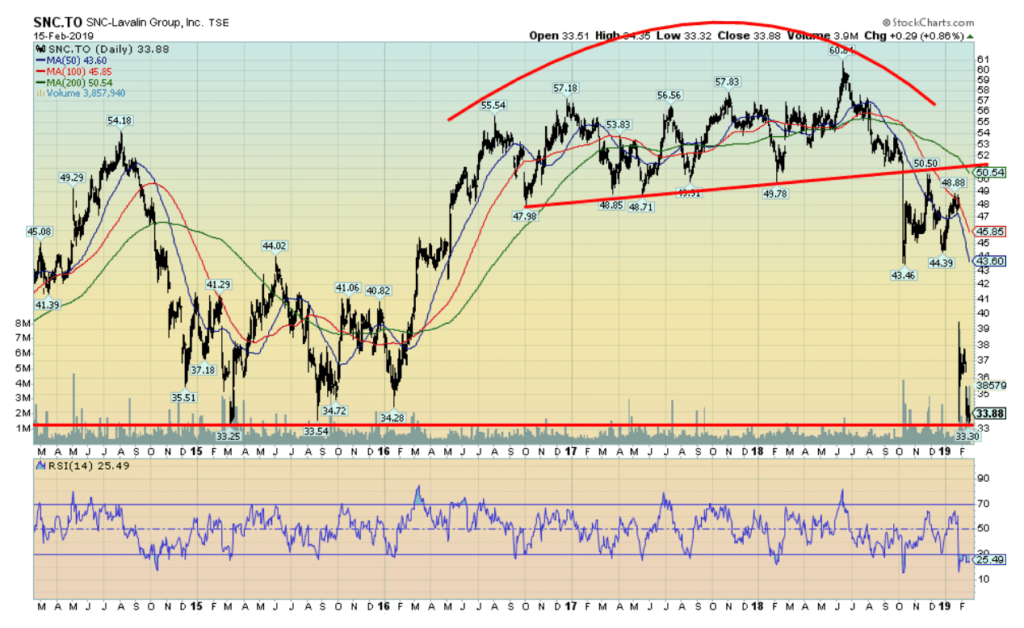
We couldn’t resist. SNC Lavalin (SNC-TSX) has been all over the news in a scandal relating to what the Prime Minister may or may not have directed the former Justice Minister to do regarding SNC. For our Canadian readers, you probably know all about this. For our U.S. and overseas readers, you may ask: who’s SNC Lavalin and why are they suddenly so important?
Well, SNC Lavalin is the largest engineering and construction company in Canada, employing 29,000 worldwide with some reports indicating upwards of 50,000 worldwide. It is, or was, one of the top engineering construction companies in the world. Of its employees, only around 9,000 are in Canada, including 3,400 in the Province of Quebec. Founded in 1911, SNC’s head office is in Montreal. It is considered the crown jewel of Quebec business, with close ties to the Quebec government and investments from the Caisse de dépôt, Quebec’s huge pension fund.
SNC is embroiled in a graft and bribery scandal because of their activities in Libya and the regime of Muammar Gaddafi. In 2015, the RCMP charged the company with corruption and fraud related to its Libyan operations. It has been under investigation by Canada’s Department of Justice. SNC has consistently lobbied to prevent the company from having to go to trial. Quite simply, a criminal conviction could destroy the company. To prevent that, SNC lobbied the PMO’s office in an attempt to have it convicted only under a remediation agreement. That would punish the company but leave it intact.
The question was the Justice Minister being pressured by the PMO’s office to halt criminal proceedings into SNC and instead offer the company a remediation deal. Apparently, the Justice Minister wouldn’t commit one way or the other. The result, in a cabinet shuffle the Justice Minister was eventually assigned to a lesser portfolio and then resigned when the questions began to fly. Hence the scandal.
There is no doubt that a criminal conviction of the company would devastate it and would upset the political applecart in Quebec, leaving many in Quebec furious. It could also come at considerable cost to the Quebec economy, not to mention a hit on the books of the Caisse de dépôt. The company could also then be vulnerable to a foreign takeover, something that would not be accepted by the Quebec government. There are questions as to how it would impact employees, pensioners and more. Jobs no doubt would be lost. But the treatment of the Justice Minister, a member of First Nations, has First Nations extremely upset as well. The opposition is trying to take advantage of the scandal, but would they really have SNC convicted knowing the fallout it could cause? Who knows? Remediation appears to be the only correct way forward so as to punish the company but not destroy it. Remediation is not uncommon in the EU and the U.S.
The chart clearly shows that SNC has broken down. Its debt has been reduced to a BBB- rating—the lowest investment grade rating. Another downgrade and they are junk bonds. The gap in the chart is huge. This could well be a company in free fall, especially if it breaks down under its next point at $33. We all remember Lehman Brothers. The fall was not pretty and in the end the decline was rapid. Is that SNC’s fate? Stay tuned.
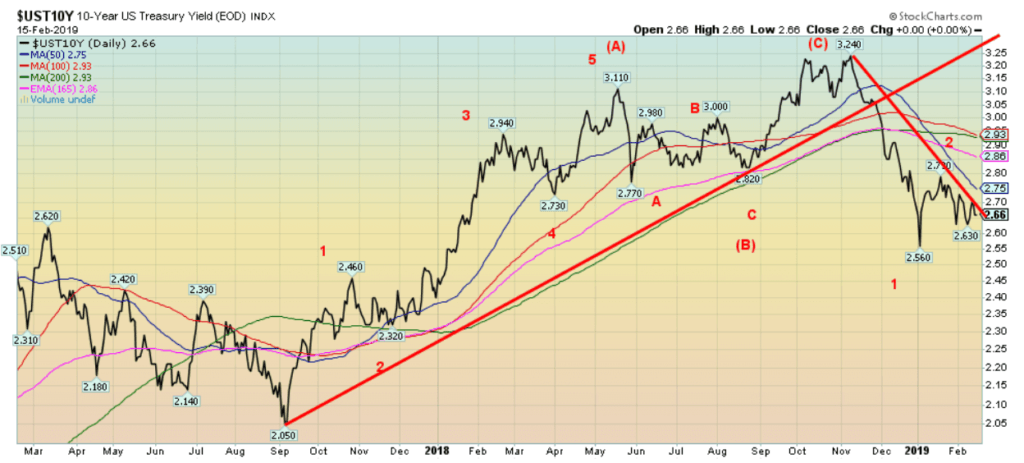
The U.S. 10-year Treasury note slipped to 2.66% this past week. Traders in the background are expecting an earnings recession to hit sometime in the next 6–12 months. The probability is placed at 25%. That, in turn, could put pressure on high-yield bonds. Although, as our chart below of HYG shows, you’d never know it. The 10-year appears to be renewing its downtrend but still needs to take out the December low of 2.56%. A potential target could be the low of about two years ago in September when it fell to 2.05%. We note that German bunds also fell as the 10-year declined to 0.10%. In October it had hit a high of 0.576%. Quite the decline as Germany appears to be falling into a recession.
Recession watch spread
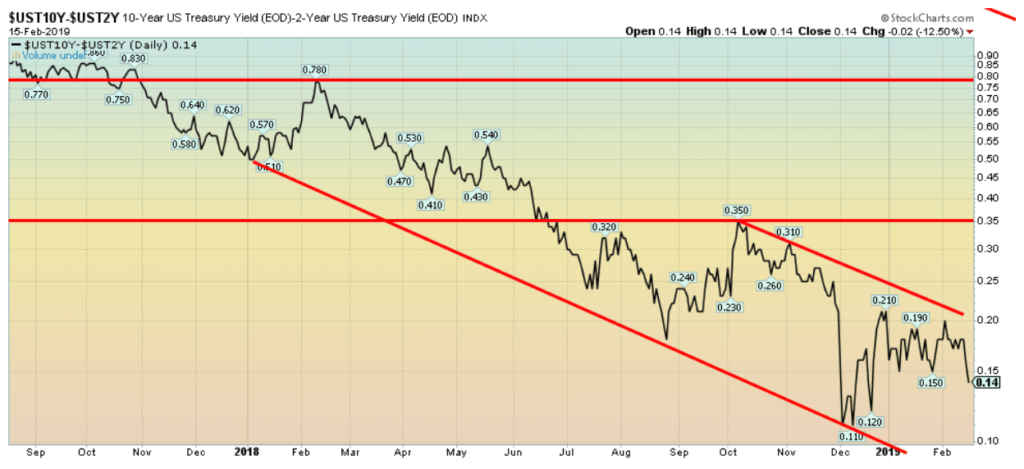
Our 2-year U.S. Treasury note / 10-year U.S. Treasury note spread (known as the 2–10 spread) slipped to 14 bp this past week. This is the lowest level since December 2018. Another downtrend could be on its way. However, it has not gone negative yet. And even if it did, it usually requires at least 6 months at negative levels to suggest an impending recession. Still, the downward trend remains intact.
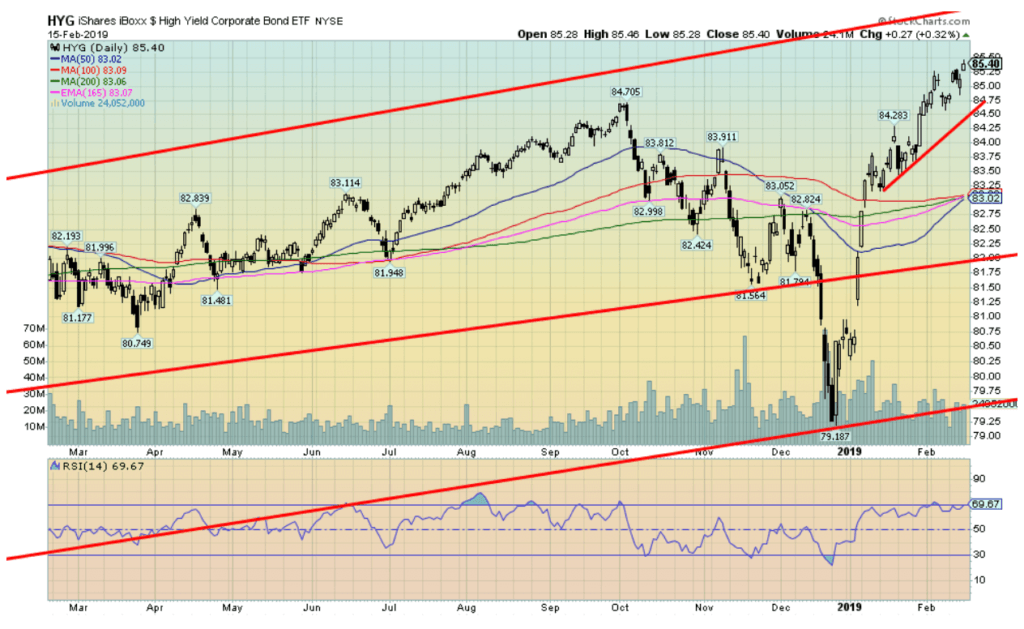
We have to keep an eye on junk bonds as represented here by the iShares iBoxx $ High Yield corporate bond ETF (HYG). It leaped to new highs again this past week. We have mused as to whether this is leading the stock market upward. Could be. Clearly, taking on the risk of junk bonds does not appear to be an issue.
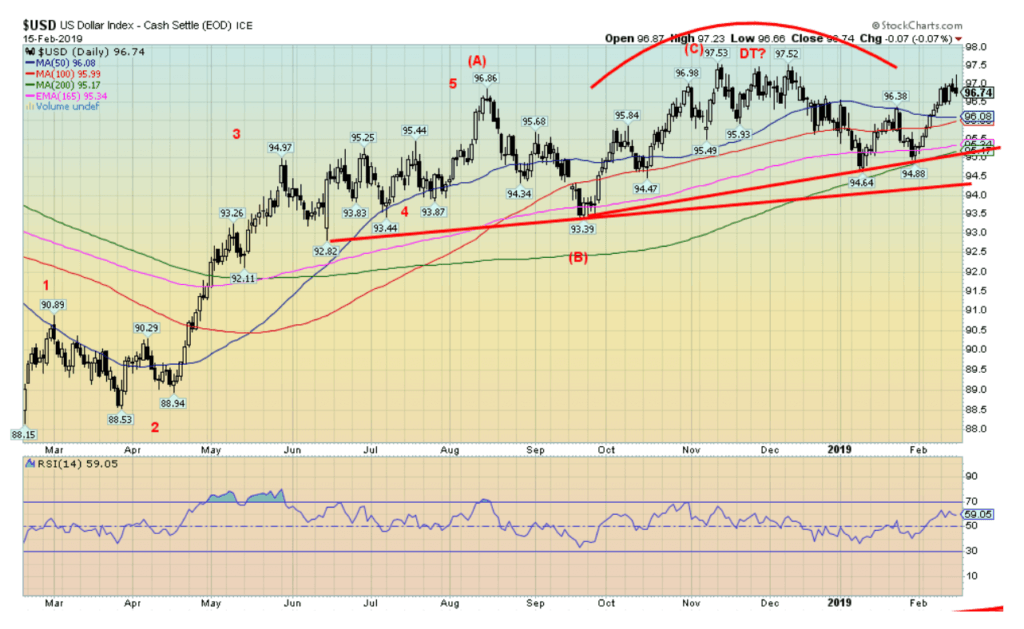
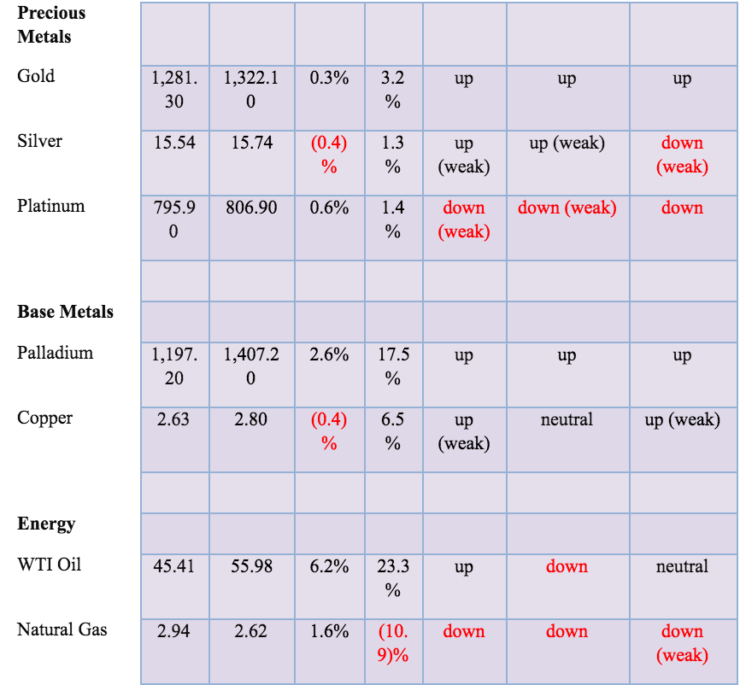
The US$ Index continues to trace out what appears as a huge topping pattern. On Friday, the index made a new high for this move at 96.87, then reversed and closed down small on the day. Could that be it? We would have preferred that the US$ Index did not hit 96.87 as that was 1 bp above the August 2018 high. We thought that the index could be tracing out a huge head and shoulders top pattern. It still could be, but we would have preferred it didn’t take out that August 2018 high even if it was only by 1 bp.
Our breakdown zone is at 95 and once we break that, the target for the US$ Index could be down to 90.30. We can see even lower potential targets, but first, we have to break 95. And that is not a given. New highs now above 96.87 could suggest an assault on the double top highs near 97.53. One thing in favor of a potential top for the US$ Index is the sentiment indicator is extremely high and, conversely, the sentiment indicator for the euro is extremely low. But, as they say, we have to await signs that a reversal is underway. Friday’s action was a small indication, but we need downside to confirm.
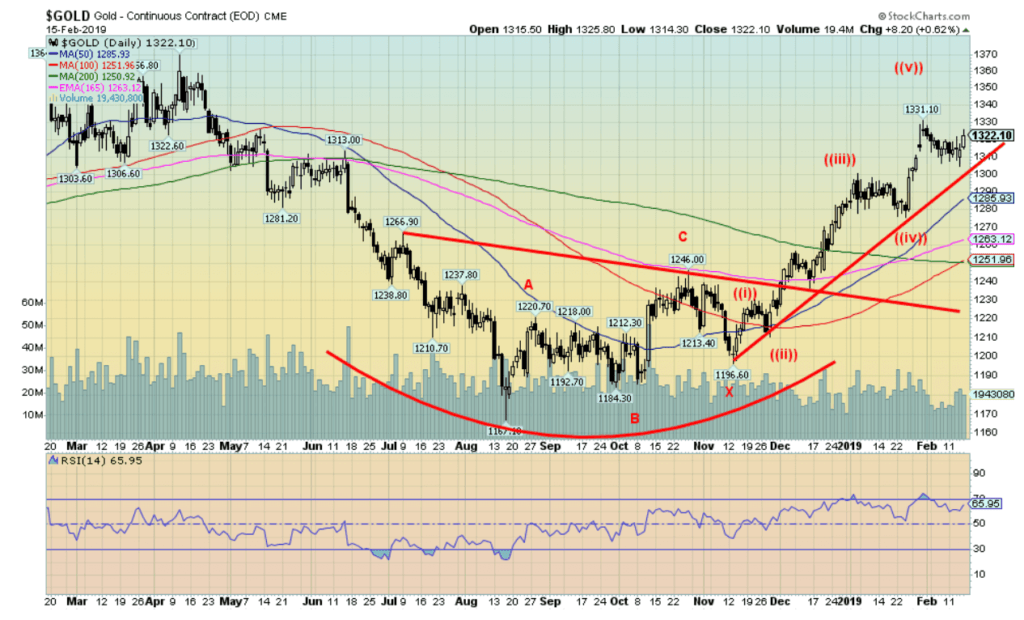
Gold prices recovered this week from what could have been a down week and eked out a gain of 0.3%. The recent pullback now appears to be over and we expect higher gold prices going forward. Once we clear $1,330, we should head for our next target zone of $1,350 to $1,370. We know that major resistance exists up at that level as that has been the highest for the past three years.
Once we hit that zone our expectations would be that gold does pull back. The pullback could last upwards of four months and retrace upwards of 50% of the recent move. That would take gold back to the $1,260 to $1,280 zone. Once that is out of the way, gold should rise again and take out the major resistance at $1,370 and eventually $1,400. We are on record as saying gold could eventually rise to $1,600 to $1,700. We also believe that the low seen in August at $1,167 was an important 31-month low and the next one would not be due until around 2020–2021. Support at $1,300 held nicely.
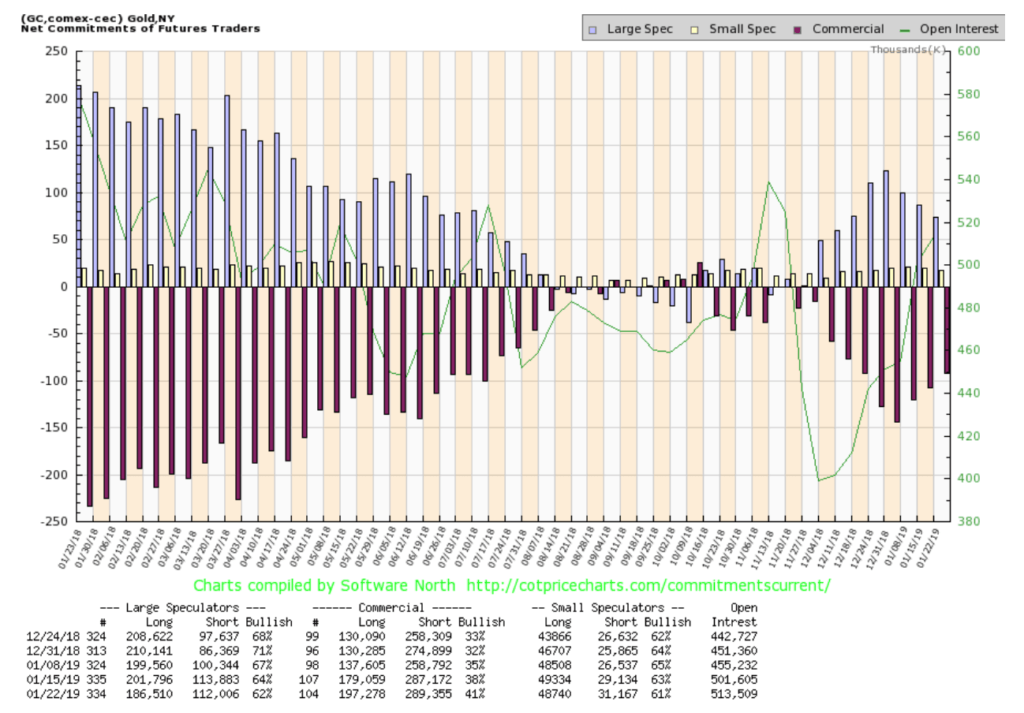
The gold commercial COT was encouraging this week as it improved from 38% to 41%. This suggests to us that gold prices should move higher. Long open interest jumped roughly 18,000 contracts while short open interest also rose, but only about 2,000 contracts. The large speculators’ COT (managed futures, hedge funds, etc.) saw its COT fall to 62% from 64%. This is the third week in a row the commercial COT has improved. An encouraging sign. Our next move is to watch when the commercial COT turns down again, suggesting the potential for a top in gold prices.
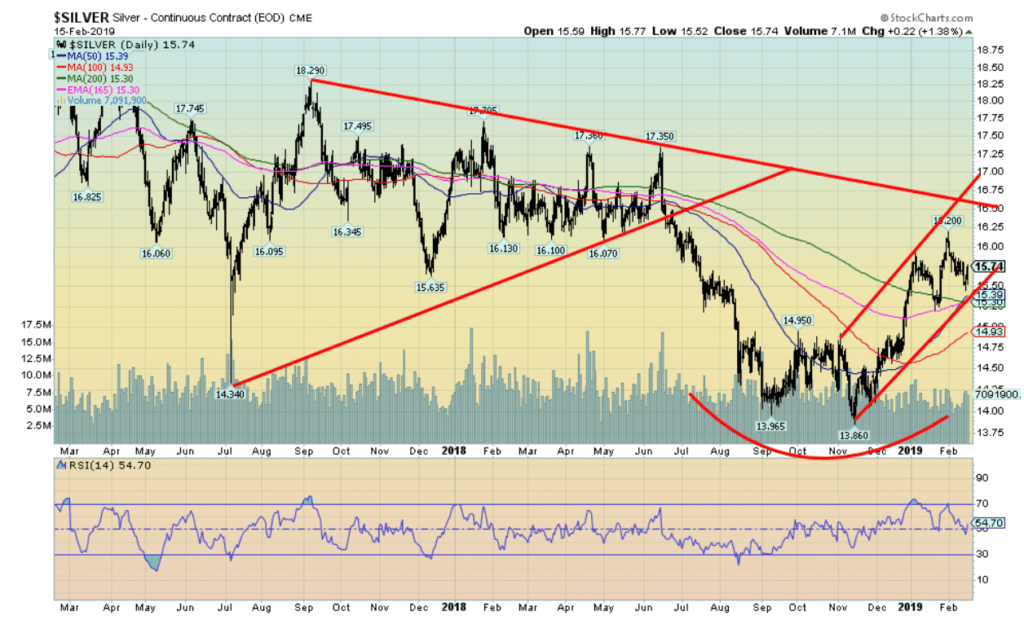
Silver may have completed its latest pullback within the context of a larger advance. Silver hit a low of $15.45 this past week and appeared poised for a down week until Friday cut the loss. Still, silver closed off 0.4% on the week. Silver continues to hold what appears as a solid uptrend channel. Next up, silver should challenge the recent $16.20 high and move higher. There is trendline resistance at $16.50, a level where we could see silver pulling back once again. Higher prices are ahead for silver and, even after what could be a somewhat steeper correction coming up, we expect much higher prices later in the year.
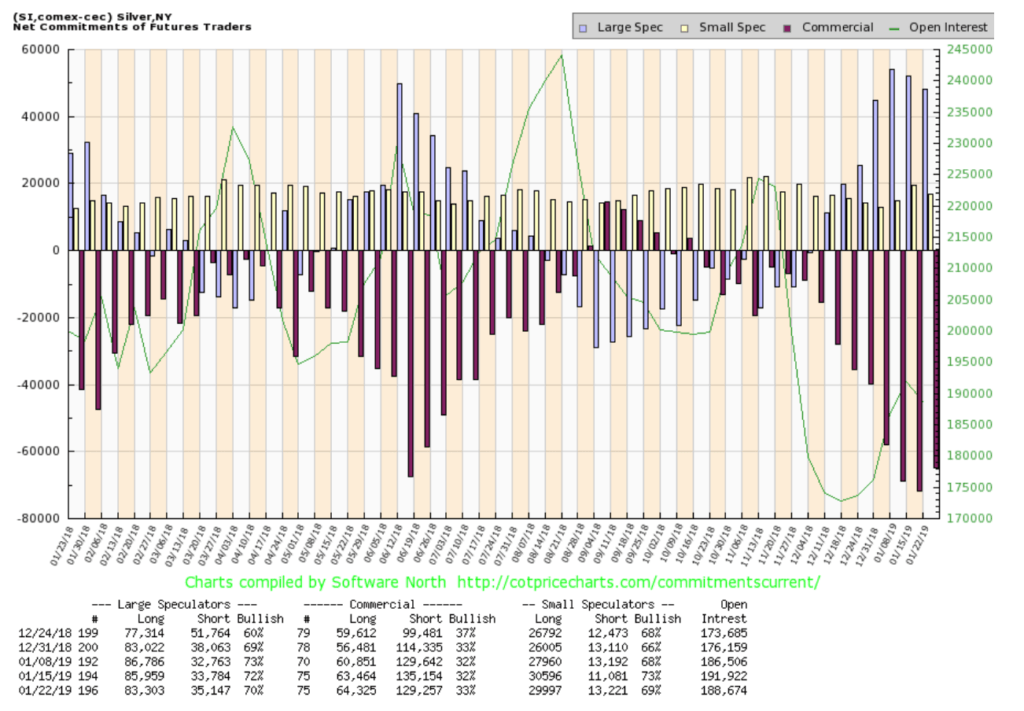
The silver commercial COT was encouraging as it improved this week to 33% from 32% the previous week. Long open interest rose roughly 1,000 contracts while short open interest fell roughly 6,000 contracts. This supports our thoughts that silver prices should rise over the next few weeks. The large speculators’ COT slipped to 70% from 72%.
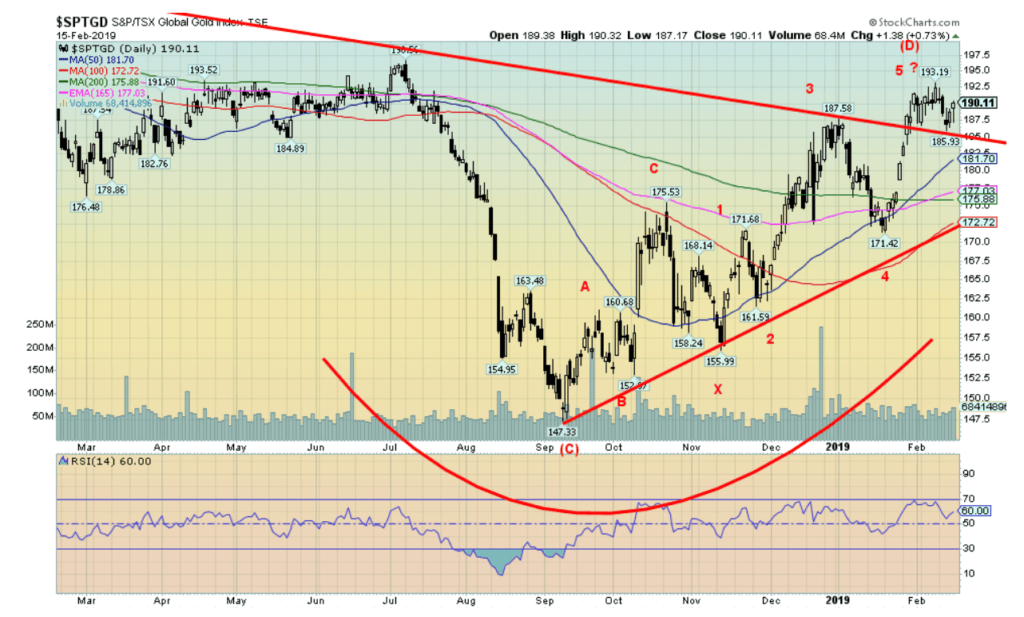
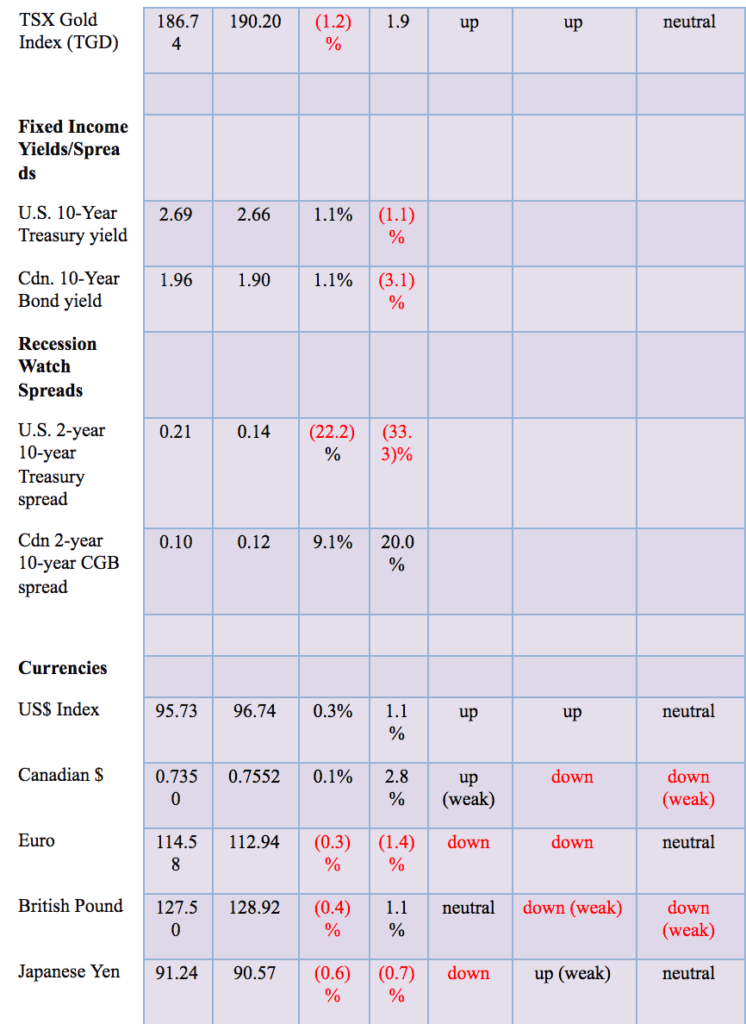
Gold stocks jumped on Friday, along with the rise in gold and silver prices. Friday’s gain choked off what could have been a deep-down week. Still, the TSX Gold Index (TGD) ended down 1.2% on the week while the Gold Bugs Index (HUI) was off 0.6%. However, despite the down, there were positives. The TGD tested its breakout level at 186 and it held. This is a positive development and could set up the TGD for further gains.
Once the TGD makes new highs above 193.19, the target could easily be up to 200 and new 52-week highs. We like the rise of the TGD so far. It rises, suffers a pullback, and then rises again, all the while making new highs and higher lows along the way. That indicates to us a good uptrend that should carry the TGD to much higher levels later in the year. Once the next high is out of the way, the TGD could embark on another corrective move that might play out over a period of roughly four months.
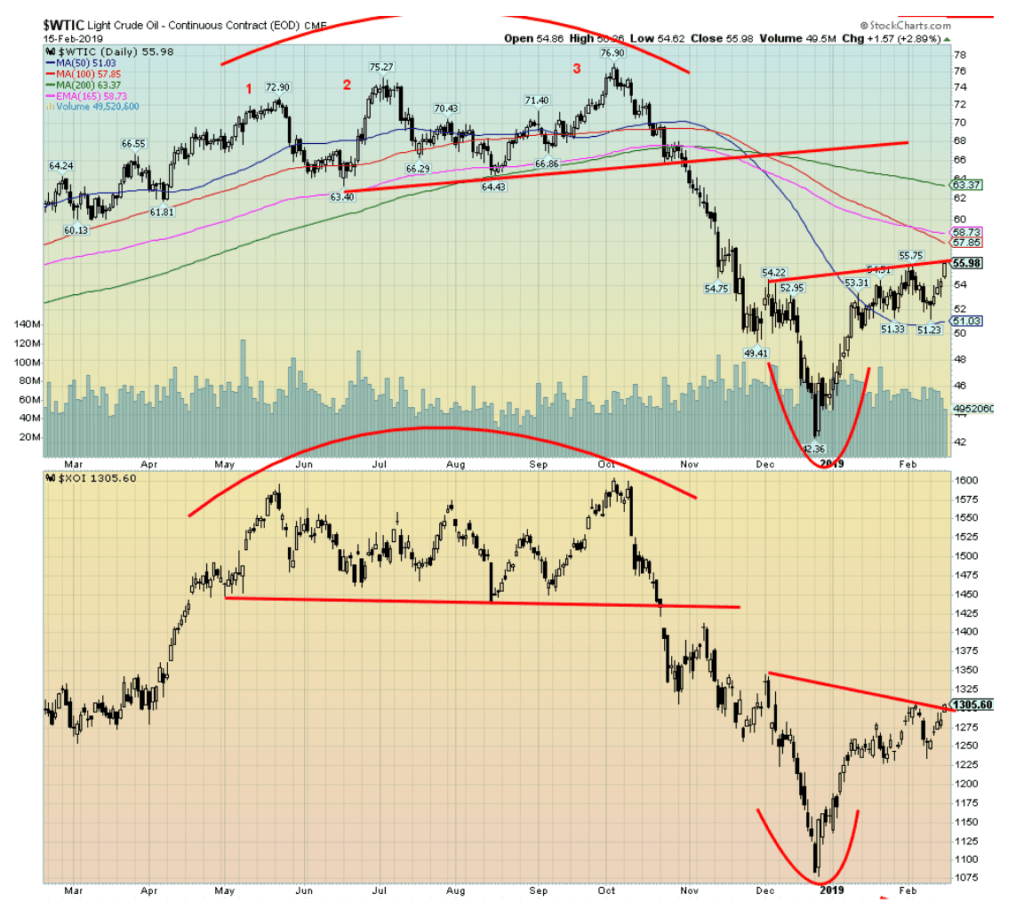
WTI oil jumped to its highest level this year as the Saudis cut output. WTI oil is now up 23.3% on the year, a healthy gain. WTI oil appears to be making a potential head and shoulders (although a rather awkward one) with potential to rise to near $70 once WTI clears $56. Similarly, energy stocks could also break out (they appeared to at least poke through on Friday) as the Philadelphia Oil & Gas Index (XOI) could rise to 1,570 once clearly through 1,305. The TSX Energy Index (TEN) is also poised to rise since it has cleared its breakout point at 152.
Potential targets are 180–185. Besides the Saudis cutting output. disruptions continue with Venezuelan oil due to the strangling U.S. sanctions. We could also cite U.S. sanctions on Iran as it has cut what they normally sell to the global market. So, the Saudis and sanctions against Venezuela and Iran are the prime reasons for rising oil prices. An initial target of $70 appears quite reasonable under the circumstances. That could also send oil prices to new highs as well.
Chart of the week
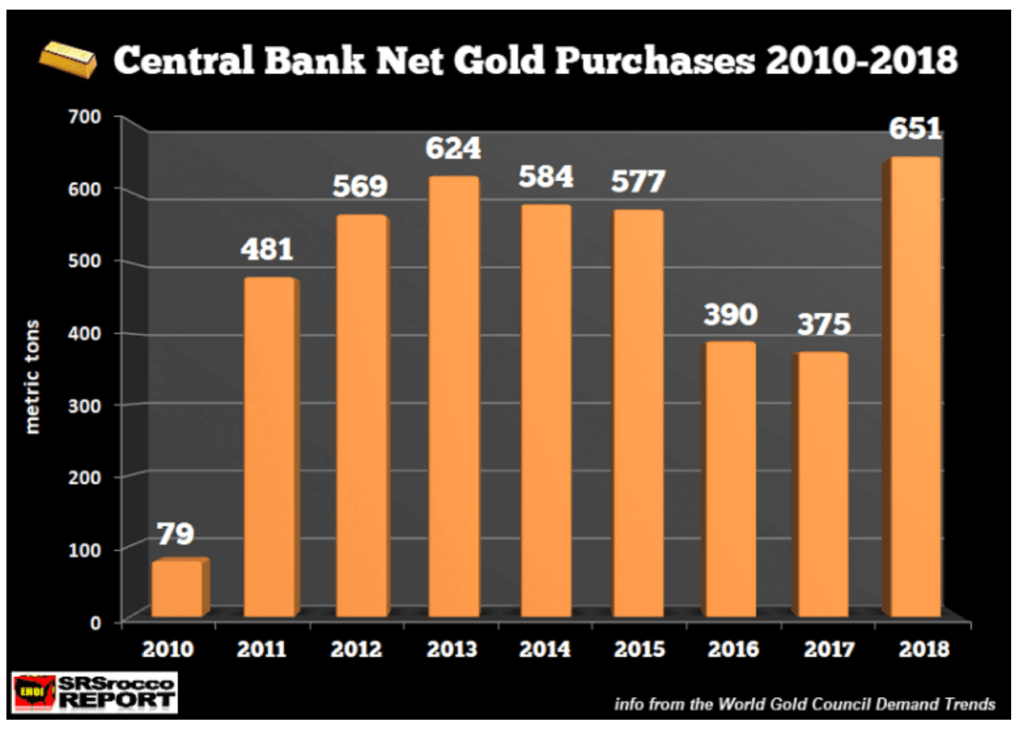
Central banks continue to be major buyers of gold. In 2018, central banks added more gold than at any time in the past decade. Russia led the way, followed by Turkey. But in 2018 there were new buyers, including Poland and Hungary, buying gold—the first Eastern European nations to buy gold since the turn of the century. 2018’s purchases reversed a 4-year decline. The unknown in this is how much might have been purchased by the People’s Bank of China (PBOC). They typically don’t tell, and then, all of sudden will announce their new holdings.
In terms of global reserves, Russia and China have been major purchasers over the past several years. They now rank 6th and 7th in gold reserve holdings—behind the U.S., Germany, the IMF, Italy, and France. It is their stated desire to build up their gold reserves to back their currency (ruble and yuan) and become less dependent on the U.S. dollar as the world’s reserve currency.
So, for what other reasons would central banks be buying gold? They are many and varied: geopolitical concerns, diversification of reserves, and, less dependency on the U.S. dollar and holding U.S. Treasuries. Even major global banks are getting into gold buying because of the Basel III reforms that gold could be accepted on par with cash and AAA government bonds. We are also reminded that there is ongoing depletion of gold deposits, huge duration of time between discovery and production, and fewer large discoveries. There is simply just not that much gold around to meet the potential demand (thanks, Brandon, for the tip on this).
(Featured image by katjen via Shutterstock)
—
DISCLAIMER: David Chapman is not a registered advisory service and is not an exempt market dealer (EMD). We do not and cannot give individualized market advice. The information in this article is intended only for informational and educational purposes. It should not be considered a solicitation of an offer or sale of any security. The reader assumes all risk when trading in securities and David Chapman advises consulting a licensed professional financial advisor before proceeding with any trade or idea presented in this article. We share our ideas and opinions for informational and educational purposes only and expect the reader to perform due diligence before considering a position in any security. That includes consulting with your own licensed professional financial advisor.


Bitcoin Stalls Near $60K as Strategy Moves, ETFs Outflow, and EU MiCA Rules Take Effect
Bitcoin hovers near $60,000 with ETF outflows, while Strategy boosts reserves, sells BTC, and raises dividends to reassure investors. Ethereum...


Cannabis Dominates Global Drug Use: Trends, Risks, and Shifting Markets
Cannabis remains the world’s most widely used illicit drug, with 256 million users in 2024, surpassing all others combined. Growth...


Italy Approves First Hydrogen-Powered Train for National Rail Network
ANSFISA has approved Italy’s first hydrogen-powered train, the Alstom HMU214, for use on the Brescia–Iseo–Edolo line. Capable of 140 km/h,...


Cotton Market Weakness Persists Despite Brief Rebound
Cotton prices fell to new lows last week before a modest rebound. USDA data shows crop conditions remain worse than...


Eli Lilly Hits $1 Trillion Valuation Amid Strong Bullish Momentum
Eli Lilly stock hit a record high, surpassing $1 trillion market value after strong product demand. Shares surged over 7%,...
 |
|
 |  |
 |
|
-

 Markets1 week ago
Cocoa Market Faces Mixed Trends Amid Rising Supply and Weak Demand
-

 Africa6 days ago
Bank of Africa Expands Sino-African Trade Partnerships in Beijing
-

 Biotech2 weeks ago
Bavarian Biotech Sector Expands with Record Funding and Startup Growth in 2025
-

 Africa2 days ago
BOAD Approves Major Funding Boost to Drive West African Development