Markets
Why gold prices largely depend on global geopolitics
India is growing and the sleeping dragon of China has awoken, their hunger for gold will drive gold prices higher.

Two of the most important factors that influence the gold prices are debt and geopolitics. Will the governments take action and introduce debt reduction programs?
Background
This was a target we set on Monday, June 19, 2006, however, it is taking longer to get there than we anticipated back then.
It was 10 years ago but the reasons for this gold price forecast were roughly as follows:
– No new large discoveries of gold deposits dampening supply
– Lack of previous investment for gold exploration
– It takes up to 10 years to bring a new mine to production
-Falling gold production worldwide adding to its scarcity
– Gold EFTs takes gold off the market thus reducing supply
– In the last Bull Run 70s to 80s gold prices increased 20 fold
– Metrics: DJIA vs. Gold, about 19ozs buys the Dow Jones; it has been 1:1 in the past and could be again in the future. Assuming the Dow Jones remains above 10,000 then the gold price could hit $10,000
– Gold at its previous high of $850 adjusted for inflation puts the gold price at $2000 plus
– Geopolitical uncertainty, a nuclear Iran creates world tension which pushes up the price of gold
– A Dictatorial South America imposing restrictions such as increased taxation and nationalization will deter investment and reduce gold production
– India is growing and the sleeping dragon of China has awoken, their hunger for gold will drive gold prices higher
– Internet: information travels around the world in a nanosecond, reactions to news, true or false, will add to the volatility of the gold price
– Web trading: increasing every day, resulting in the trends being more exaggerated than ever before
– The mania that I traded in during the last Bull market (the 1980’s) will be nothing compared to the coming Gold price explosion and maniacal actions of traders and everyday people in the precious metals sector.
Fast forward to today
There are a myriad of factors that deserve consideration when one is involved in predictive analysis, however, two of the most important factors to add to the above rational are debt and the increasing geopolitical unrest.
The US national debt is approaching 20 trillion dollars which is mind boggling in itself and last week we had the Federal Reserve delivering the first of a series of rate hikes; so pretty soon we will see the cost of finance eating its way through the new administration’s budget. The US now has a Debt to GDP ratio of over 100 and joins the list of other countries that are in poor shape as seen below:
Japan – 229.20 – Dec/15
Greece – 176.90 – Dec/15
Lebanon – 139.00 – Dec/15
Italy – 132.70 – Dec/15
US – 104.17 – Dec/15
Canada – 91.50 – Dec/15
UK – 89.20 – Dec/15
To date, we have seen little to no effort on behalf of these governments to take action, bite the bullet and introduce debt reduction programs. Why would they, it would make them unpopular and they would risk losing their lucrative living. So the can continues to be kicked down the road. How will they service such large debts – the same as before, they will run the printing presses night and day and stand by and watch the debt suffocate their economies. The buying power of paper money will drop like a stone and refuge will be sort in other areas, one of which will be the precious metals sector causing extraordinary price increases.
Taking a quick look at the geopolitical unrest element of this equation we can see tension building in many parts of the world. The normally sedate European scene will face the reality of Brexit as Britain is triggering Article 50 next week which gives the European Union notice of their departure. This will not be an amicable divorce as Britain doing well out of this move will only serve to encourage others to take the same route. The Freedom Party in The Netherlands picked up 20 seats to take second place in the recent Dutch elections and in France Marine Le Pen is quoted at 3:1 to win the presidential election. From this we can glean that all is not well in the EU and the possibility of its implosion is growing, should it happen then there will be chaos in the markets.
We also have possible flash points with North Korea’s missile testing programme, China with its on-going claims in the South China Seas, border controls being tightened by many countries due to immigration issues, a surge in nationalism as each country scrambles for a better deal, the spectre of capital controls and so the list goes on. This slide towards instability generates fear which in turn results in an increased demand for gold as it is considered to be a safe haven for many investors.
Gold chart
The chart below depicts the commencement of the second leg of this bull market in the precious metals sector. Gold has formed two higher lows which is a positive sign.
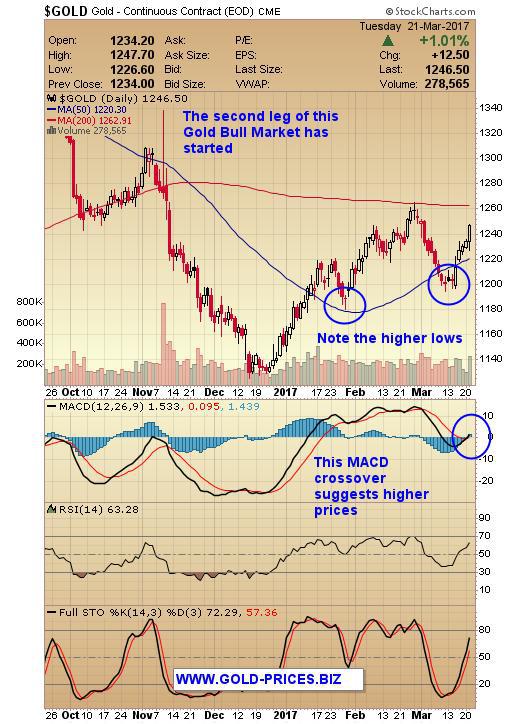
© Bob Kirtley
Also, note that the 50dma is heading north and could crossover the 200dma, this event is commonly known as a golden cross and deemed to be positive for gold prices.
Conclusion
The fundamental factors have hardly changed; money printing will accelerate as this is the only tool that the central bankers have at their disposal.
India, the Islamic world, China, et al, will continue to consume most of the annual production of the physical metal, adding to an already tight physical market.
This first bull phase of this market is over and so is its correction, the second phase has started and will challenge and beat the previous all-time high.
Finally, do the work and read as widely as you possibly can; it’s your hard earned cash that is being put at risk.
We are continuing with our strategy of acquiring good quality gold and silver mining companies by buying the market dips, based on our expectation that the mining sector will outperform the physical metals by a factor of 3 or 4.
—
DISCLAIMER: This article expresses my own ideas and opinions. Any information I have shared are from sources that I believe to be reliable and accurate. I did not receive any financial compensation in writing this post, nor do I own any shares in any company I’ve mentioned. I encourage any reader to do their own diligent research first before making any investment decisions.


Mollie Expands Across EEA With €350M Investment to Strengthen European Payments Network
Fintech company Mollie has expanded into Croatia and Iceland, achieving full coverage of the European Economic Area. It has committed...


Trulieve NYSE Listing Signals New Era for Global Cannabis Industry
Trulieve’s NYSE listing marks a milestone for the cannabis industry, giving a major US producer access to institutional capital after...


Moroccan Bond Market Shows Mixed Signals as Primary Eases and Secondary Pressures Persist
The bond market shows a mixed trend, with cautious easing in the primary market as the Treasury raises limited funds...


Markets Diverge as Oil Falls, Rates Hold, and Inflation Persists
Markets reacted to a U.S.–Iran MOU and unchanged Fed rates, with oil plunging while energy stocks showed divergence. Equities fluctuated...


Cocoa Market Faces Mixed Trends Amid Rising Supply and Weak Demand
New York cocoa prices edged lower Thursday while London closed higher, with mixed but improving daily trends. West Africa’s main...
 |
|
 |  |
 |
|
-

 Business1 week ago
SpaceX IPO Sparks Déjà Vu as Market Risks Loom and Gold Bulls Stay Hopeful
-

 Crowdfunding6 days ago
Wyrmgold Launches Crowdfunding Campaign for Believe in me! (please)
-

 Biotech2 weeks ago
The German Biotech Industry Faces Funding Crunch Despite Market Stability
-
 Crypto1 day ago
XRP Under Pressure Amid Macro Forces, Fed Policy, and Regulatory Shifts
You must be logged in to post a comment Login