Featured
Gold & Silver in One Word: BUY
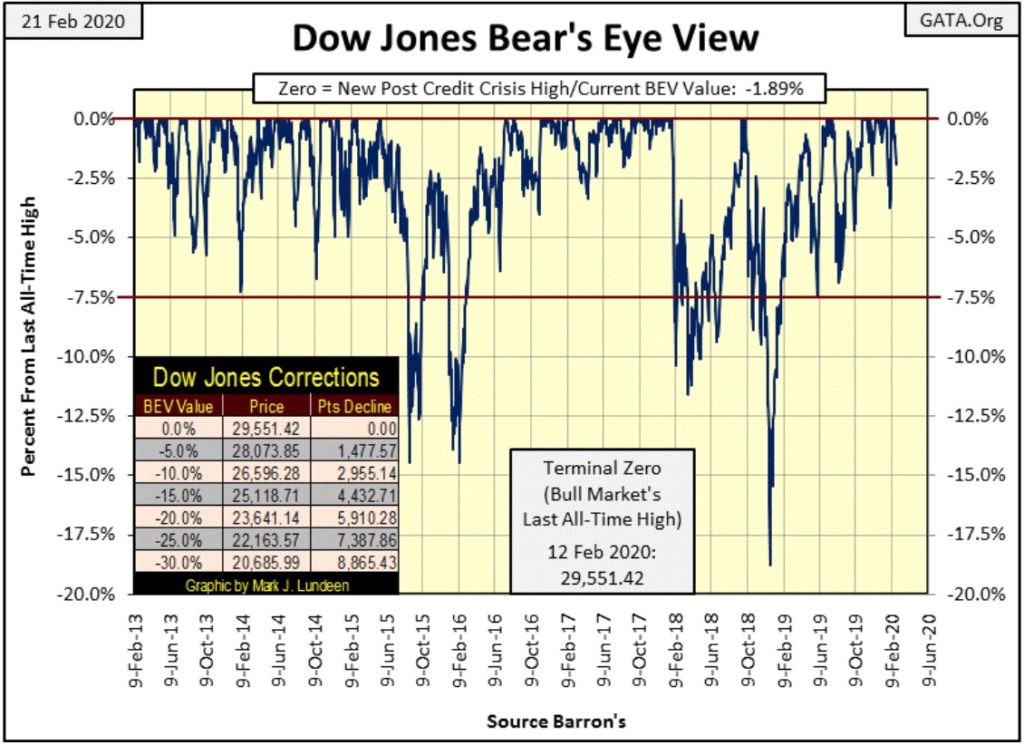
Dow Jones closed the week down at 1.98% from its last all-time high. But as long as the Dow Jones doesn’t see a double digit BEV value (10% or lower), there is good reason to remain bullish on the stock market. Should the coronavirus upset the current worldview now operating at the NYSE and NASDAQ exchanges, the stock market could deflate quickly into deep double-digit percentage declines.
The week closed with the Dow Jones down almost 2% from its last all-time high. Realize the bulls are only happy when the object of their affection is making new all-time highs, something the Dow Jones failed to do this week.
So with the Dow Jones down 1.89% from its last all-time high at the week’s close, people are a bit disappointed. But I’m remaining bullish for as long as the Dow Jones remains above its red BEV -7.5% line in its Bear’s Eye View chart below. Actually, for as long as the Dow Jones doesn’t see a double-digit BEV value (-10% or lower), there is good reason to remain bullish on the stock market.
But this is a race I don’t have a horse in, as I believe now in 2020 the potential for profits in the precious metals far exceeds what is possible in the stock market. I still follow the Dow Jones because it’s important for any market commentator to do so.
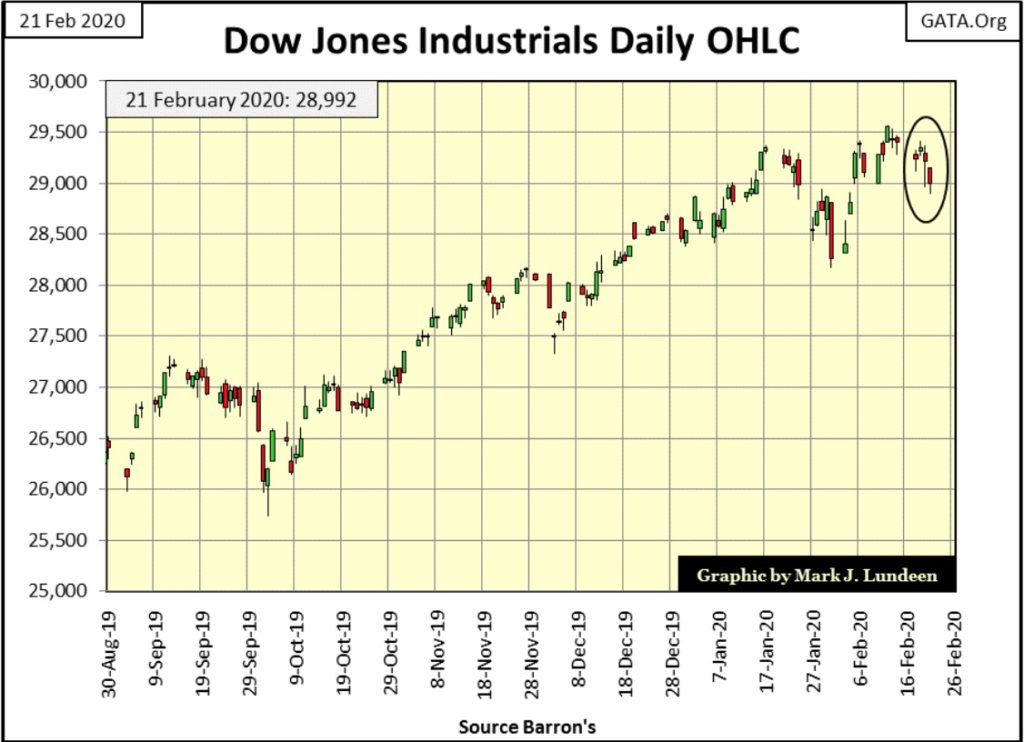
Next is the Dow Jones in daily bars; it’s looking good. I admit it could look better, but so far the advancing Dow Jones hasn’t contracted a case of the coronavirus. Should (when?) that happen it will result in a drop in the Dow Jones that will make head-line news in the non-financial media.
At these lofty levels, the stock market is priced for perfection, as if our world is one where nothing bad ever happens, a “market reality” where all surprises are pleasant. But we don’t live in a perfect world. We actually live in a world where dark and evil things happen all the time, and that possibility is currently not priced into stock market valuations.
Should the coronavirus upset the current worldview now operating at the NYSE and NASDAQ exchanges, the stock market could deflate quickly into deep double-digit percentage declines in an amazingly short time.
I imagine the exact opposite would happen to the price of gold and silver should a global pandemic of coronavirus become a prime factor in the stock market.
I admit its more than a bit mercenary factoring into one’s personal investment decisions the potential for deaths of tens-of-millions. But the markets are a vast ocean, as we are but tiny boats that must traverse it. Should the Dow Jones begin a series of 2% days; I’d Get The Hell Out of Dodge City Fast.
Shifting one’s investment capital into precious metals and mining shares seems a sensible thing, a good strategy to protect yourself. And researching the precious metals mining sector for companies one might invest in is a good thing to do before you actually make the trade.
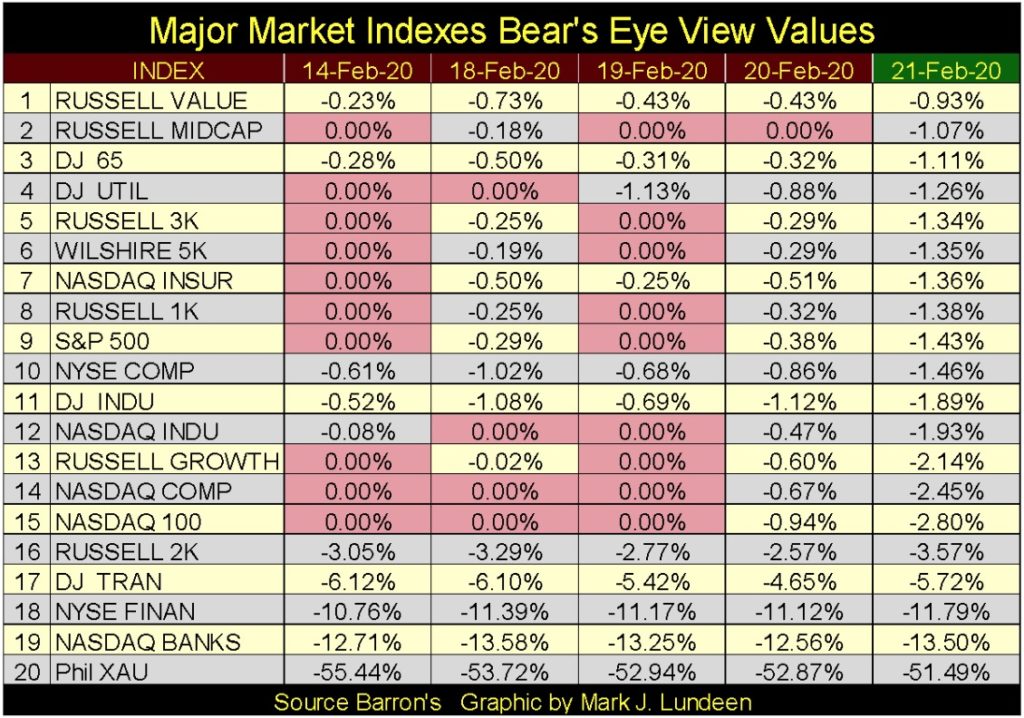
Looking at the BEV values for the major market indexes I follow below, we see “liquidity” flowing from the market as the week progressed. But I note the indexes down to #16 remain in scoring position, within 5% of their last all-time high. From these levels, we could see many new all-time highs next week and in the weeks to follow.
Looking at these charts above and the table below, the bull market advance that began in March 2009 remains intact. Whether or not the coronavirus pandemic now in progress in Asia will impact us in North America is yet to be factored into the market. Someday soon it may, but at week’s close, it has yet to be.
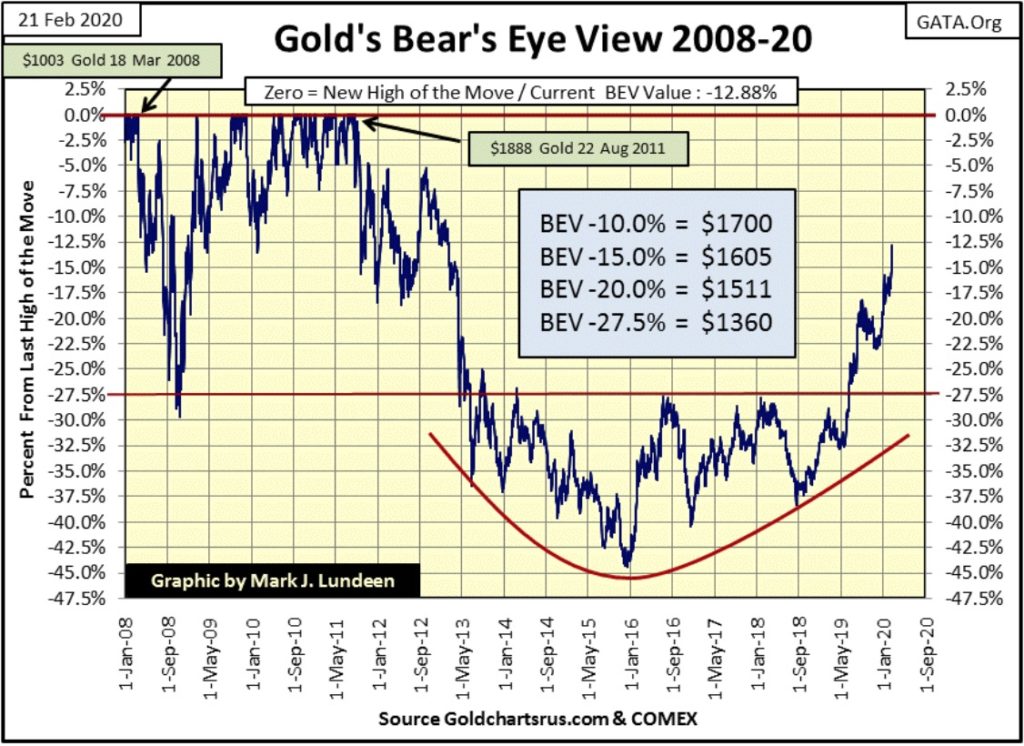
Below is gold’s BEV chart, and gold is advancing boldly towards its last all-time high of August 2011. The gold and silver markets are getting exciting. A year ago gold’s BEV -27.5% line ($1360) was an impenetrable ceiling to the gold market since May 2013. At week’s close gold has only a short sprint to get into single digits BEV values, from where it could see a new all-time high in a very short time.
Week after week the technical situation for the gold market only improves.
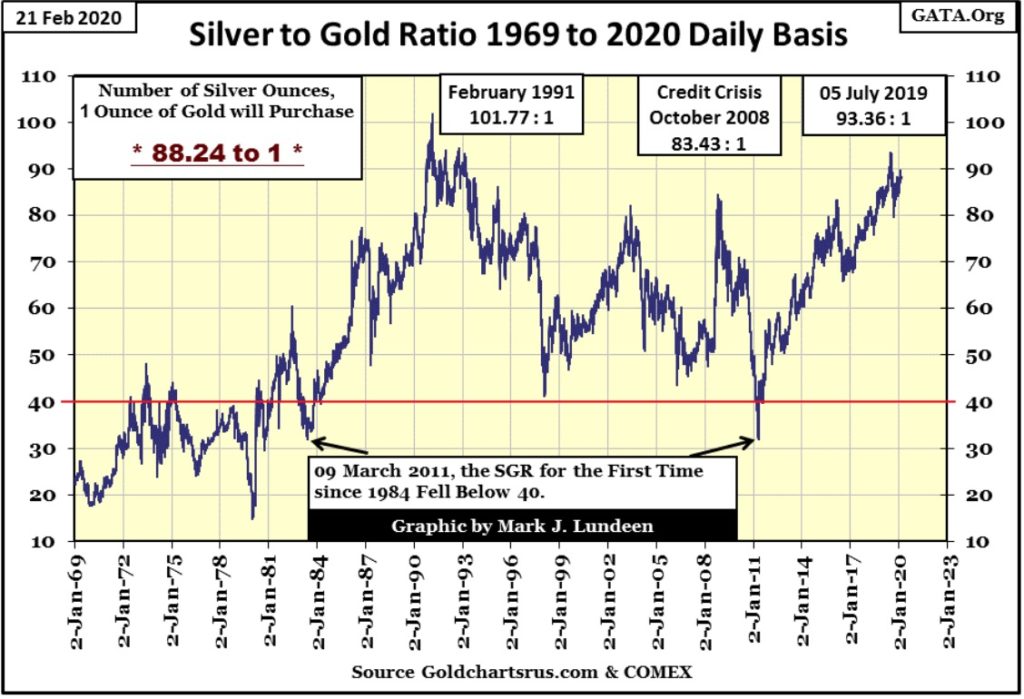
The Silver to Gold Ratio is currently at eight-eight ounces of silver to one ounce of gold, which given the recent increases in the price of gold and silver is ridiculous. So, let’s take a historical look at the price of gold and silver and see if there are any nuggets of insight to be found there.
But first a couple of quotes from Presidents Jackson from the 19th century and Johnson from the 20th:
“The Constitution of the United States unquestionably intended to secure to the people a circulating medium of gold and silver. Experience has proved the MISCHIEFS and DANGERS of a PAPER CURRENCY, and it rests with you to determine whether the proper remedy shall be applied.”
-President Andrew Jackson, Farewell Address, March 4, 1837
“IT IS APPARENT FROM THE WHOLE CONTEXT OF THE CONSTITUTION, AS WELL AS THE HISTORY OF THE TIMES WHICH GAVE BIRTH TO IT, THAT IT WAS THE PURPOSE OF THE CONVENTION TO ESTABLISH A CURRENCY CONSISTING OF THE PRECIOUS METALS.”
President Jackson’s annual message, December 5, 1836
“Now, I will sign this bill to make the first change in our coinage system since the 18th century. And to those Members of Congress, who are here on this very historic occasion, I want to assure you that in making this change from the 18th century we have no idea of returning to it. — If anybody has any idea of hoarding our silver coins, let me say this. * Treasury has a lot of silver on hand, and it can be, and it will be used to keep the price of silver in line with its value in our present silver coin. * There will be no profit in holding them out of circulation for the value of their silver content.”
“Now, all of you know these changes are necessary for a very simple reason-silver is a scarce material. Our uses of silver are growing as our population and our economy grows. * The hard fact is that silver consumption is now more than double new silver production each year. * So, in the face of this worldwide shortage of silver, and our rapidly growing need for coins, the only really prudent course was to reduce our dependence upon silver for making our coins.”
– President Lyndon Baines Johnson remarks made on signing the Coinage Act on July 23, 1965
Note #1: The above link went to go to the Johnson Presidential Library; but now goes nowhere.
Note #2: In July 1965 the price of silver was $1.30. The Federal Reserve System, for which President Johnson spoke, failed to keep the price of silver at 1965 prices. The day is coming soon when they will also fail to keep silver below its last all-time highs of January 1980.
Since the US Constitution was ratified by the former American colonies in 1789, war has been waged on stable money, a monetary system whose expansion was limited by the availability of precious metals.
President Jackson won his battle in the 1830s, and for a hundred years, America had a dollar defined in terms of precious metals. But after President Roosevelt and Johnson, and all the administrations in between (it’s ignorant placing sole blame on President Nixon for terminating the gold standard), the dollar’s definition stopped being thirty-five to an ounce of gold, and became a unit of whimsy; something the Federal Reserve System says it is.
Congressman Ron Paul of Texas once asked Chairman Greenspan what the definition of a dollar was. Greenspan was stumped when attempting to answer the question.
Exactly what is a $35 an ounce gold peg? It means the only concern the US Treasury has when it comes to its monetary policy is; it never issues more than $35 paper dollars for each ounce of gold it has in its monetary reserves. Such a monetary policy doesn’t require thousands of economists managing it, or bankers to “implement monetary policy” to maintain their dollar within their “designed parameters”, such as desired rates of interest and inflation.
What the dollar under a gold peg can purchase, or at what price those financial exchanges occur at ARE NOT THE GOVERNMENT’S BUSINESS. No; thirty-five paper dollars for each ounce of gold in their reserves is the government’s sole mandate under a $35 gold peg.
And what about the Federal Reserve? Their upper management, as well as the academics that supported it deserves the fate of any counterfeiter of US Currency: hard time in the stony-lonesome.
To keep the US Treasury and the banking system honest; gold and silver coinage are allowed to circulate, giving the economy the choice of holding precious metal coins, or Treasury notes (not Federal Reserve notes); paper money that is literally AS GOOD AS GOLD, as anyone can exchange one for the other at any bank.
What we have today is called a “flexible currency”, a currency that on its inflationary expansion can “stimulate the economy” during times of recession, or bail out a ruined banking system after its management had made obscene profits in a criminal enterprise. Such a currency as ours makes for bad money, one that will eventually be rejected by even the government that issues it.
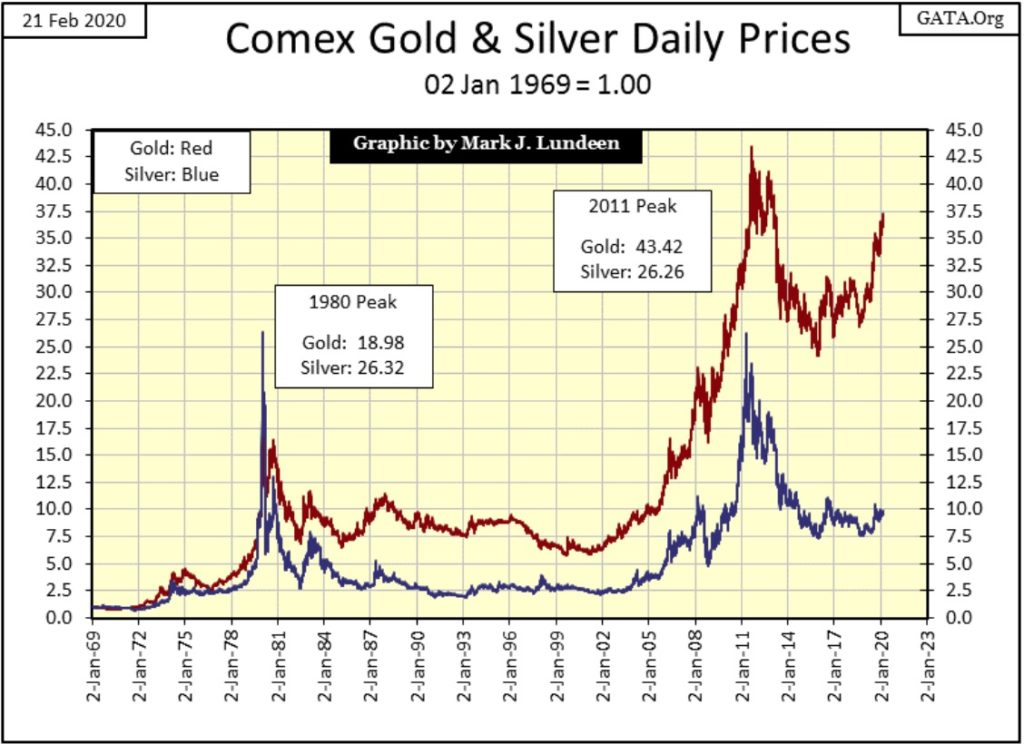
Well, I got that out of my system, so let’s look at gold and silver since 1969 in the chart below index to 1.00 = 02 January 1969.
The amazing fact seen below is that silver’s last all-time high is still from January 1980. Silver that President Johnson admitted in 1965 (fifty-five years ago) was in chronic shortage. President Johnson promised to punish anyone who hoarded silver coins with the huge, multi-billion ounce inventory of silver the Treasury had. But that was in 1965. As I recall the Treasury had sold its last ounce of silver back in 2002, and now has none.
In our world of smartphones, solar power, etc, etc, etc, silver is indispensable. Cabbages and canned beans at the grocery store, as well as gold, cost more today than they did in January 1980 – so what’s with the price of silver in the chart below? It’s easy seeing why the Silver to Gold Ratio is now 88; look at the expanding gap between the price of gold and silver.
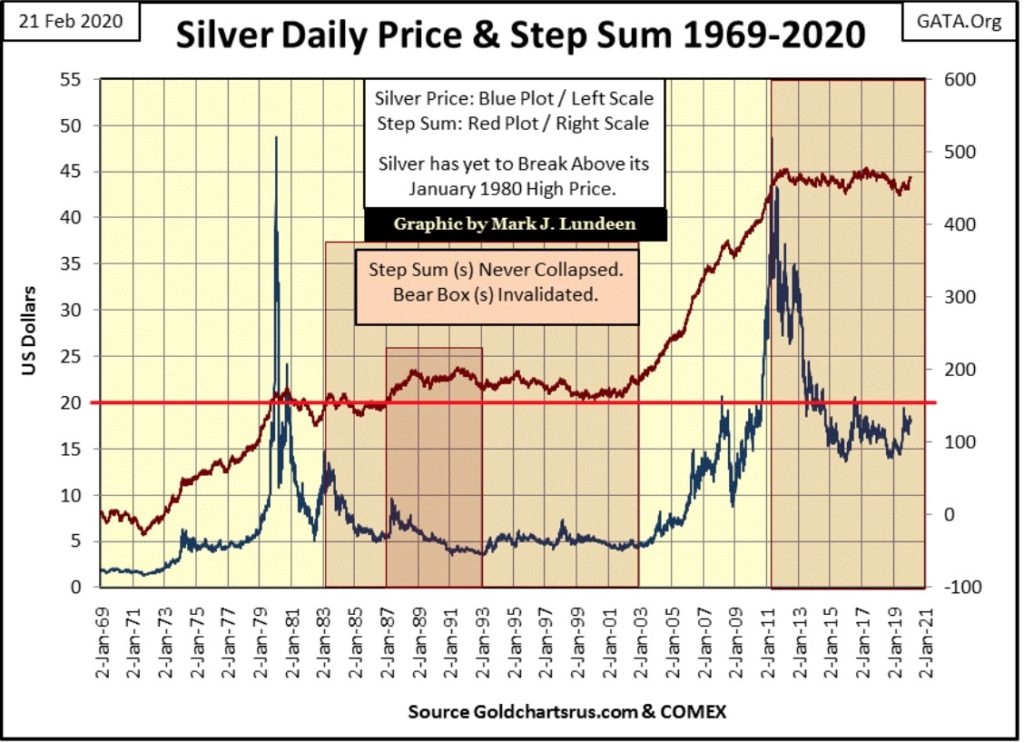
Next is silver with its step sum going back to 1969. Silver, when it comes to its step sum is really strange stuff, as its bear boxes always fail. Its market sentiment (Red Plot: Step Sum) never recouples with market reality (Blue Plot: Price of Silver) to the downside.
There are three massive bear boxes identified below:
- 1983 to 2003
- 1987 to 1993 (within the above bear box)
- 2011 to today
The first two boxes lingered on for years, before they both failed when the red step sum plot began rising with the price of silver in 2003, and I know silver’s current bear box is going to fail when its step sum plot begins to rise once again with the price of silver, which someday it must.
Why does silver act like this? It could be that silver today is primarily an industrial metal. Unlike investors, factories buy silver because they have to, and declining silver prices to an automobile manufacturer is no reason for buyer’s remorse.
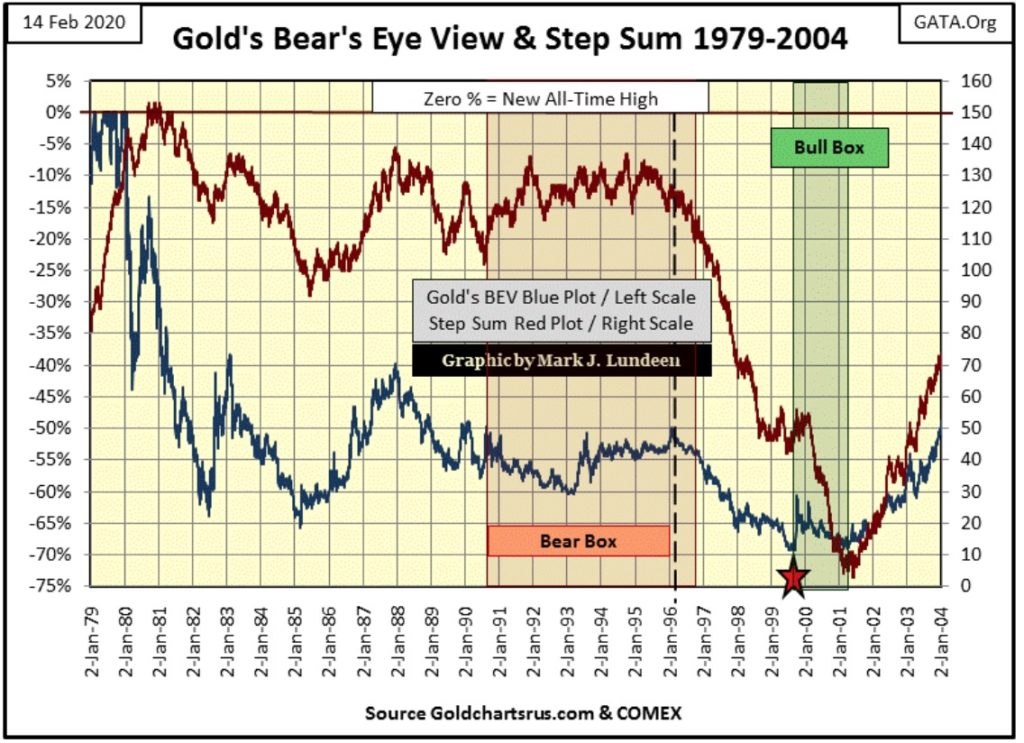
Do you want to see buyers’ remorse? Next is gold’s step sum chart from 1979 to 2004. From 1980 to 1996 market sentiment (Red Step Sum Plot) remained high despite the price of gold in decline or doing nothing for the bulls for years. Then with the collapse in the step sum plot, signaling the beginning collapse in bullish market sentiment – the bear box closed in 1996.
Market sentiment in the following six years eventually became so foul that at the actual July 1999 bear-market bottom of $253 (Red Star), gold’s step sum continued collapsing until February 2001 with gold closing at $255, two dollars above the actual bear market low from July 1999. Wow!
This refusal to see anything positive in the gold market, even after passing the bottom of a massive bear market resulted in a bull box in the chart below.
This inability to develop buyer remorse in the silver market explains the odd step sum action, but not that silver’s current last all-time high is from forty years ago. I just attribute that to manipulation in the silver market as admitted to the entire world in a press conference by President Johnson in 1965.
Here’s a dollar chart for silver going back to 1969, and the item to look at below is silver’s $20 line highlighted in red. History proves that interesting things can happen when silver * ADVANCES * above its $20 line. Take a moment and look at silver’s red $20 line. When silver increased above this threshold level, in 1979 and again in 2010, it made a moon shot towards its $50 line. But there are three occasions where silver advanced above its $20 line only to see the advance soon fizzled out.
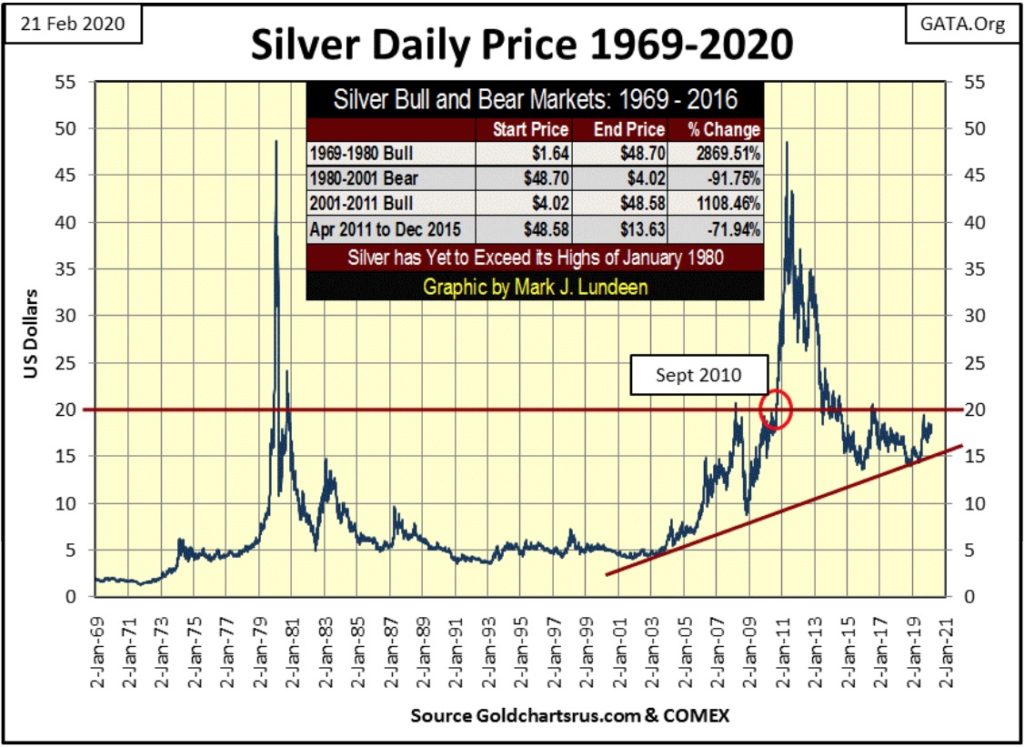
As silver is once again advancing towards this historically important threshold level; its $20 line, in the weeks and months to come it will be important monitoring silver’s reaction of seeing it again trading with a $20 handle. Will silver see its third moon shot to $50, or its fourth retreat back to lower levels? I’m thinking another moon shot too far above $50.
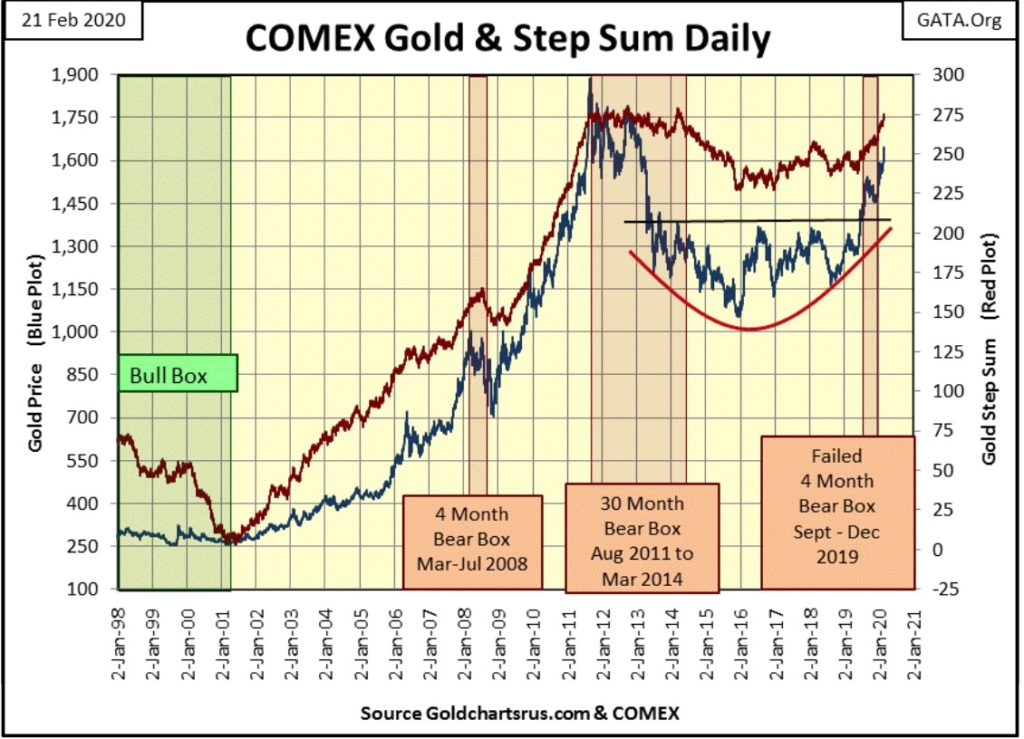
Next are gold and its step sum. This picture is worth a thousand words. So, now two months after the failure of a four-month bear box from last autumn, we see the market reality of the rising gold price in the blue plot, taking along with it market sentiment in the red step sum plot.
This chart is just a pretty picture that needs little commenting on. But if I could condense the thousands of words this chart portrays into a single word, it would have to be – BUY.
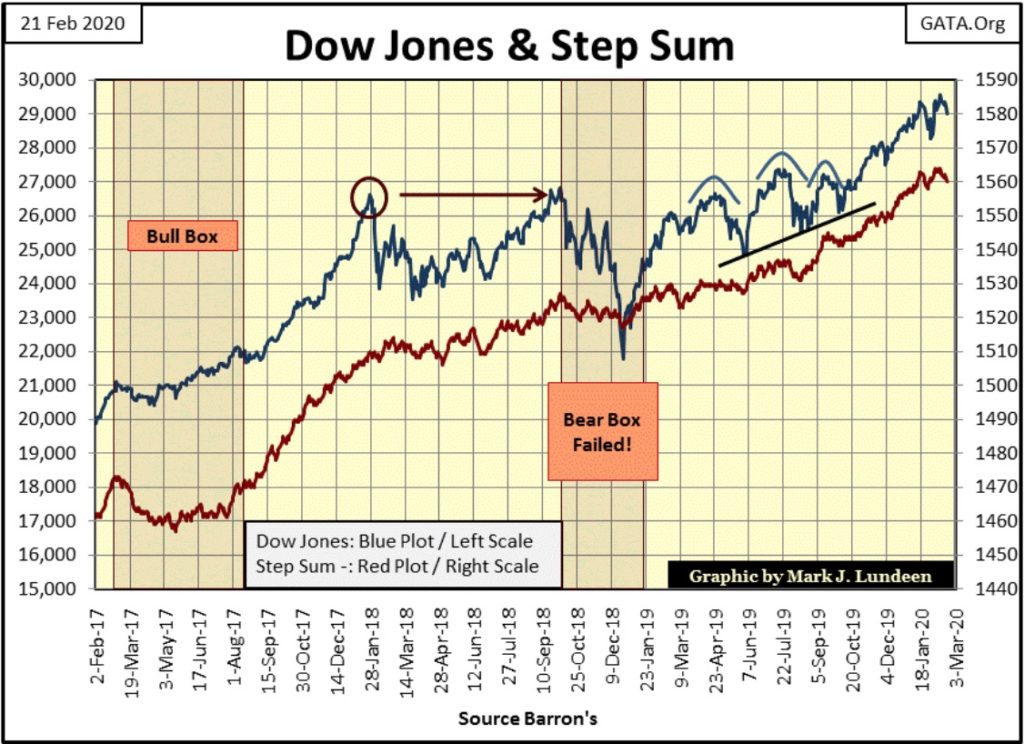
Below is the step sum chart for the Dow Jones, which is also bullish, but nothing like the above gold’s step sum chart.
Gold in its step sum table below has advanced 4.12 BEV points, ($77.75) from its last daily decline on February 11th. Gold’s daily volatility is increasing, something I like seeing. But its 15 count will see a +7, and possibility a +11 next week if gold continues seeing nothing but advancing days all next week. That would make gold an overbought market. But looking at gold’s BEV and step sum charts above – so what?
It’s been years since the gold market has seen any excitement to the upside, so I’m just going to enjoy the show should it decide to do something spectacular in the coming weeks. But technically it would do gold good if it saw a few down days next week, keeping its 15 count at +5 or below.
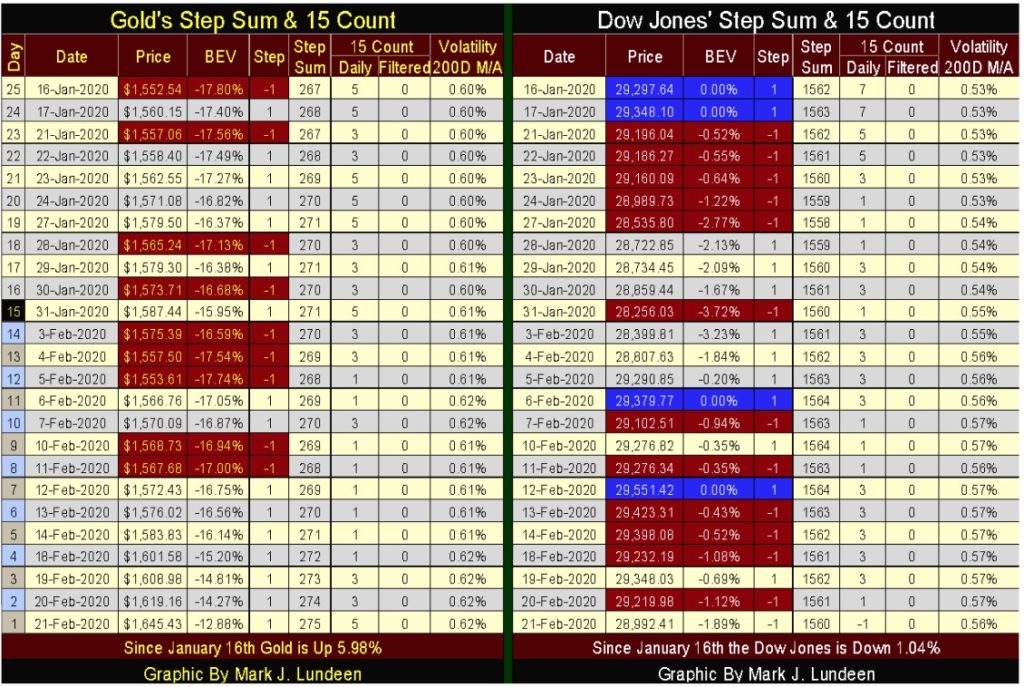
Unlike gold’s step sum, the Dow Jones’ step sum has flattened since mid-January. Not a major thing to be worried about in a market that has seen its step sum advancing since August 2017, and its price advance since December 2018. Not much more to say about the Dow Jones this week.
When I was young I’d believe anything the government said. And why not? I knew the government was managed by people of integrity, people who woke up every morning just to go to work protecting the interests of the American people, and the world at large.
Many decades later I’m now much older and wiser, as I now know the individuals who control government are interested in only their narrow self-interests.
Case-in-point, if you visit the links below you’ll read how Doctor Francis Boyle, the professor-at-law who wrote the bio-weapons act for the United States, claims the coronavirus is an escaped bio-weapon sold for profit to the Communist Chinese Government by a biological laboratory located in North Carolina. If so; what were these people thinking?
It’s as I’ve said before; “science” likes everyone to believe they are seekers of the truth, but the truth is the only thing most scientists seek today is government funding. So, scientifically speaking, this makes money funding research for biological warfare from Beijing no different than funding from Washington.
If all this is true; then this “government-regulated” bio-lab knew damn well what they were selling; a genetically engineered virus that they modified to make it an efficient killer of human beings.
And they knew to whom they were selling it to; the Communist Party of China, a political party when under the control of its Chairman Mao became the biggest mass murderer in the history of mankind. Like I said earlier in this article; we live in a dark world where bad things happen all the time.
As expected, Dr. Boyle had to go to Alex Jones’ INFO_WARS to get his message out as the MSM (Fake News) is currently censoring this information from the American public.
—
(Featured image by PublicDomainPictures from Pixabay)
DISCLAIMER: This article was written by a third party contributor and does not reflect the opinion of Born2Invest, its management, staff or its associates. Please review our disclaimer for more information.
This article may include forward-looking statements. These forward-looking statements generally are identified by the words “believe,” “project,” “estimate,” “become,” “plan,” “will,” and similar expressions. These forward-looking statements involve known and unknown risks as well as uncertainties, including those discussed in the following cautionary statements and elsewhere in this article and on this site. Although the Company may believe that its expectations are based on reasonable assumptions, the actual results that the Company may achieve may differ materially from any forward-looking statements, which reflect the opinions of the management of the Company only as of the date hereof. Additionally, please make sure to read these important disclosures.


RLUSD Launch in Japan Amid XRP Price Decline and Uncertain Outlook
Ripple and SBI launched the RLUSD stablecoin in Japan after JFSA approval, signaling strong progress in tokenization. However, XRP fell...


Youth Cannabis Use in Colorado Is Falling — But the Full Story Is More Complex
The 2026 Colorado survey shows teen cannabis use fell to 10 percent in 2025, down from 21 percent in 2015....


Morocco’s Growth Holds at 4.6% as Agriculture Offsets Economic Pressures
Morocco’s economy grew 4.6% in Q1 2026, driven by a strong agricultural rebound offsetting declines in industry. Services expanded moderately...


Abivax Shares Surge as New Trial Data Eases Safety Concerns Over Ulcerative Colitis Drug
Abivax shares surged nearly 36% after positive updated trial results for its ulcerative colitis drug obefazimod reassured investors following earlier...


El Dorado Raises $9M to Expand Cross-Border Fintech Platform
El Dorado, a Latin American fintech improving cross-border financial services, raised a $9 million Series A led by Paradigm with...
 |
|
 |  |
 |
|
-

 Impact Investing1 week ago
EU Weighs More Free Emission Permits in ETS Review to Boost Industry Competitiveness
-

 Crypto6 days ago
Bitcoin and Ethereum Slide as Market Pressure Builds Amid Strategy Concerns and Layer 2 Disruptions
-
 Business2 weeks ago
Fed Policy Shift Raises Concerns Over Debt and Inflation Risks
-
 Crypto2 days ago
Bitcoin Stalls Near $60K as Strategy Moves, ETFs Outflow, and EU MiCA Rules Take Effect