Featured
Gold stocks’ behavior remains unpredictable, GDP at a slow pace
With the ongoing rift between US and China, the mining sector continues to be volatile with gold stocks fluctuating in the stock market.

With all of the focus on potential trade wars, it is easy to overlook other things going on behind the scenes that might have an even more profound effect.
David Mamet is an accomplished Hollywood playwright, film director, screenwriter, and author of biting stories of intrigue and paranoia. He’s the winner of the Pulitzer Prize and Tony award for his play “Glengarry Glenn Ross” (1984). So, coming up with lines as above is his trademark. The line is really a joke, but it was in the context of a story that featured thefts, plot twists, double crosses, and double, double-crosses in a jewelry heist gone awry. Or did it? But the aim of the game is to make a lot of money.
After all, it has been said that money makes the world go around. Since the 2008 financial crisis, growth can at best be described as anemic, despite a lot of money being thrown at the problem. We have gone through a period of massive quantitative easing (QE) and a massive increase in debt, so one would think that growth would be stronger than an average of 1.9%. Even global growth is not much better, averaging maybe 2.5% despite high growth rates in China and other parts of Asia.
As we have noted in the past, global debt has soared during this period by some $90 trillion. In the U.S. debt has grown by almost $20 trillion. In the U.S. the Federal national debt has soared over $1.1 trillion since Trump’s election. Despite all of this, the money supply (M2) has grown by only about $6.3 trillion. The Fed’s balance sheet soared by almost $4 trillion. GDP on the other hand only grew by roughly $6.1 trillion. It took $3.27 of debt to purchase $1 of GDP.
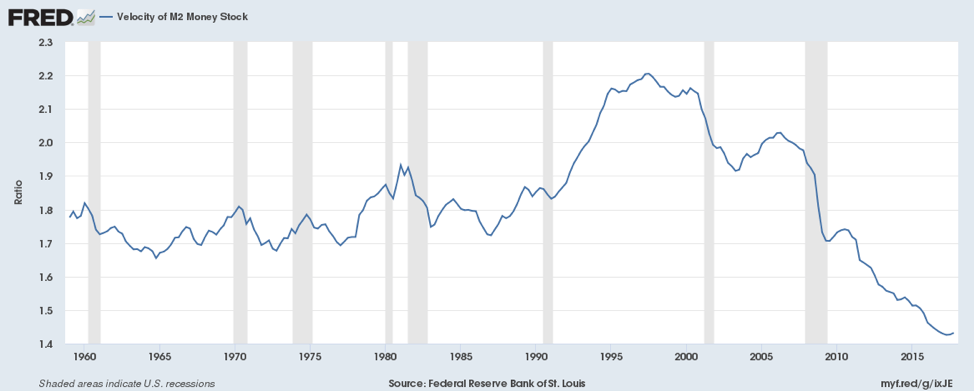
We rarely see a note on the velocity of money. What is the velocity of money? It is easily defined as the frequency with which the same dollar changes hands. If everyone sits on their dollars and doesn’t spend it the velocity of money may well plunge to zero. The velocity of money has been falling for years since the last peaking in the 1990s. It’s a prime reason why GDP has been so sluggish. We just are not turning over our money fast enough—certainly not like we were spending and therefore turning over money during what is now in hindsight the “roaring” 90s. Despite upwards of ten years of recovery since the financial crisis of 2007–2009, the velocity of money continues to fall.
© David Chapman
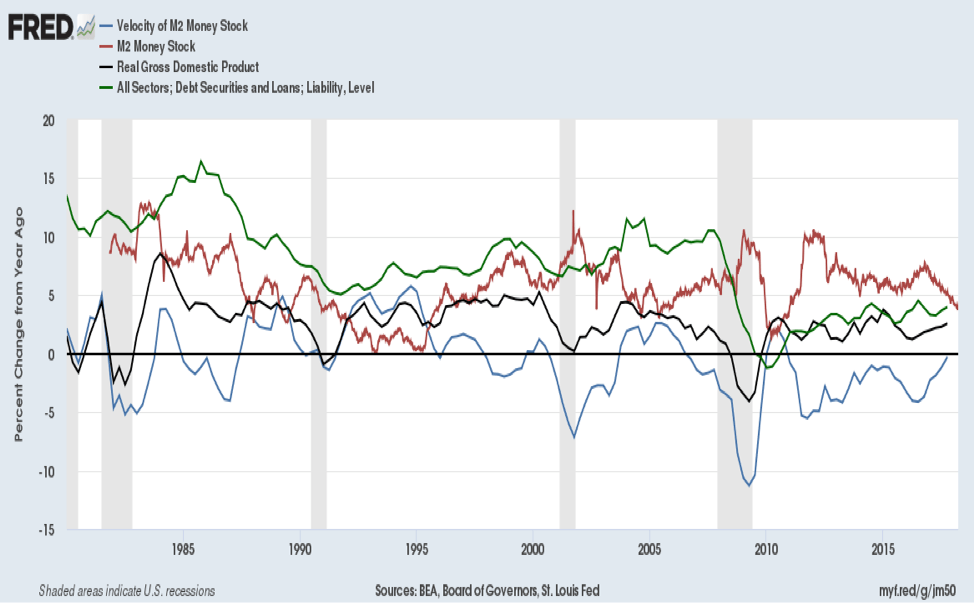
When we compare the falling velocity of money to Real GDP growth, M2 money growth, and growth in debt securities and loans an interesting picture comes into focus. The velocity of money growth has been negative for years with particularly large plunges before the 2000–2002 recession and the 2007–2009 recession. But money supply (M2) grew as did GDP and debt grew during the recessions. Debt growth was curtailed sharply at the end of the 2007-2009 recession and real GDP growth went sharply negative during that recession. While M2 growth turned down it never turned negative. Since then, M2 money stock is falling even as the velocity of money has been seeing some increase but is still negative, GDP growth has slowed from an earlier peak, and the growth of debt securities and loans is sluggish at best.
© David Chapman
Now we have not only the end of QE but the Fed is trying to bring down the size of its balance sheet and hike interest rates. Interestingly enough, while the Fed wants to pull back the size of its balance sheet keep in mind the size of the Fed balance sheet in relation to the entire picture is actually quite small. Economist Martin Armstrong of Armstrong Economics premised that real money supply is all the debt plus M2. Money is created by lending, especially lending on a leveraged basis which is primarily the case. It is not necessarily the money just created by the Fed.
Total household debt stands at $18.9 trillion. Add to that non-financial corporate business debt of $6.1 trillion-plus the national debt of $21.1 trillion and you have a money supply totaling $46.1 trillion. Add in the M2 of about $14 trillion and money supply totals $60.1 trillion. The Fed’s balance sheet is $4.4 trillion, just over 7% of the total money supply. Furthermore, there are liquid assets such as the stock market at about $30 trillion and we are not even going to count real estate much of which is not particularly liquid. It puts the size of the Fed in perspective.
But the Fed is trying to trim its balance sheet and is also hiking interest rates, which has a negative impact on the economy. Rising interest rates put more strain on the U.S. Treasury as their debt servicing costs will rise. That is already happening. With money supply (M2) contracting and lenders tightening their loan qualifications, all of this should start to contract debt growth and ultimately GDP growth. The recovery, such as it has been since the financial crisis of 2008, has been best described as “muddling through.” Combine all of the above and we could soon be back in a recession.
The week that was
Chaos and volatility continue to rule the markets. Since the stock markets topped on Jan. 26, 2018, there have been at least a dozen days including Friday’s action where the daily move up or down was 1% or more. Before that 1% move days were rare. The markets have been driven primarily by the thoughts of a trade war between the world’s two largest economies—the U.S. and China.
But a full-out trade war is not a given. There is the rhetoric that is sparking huge volatility and chaos in the stock market. But rhetoric leads to negotiations. Earlier, Trump’s economic advisor Larry Kudlow tried to calm markets with “don’t overreact.” That helped reverse the Dow Jones Industrials (DJI) on Wednesday. Then Trump turns around on Friday and announces an additional $100 billion of tariffs after China had earlier announced tariffs on $50 billion of U.S. goods to match the first batch of tariffs. It’s like poker. But who’s bluffing?
None of these tariffs have actually happened yet and the latest round of $100 billion in tariffs was referred to the U.S. trade representatives. Nonetheless, China responded to the rhetoric by threatening even more tariffs and that put the markets on edge. And don’t forget China’s holdings of over $1.1 trillion of U.S. Treasury Securities.
Trade war concerns have not been the only thing that has shaken market confidence. Technology stocks led by Facebook (FB) have taken a beating in the past couple of months. Facebook has found itself engulfed in a scandal that their users’ personal information was used to disseminate “fake news” and through Cambridge Analytica, the data was also used in the Trump campaign for President. But Amazon has also fallen as it is under attack from the President for taking advantage of the Post Office and not paying taxes. Trump has also attacked The Washington Post, a newspaper that has been critical of Trump and is owned by Jeff Bezos, the world’s richest man and founder, chairman, and CEO of Amazon.
Also shaking the markets has been the ongoing diplomatic spat with Russia where the western nations, led by the United Kingdom and the U.S. have expelled dozens of Russian diplomats and even closed a Russian consulate in Seattle over the alleged attempted murder of a Russian double agent in Salisbury, U.K. using a nerve agent. In retaliation, Russia has expelled an equal number of diplomats from the western countries including closing a U.S. consulate in St. Petersburg. Chaos in the White House has not helped either as a number of high-profile Secretaries have been fired or resigned. Some have said that Trump has rid himself of the “adults” in the White House, to be replaced by “toadies” and “sycophants.”
Finally, the markets are also concerned about rising interest rates and the potential for increased inflation. The unwinding of QE by the Federal Reserve is also a concern because some believe it could cause more chaos and increase volatility. What never seems to be mentioned is the mountain of debt in the world—now estimated to be at least $233 trillion, an increase of over $90 trillion since the 2008 financial crisis.
On Apr. 6, 2018, the U.S. job numbers were released and they were a disappointment, coming in sharply under expectations. We discuss the U.S. job numbers further on in the weekend’s report.
But the major focus has been on the potential for a trade war with China. China has vowed to fight any tariffs by imposing tariffs on U.S. goods. Trump has asked whether an additional $100 billion of Chinese goods could be targeted for tariffs. China has also vowed to take the U.S. to the World Trade Organization (WTO) an organization that the U.S. has attacked; see the Reuters article China urges WTO members: Put U.S. tariff ‘beast back in the cage’.
There are some who also believe this is not really about the trade but about “raw power”—who is in charge and who will be the dominant economy in the 21st century (Ambrose Evans-Pritchard, April 5, 2018 – Trump’s power struggle with China isn’t about trade.) It is noteworthy that the latest U.S. national security strategic report said China was a strategic rival that seeks to “challenge American power, influence, and interests attempting to erode American security and prosperity.” In looking at history this is precisely the kind of thinking that preceded WW1, except the protagonists were Great Britain (today U.S.) and Germany (today China).
The question is: does Trump wish to trigger a stock market crash and panic in the year of the mid-terms where Democrats could potentially gain control of both Congress and the Senate?
Over the past 30 years, China has become an integral part of the world economy and has become a member of global institutions such as the IMF, the World Bank, and the WTO. But China and Russia have been concerned that the U.S. dominates too much and have been in the process of setting up counters to U.S-dominated institutions such as the IMF and the World Bank, and even the world’s payment system SWIFT. The Yuan would become the prime currency in their world supplanting the U.S. Dollar. All of this is economic challenge and threat to the U.S.’s position as the world’s dominant economy and to the U.S. Dollar as the world’s reserve currency. Again, looking at history this is how the world has ended up in global military wars. In a world dominated by nuclear weapons, that is not a friendly thought.
Going forward, it is notable that the U.S. earnings season is about to get underway. If the other issues remain as noise in the background and earnings come in at or better than expectations, the market will take this as a signal that there may be a lot of noise but that their concern is the economy and how well the companies do. If successful, the markets could then find a bottom and begin another climb. But the noise has to remain in the background even as it could raise its ugly head at any time.
The job numbers
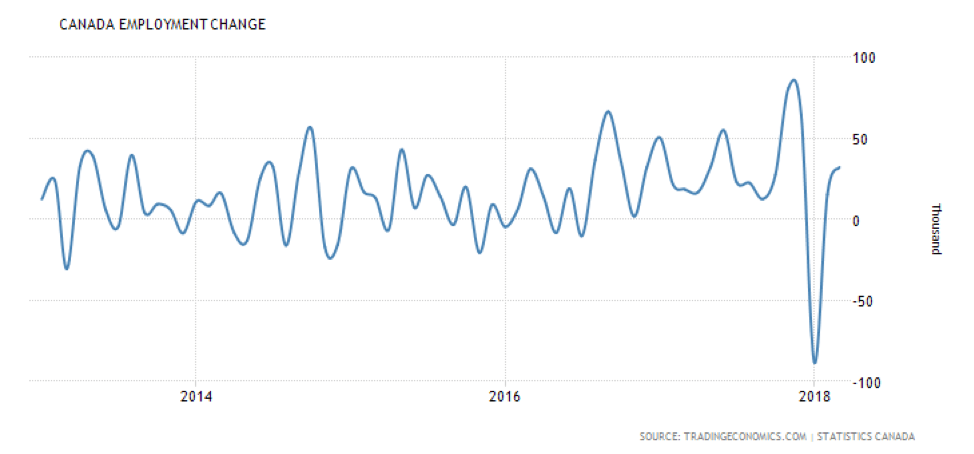
Friday marked the release of the job numbers in both Canada and the U.S. First, let’s look at Canada. The Canadian equivalent of the non-farm payrolls came in at a gain of 32,300 jobs for March 2018. This was above expectations of a gain of 20,000 jobs. The breakdown was full-time work showing a gain of 68,300 while part-time fell 35,900. The unemployment rate was steady at 5.8% as was the labor force participation rate at 65.5%. Construction and public service led the gains. This was good-news numbers although it is not expected that it will change the stance of the BofC. The solid job numbers, as opposed to the weaker than expected U.S. report, helped push the Cdn$ higher compared to the US$. Also helping the Cdn$ was the ongoing trade spat between the U.S. and China. The gain in jobs seems to put the Canadian economy back on track with regard to jobs after the large unexpected drop in January which appeared to be largely due to seasonal reasons. Wage growth was steady at 3.1% y/o/y. The unemployment rate reported is known as the official rate. When one includes discouraged workers, those waiting for jobs, and involuntary part-timers the jobless rate jumps to 9.1% (R8). That rate would be equivalent to the U.S. reported U6 unemployment rate. While not widely reported the R8 unemployment number is a better reflection of the unemployment picture.
© David Chapman
The U.S. nonfarm payrolls for March came in unexpectedly lower on Friday. The number was a jobs gain of 103,000 vs. an expectation of 185,000 jobs. The February nonfarm payrolls were revised upward to 326,000. But the jobs were largely full-time in areas such as manufacturing, healthcare, professional services, and mining while retail jobs (more likely part-time) fell. While the February nonfarm payrolls were revised upward the January nonfarm payrolls were revised downward to 176,000. The average of three months was 203,000/month vs. 218,000/month. Despite the decline in nonfarm payrolls, economists maintain the U.S. economy remains mostly on track (subject to economists being mostly wrong, especially just before recessions and market collapses).
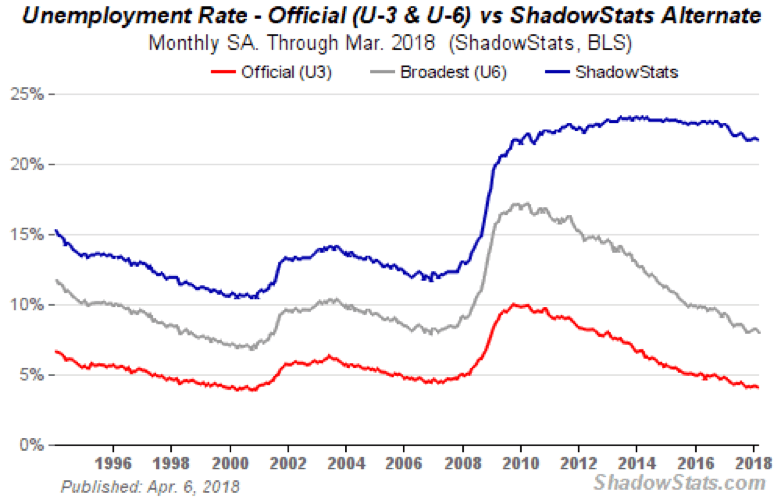
The unemployment rate (U3) was unchanged at 4.1% although that disguises the fact that it actually slipped to 4.07% from 4.14%. The U6 unemployment number (U3 plus discouraged workers unemployed less than one year plus marginally attached workers seeking full-time employment) was 8% vs. 8.2%. The Shadow Stats number was 21.7% vs. 21.8% (U6 plus discouraged workers defined in 1994 as out of the labor market under Clinton and unemployed over one year. They are termed as “not in the labor force”). The labor force participation ratio was 62.9% vs. 63%. This would help lower the U3 unemployment rate as more drop out of the labor force (and then become a part of either U6 unemployment or the Shadow Stats unemployment). Unsurprisingly, the number of employed persons slipped to 155,178 thousand from 155,215 thousand. The number of part-time people rose to 27,858 thousand from 27,458 in February 2018.
Earlier in the week, the fourth quarter 2017 GDP was revised to 2.89% from 2.54%, but it was down from the third quarter number of 3.16%. The trade balance for February was a deficit of $57.6 billion higher than January’s $56.7 billion. The trade balance is negative for the U.S. economy in the long run. It is baffling as to why Trump never mentions this number in his rants against the trade practices of China. It is the biggest trade deficit since October 2008.
© David Chapman
Economic war between U.S. and Russia
The U.S. announced on April 6, 2018, they were imposing sanctions against 24 Russians by freezing the U.S. assets of oligarchs and others who have close ties to Russian President Vladimir Putin. Included are members of both the upper and lower houses of Russia’s parliament. This is another shot in the ongoing war between Russia and the U.S. In a lot of respects, it doesn’t differ that much from the trade war erupting between China and the U.S. Sanctions, expulsions of diplomats and others are, it seems, being responded to by sanctions and expulsions from the other side. The expectation is Russia is likely to retaliate against U.S. interests in Russia. That, in turn, could have a negative impact on the stocks of companies whose bosses might face sanctions.
According to a report from CNN Money published in July 2017, Russia has invested roughly $4.6 billion in U.S-based business. But the U.S. has invested roughly $9.2 billion in Russian-based business. Overall, that is not a lot in terms of total U.S. investment or even Russian investment. At one time U.S. investment in Russia was much higher: see U.S.-Russia business ties: 5 things you need to know.
Trade between the two countries is not particularly large, estimated at about $24 billion in 2017. The U.S. has a small trade deficit with Russia of about $10 billion. U.S. imports from Russia are primarily mineral fuel, iron and steel, and platinum. The U.S. sends Russia agricultural products amongst others.
It would be impossible to speculate as to who Russia might apply sanctions to and/or freeze assets. But they would most likely be designed to impact companies and people close to Trump as was the case with the U.S. sanctions against Russia. Some U.S. companies with investments in Russia include Boeing, McDonalds, Morgan Stanley, Exxon Mobil, Baker Hughes, KPMG, Schlumberger, Conoco Phillips, Kron Energy, Chevron, Johnson & Johnson, Bristol-Myers, Cisco Systems, General Electric, General Motors, Hewlett Packard, Honeywell, Walt Disney, VISA, Xerox, Met Life, and many more, too many to list.
The big question is whether there are Trump ties to Russia and by extension Russian oligarchs. A story written in The Washington Post in November 2017 outlined numerous Trump business ties with Russia—all, of course, before he became President. Trump’s sons and daughter and son-in-law also have investment ties to Russia. Russian businessmen have an estimated $100 million invested in Trump properties primarily in Florida. Considering that, as we noted, The Washington Post is owned by Jeff Bezos of Amazon then his attacks on Amazon take on some meaning. One may accept these or not, but they are also the subject of the Mueller investigation.
Given the sanctions against numerous individuals in Russia, one could probably expect that a retaliation against U.S. individuals and business will follow. It is noted that a number of Russian companies’ stocks were negatively impacted by the announcement of the sanctions. A negative impact on any U.S. companies’ stocks could follow. And that, in turn, could impact the indices as many of the companies are a part of the S&P 500 and even the Dow Jones Industrials (DJI).
Bitcoin watch!
© David Chapman
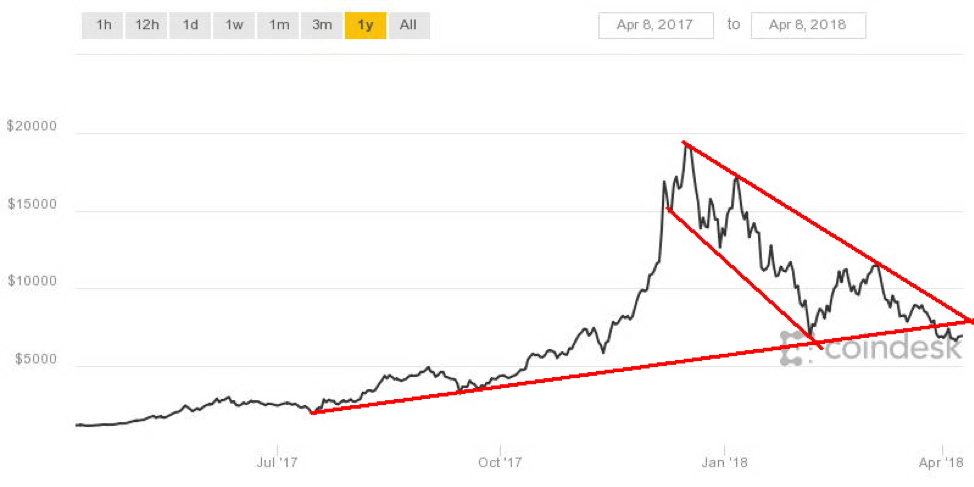
Bitcoin keeps sinking. It is now trading under $7,000 and threatening to fall to $6,000, reaching levels last seen in November 2017. With the drop back under $7,000, one has to call this a failure on the part of the bulls. There is potential support down to around $5,800 to $6,000 and that is the likely next target. Our potential longer-term target is for a decline to at least $2,400 which would mean a collapse of 88% from the all-time high set in December 2017.
The market cap of Bitcoin is now down to $112 billion which is about a third of its all-time high market cap of around $324 billion. The market cap of the entire cryptocurrencies market, as noted on Coin Market Cap, has fallen to $249 billion. That too is about a third of the market cap of the cryptocurrency market at its peak. There are a number of cryptocurrencies that have fallen 90%.
Were there any winners this past week? Well, one that we spotted is Verge which is up a whopping 65% in the past week. Verge is in the top 25 cryptos with a market cap of $874 million. That sounds great. But keep in mind even Verge is down about 75% from its market peak in December 2017. Dead cat bounce is the best way to explain this one. It’s market cap peaked at $3.3 billion.
Admittedly, it is becoming more difficult to find anything positive to say about Bitcoin or the cryptocurrency market—or for that matter to write anything new about them. If cryptocurrencies are going to become long-term viable—and that may happen—they will inevitably have to face regulation and oversight. The cowboy mentality needs to be cleaned up as the universe has been fraught with scams, fraud, and the collapse of exchanges. We can only speculate that billions have been lost but more than likely some early birds made a fortune and most likely bailed at an appropriate time without telling anyone.
Blockchain, the technology behind cryptocurrencies will survive, but of 1,550 cryptocurrencies listed at Coin Market Cap hundreds of them will just disappear. We won’t be trying to pick who might survive although Bitcoin could be one of them. Sadly, a lot of innocent people probably lost a lot of money learning a nasty lesson about bubbles and manias and the inevitable collapse that follows. The question that has to be on many minds is: will the stock market follow the cryptocurrencies?
Markets and trends
© David Chapman
© David Chapman
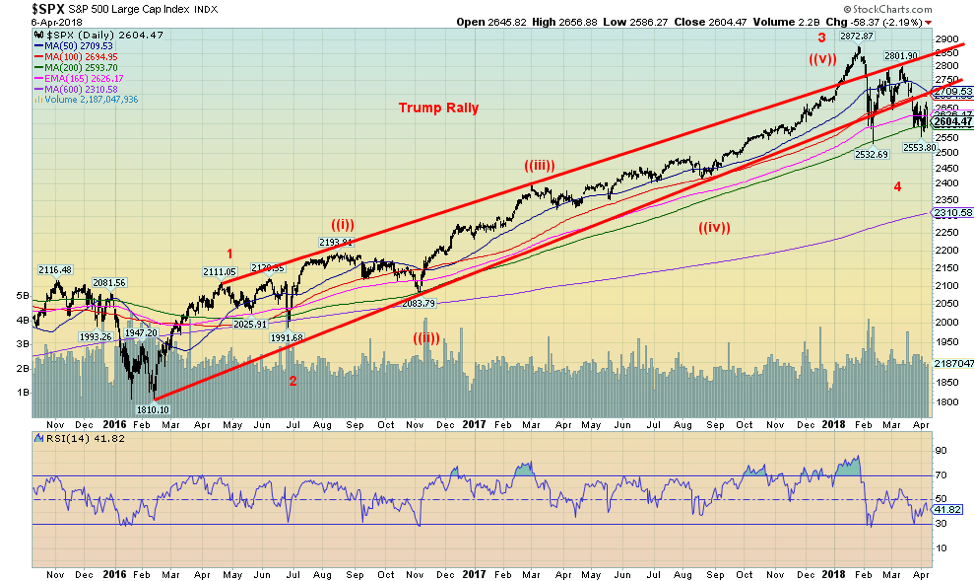
The U.S. stock market remains in a bear market. Actually, more of a mini-bear at this stage as only the daily trend (short term) has turned down. But the intermediate trend is rolling over and another down week could well pull the intermediate trend into down mode. The long-term (monthly) trend continues to be an up mode. Over the past few weeks, the S&P 500 has been testing the key 200-day MA but has not firmly broken under that level. Driving the market is the ongoing potential for a trade war between the U.S. and China. That could turn into a global trade war as countries rush to protect their industries and retaliate against the increased protectionism and nationalism emanating from the U.S.
So far, the drop is only 9.4% down from the January 2018 high of 2,872. A 20% drop and official bear market territory is down at 2,300 which would put the S&P 500 down at the 4-year MA (designated here as the 1,460-day MA). Our wave count above suggests that this is merely wave 4 up from the February 2016 low with another wave to the upside to come. Elliott Wave International has suggested the January top was the final top. Whether we are right or they are right is moot actually as we both agree the decline thus far should result in another wave up that would take the S&P 500 (and DJI) back to the highs and possibly a bit higher. Typically, a bear market does not start all in one swoop and there can be drops followed by re-tests of the previous highs. That re-test can make new highs or it can fall short.
As is often the case volume has fallen and volatility, despite Friday’s sharp down day, has also fallen. Many indicators are diverging suggesting to us that a rally could get underway soon. That doesn’t mean the current decline is over, but if the S&P 500 recovers and regains back above 2,650 we would suggest that a low is in and the rebound and could well be underway. New lows may only see small new lows on lower volume and not the start of another wave to the downside. The sentiment is bearish right now and it is those kinds of conditions that help set up a rebound.
© David Chapman
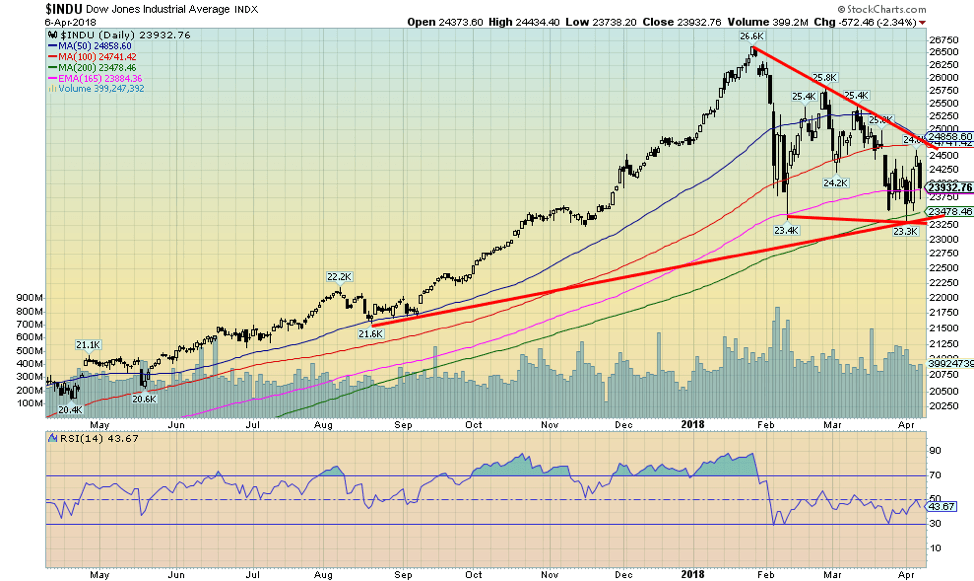
The above chart of the Dow Jones Industrials (DJI) shows that the DJI did make slight new lows on April 2, 2018, below the low of February 9, 2018. The second low also tested the 200-day MA. Note the high volume on the first decline in February and lower volume on the decline into April. It has been a volatile week as the DJI plunged, then suddenly turned around on Wednesday when the market focused on the potential for there to be trade discussions with China rather than an outright trade war. That was reversed on Friday when Trump announced that an additional $100 billion of Chinese goods was to be considered for tariffs. Our conclusion with the DJI is the same as the S&P 500 in that there is potential to find a low here and start a rally that takes us back to the January high. During that rally, watch the action of the Dow Jones Transportations (DJT). At significant tops and bottoms, the DJI and the DJT usually diverge—meaning that in this case, one would make a new high but the other would not.
© David Chapman
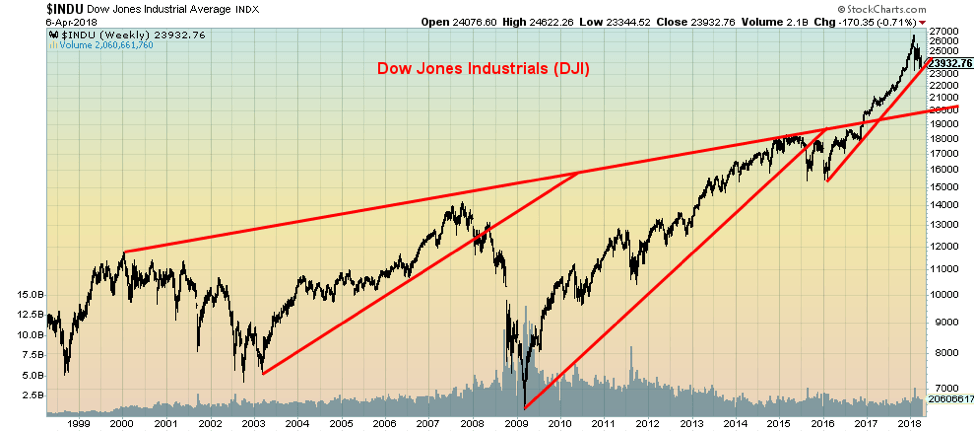
Here is a big picture of the DJI. We drew a line along the lows of the rise from October 2002 to October 2007, then drew parallel lines from the 2009 low and the 2016 low. The rise from March 2009 to August 2015 held that line as did the rise from February 2016 to present. The breakdown level would be new lows for the DJI or a break under 23,000. Major support can be seen down to 20,000 which we believe would be minimum targets for a decline. A test of 20,000 would be a 25% decline from the January 2018 top. Ergo, the reason we cited before that a breakdown under 23,250 could lead to more selling. And in this case, a breakdown under 23,000 could lead to a decline to 20,000. Regaining 25,000 would be helpful if we are to rise back towards the January 2018 top.
© David Chapman
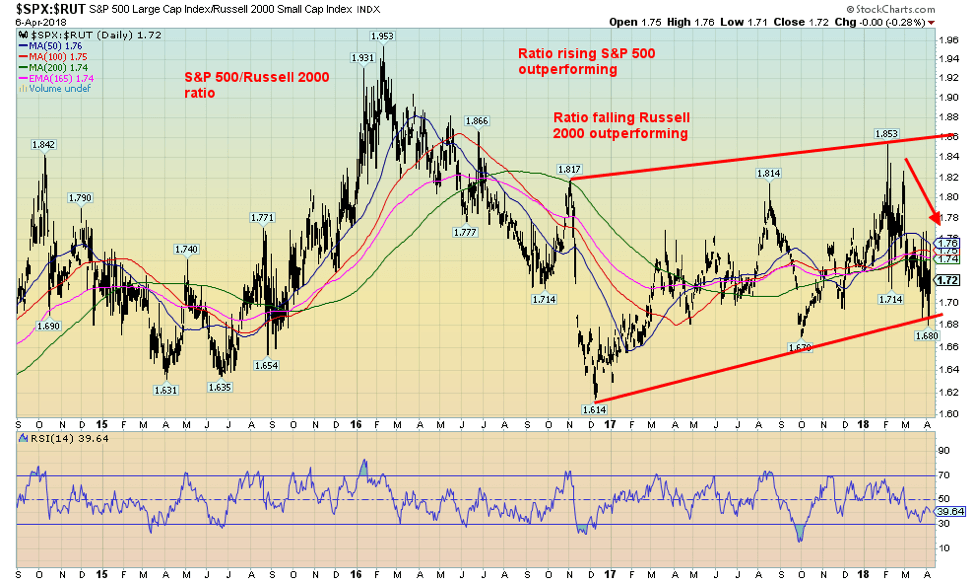
One reason we remain optimistic that we could see return action to the previous highs is the S&P 500/Russell 2000 ratio. Over the past several weeks the ratio has been falling, telling us that on balance small cap stocks (Russell 2000) have been outperforming the large-cap stocks (S&P 500). Note how in the bear market that got underway in June/July 2015 before bottoming in February 2016 saw the large-cap stocks (S&P 500) outperform the small-cap stocks (Russell 2000). This is what we would expect in a bear market. When the bull resumed the ratio started falling, indicating that the small-cap stocks were leading the way. Again, this what one would expect. The ratio bottomed in December 2016 and since that time it has irregularly moved higher culminating in a top in January 2018. That was a divergence, as we would have expected the opposite with small-cap stocks outperforming. Since the decline got underway in February it has been the small-cap stocks that have been outperforming. Here again, we’re seeing divergent behavior supporting our thought that another run to the upside could soon get underway.
© David Chapman
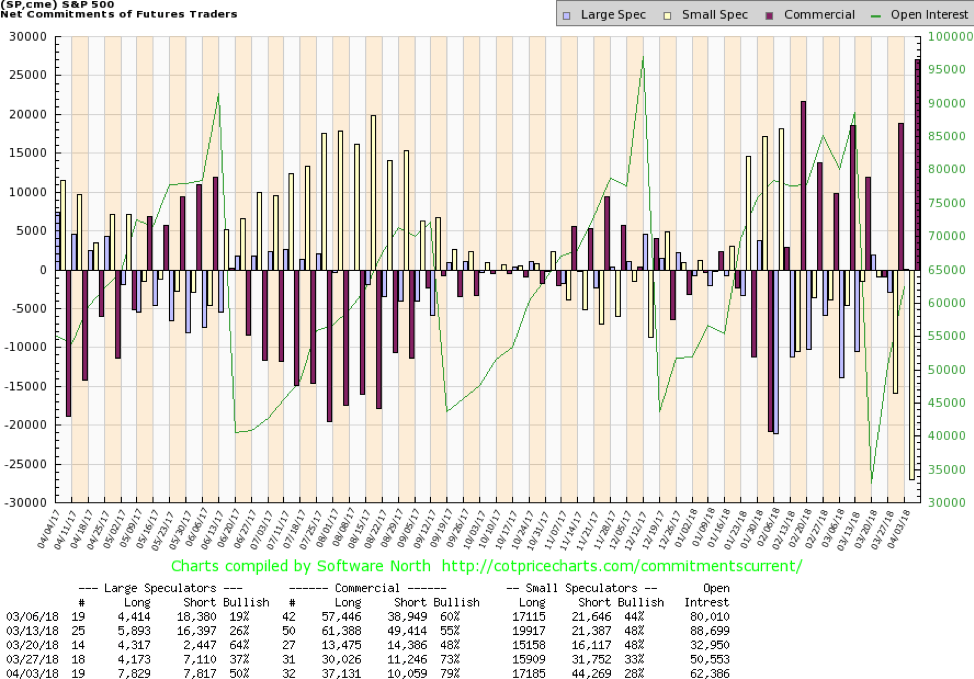
We rarely show the commercial COT for the S&P 500 but we thought this interesting. The commercial COT for the S&P 500 jumped to 79% this past week from 73% the previous week and 48% just two weeks ago. The commercials who tend to lead the market have sharply reversed their position from down to up in the space of a couple of weeks. This past week alone saw long open interest jump about 7,000 contracts while short open interest fell a small 1,000 contracts. Note how back in October to January the commercial COT shed its long position and was increasingly short. They were setting up for the drop that materialized in February 2018. Oddly enough, the large speculators’ COT (hedge funds, managed futures, etc.) jumped to 50% this past week from 37% the previous week. They are fairly balanced but the past week’s action was also somewhat bullish. We are with the commercials in our expectations of a rebound that could get underway soon.
© David Chapman
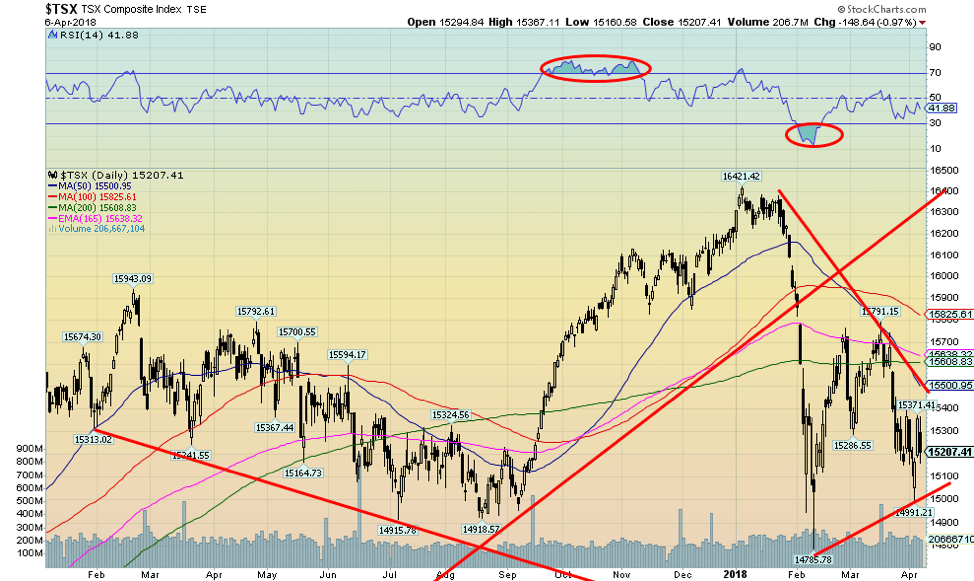
The pattern on the TSX Composite is similar to the S&P 500 and the DJI, except that the TSX has been weaker and is down 6.2% thus far in 2018. We find that the TSX is sector-driven so there could be sectors that are bullish even as other sectors are bearish and the index is bearish. A number of the TSX sub-indices are rather neutral on their weekly charts. The worst-looking charts are Telecommunications and Utilities. Those may be two areas to avoid. Gold and Energy could be turning up while Real Estate and Information Technology remain in uptrends. Financials appear to be turning around and if they do turn up that would help lead the TSX higher. Resistance is at 15,500 and support is at 15,000. A break above 15,500 could start to turn the TSX higher and take it back towards 15,800 16,000 where it would run into resistance.
© David Chapman
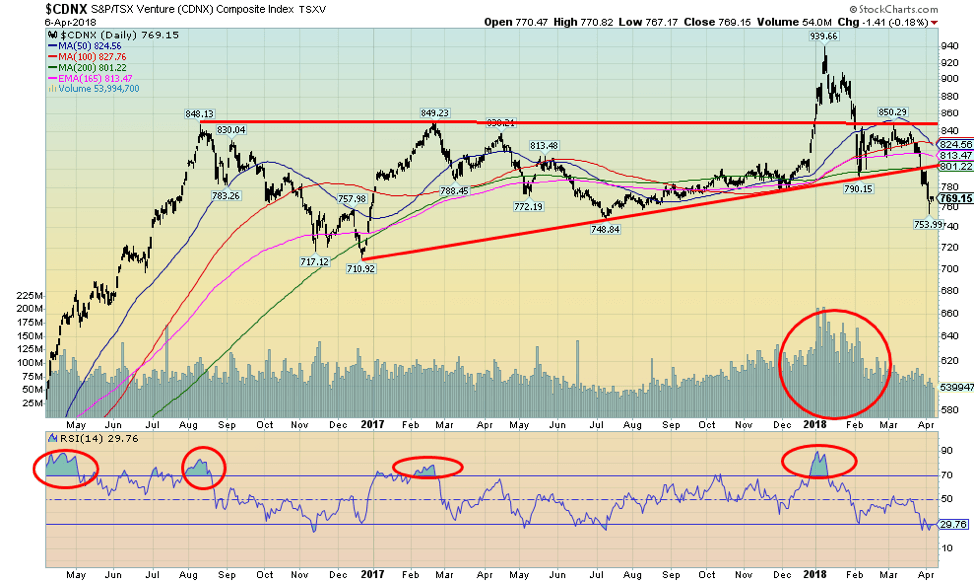
The TSX Venture Exchange (CDNX) that broke out back in November/December 2017 appears to have floundered as it turned around and then fell with a sharp drop into a low this past week. The CDNX is about 50% material or mining stocks. The drop to 754 has admittedly confused us as the breakout came on high volume and appeared as a major turn around for the CDNX which has been a gross underperformer the past few years. The drop on sharply lower volume suggests that this may be corrective back move only. The index needs to regain back above 825 to suggest higher levels. The CDNX is oversold at these levels but it doesn’t guarantee a turn-around. But, as we have noted in the past, the stocks that dominate the CDNX are cheap and under-owned. Despite the drop the CDNX remains up, almost double its all-time low.
© David Chapman
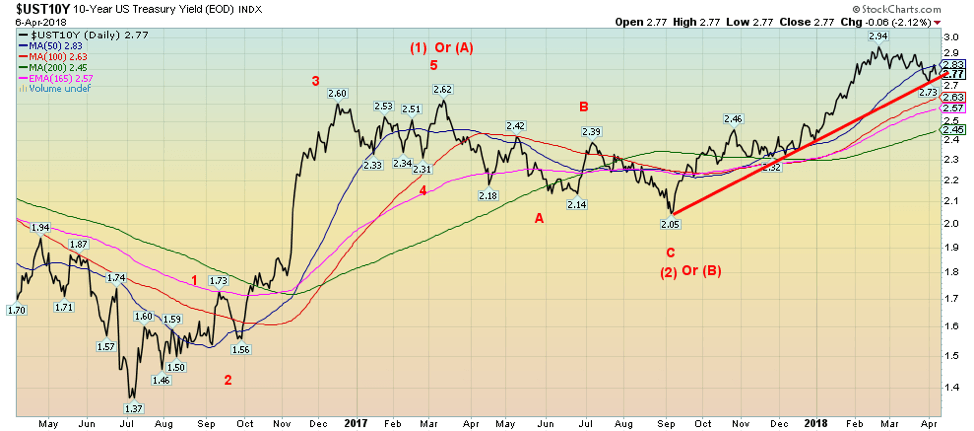
With trade jitters dominating the news and the Fed vowing to maintain its stance on interest rates, the 10-year U.S. Treasury note inched higher this past week closing at 2.77% vs 2.74% the previous week. But that was after hitting a high of 2.83% earlier. Rates came down when the nonfarm payrolls came in sharply lower than expected. The 10-year hit the 50-day MA before backing off. This could be bullish short-term but the 10-year needs to break under 2.75% to suggest a further move lower. Support can be seen down to 2.45% although we doubt that the 10-year would fall that low. The Fed continues to hint that the economy is strong and, knowing the Fed, they would not overreact to the March nonfarm payroll but instead look at the bigger trend and picture. The Fed continues to preach three rate hikes in 2018. The next one could be in June but if not June, September for sure. But they also seemed to be upping the thought of rate hikes into 2019 and 2020. We maintain potential long terms for the 10-year up to around 3.20%. This may well be 4th wave correction with another wave to the upside to come.
© David Chapman
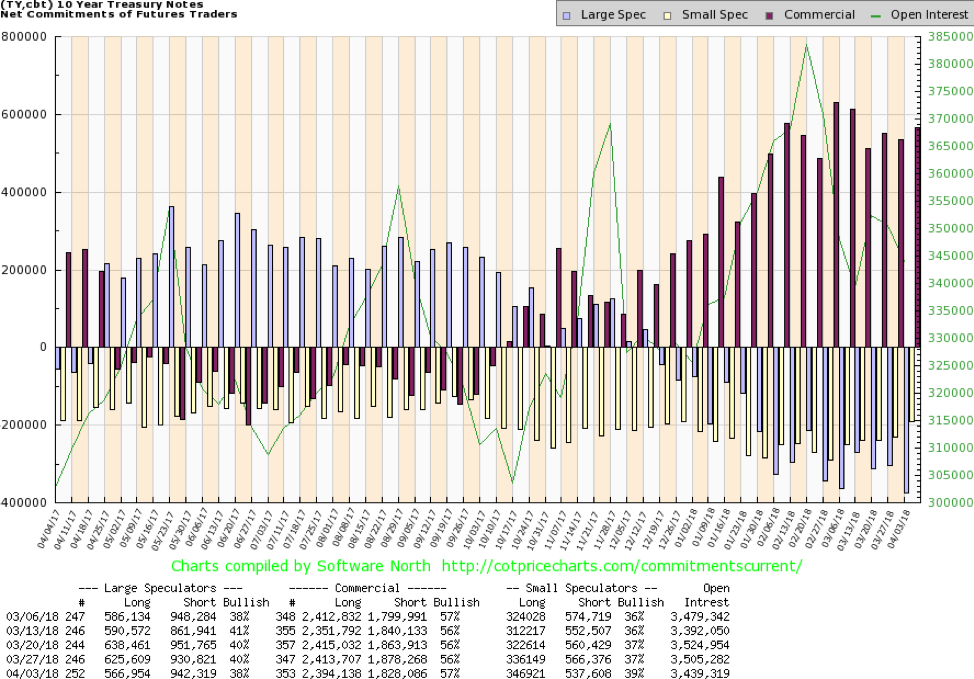
There is, however, an argument for a further decline in the 10-year Treasury note yield at least initially, given the stance of the commercial COT for the 10-year U.S. Treasury note. The commercial COT has been ticking slowly higher and is now at 57% vs. 56% the previous week. The large speculators COT slipped to 38% from 40% and they are net short. If one notices back in 2017 the commercial COT was net short at least until October 2017. If one notes on the chart of the 10-year U.S. Treasury note it bottomed in September 2017 at 2.05%. After that, rates began to rise. Now the commercial COT has moved from net short to net long. That suggests to us that the 10-year could well break under 2.75% and move lower going forward. We have noted support down to 2.45% but a break under that would kill any thought of a move to 3.20%.
Recession watch spread
© David Chapman
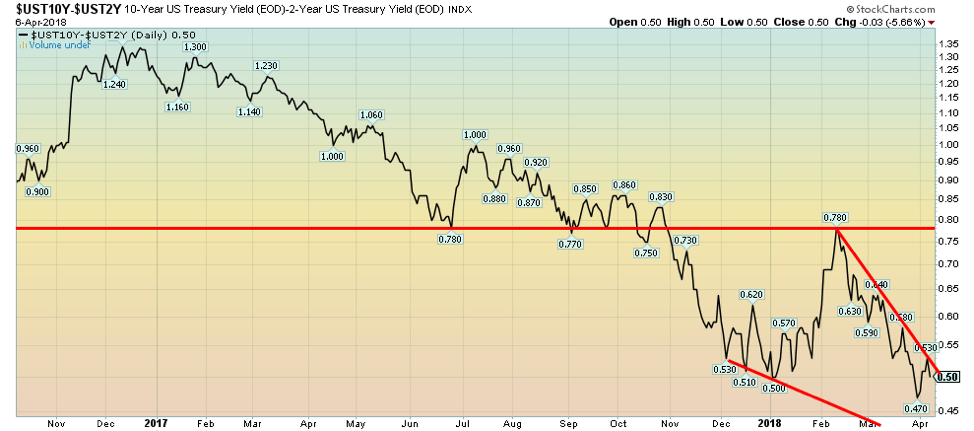
The 2–10 spread rose to 0.50% this past week from 0.47% the previous week. However, it is down from a peak of 0.53% earlier in the week. The general trend of the 2–10 remains to the downside. It is, however, nowhere near potential recession levels. Normally one sees a negative spread before a recession. But with some potential for the 10-year yields to fall further and the Fed remaining on target for its interest rate hikes in 2018 the 2–10 spread is likely to move lower as we move through 2018 and into 2019. The previous low was seen at 0.47. Expect that level to fall at some point.
© David Chapman
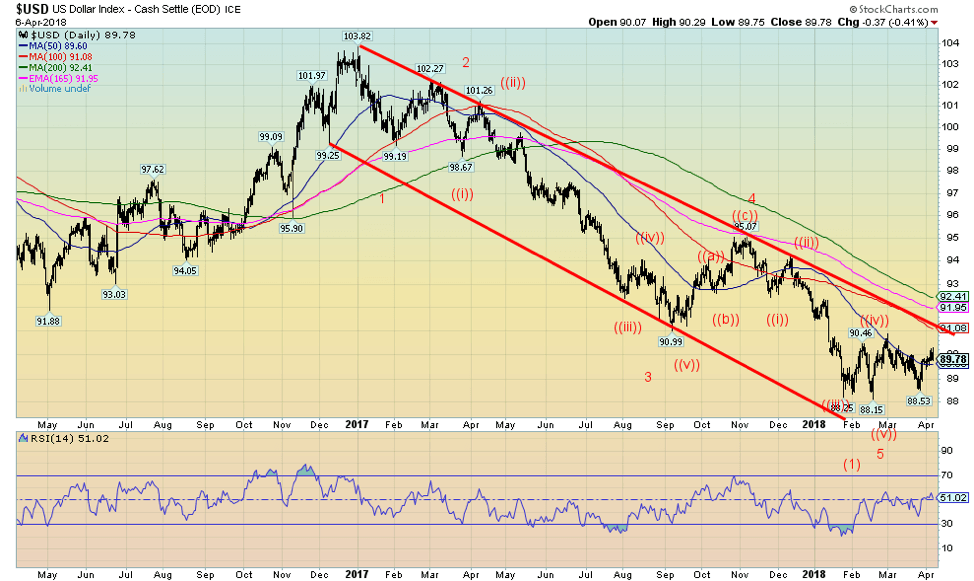
The action on the US$ Index remains ambiguous. This past week the US$ Index was essentially flat. It did, however, manage to close above the 50-day MA, suggesting that a move to the downtrend line and the 100-day MA near 91 could in play. There is an argument that the US$ Index completed a five-wave decline to the low at 88.15 and it has now begun what could be an upward move that could eventually test up to as high as 94/95. The strongest currency of the majors this past week was the Cdn$ up 1%. The Euro lost 0.2% and the Japanese Yen was off 0.4%, but the Pound Sterling gained 0.4%. The US$ Index has been largely in a trading range the past several weeks, largely between 88.50 and 90. A breakdown under 88.50 would most likely signal further declines ahead while a breakout over 90 and 90.50 would signal higher levels ahead. Trade wars are usually not positive for the US$ so that favours the downside. But if the U.S. is regarded as a safe haven from wars, etc. then the US$ could well rise. Indicators, especially the RSI, continue to hover around a neutral 50. Follow the break.
© David Chapman
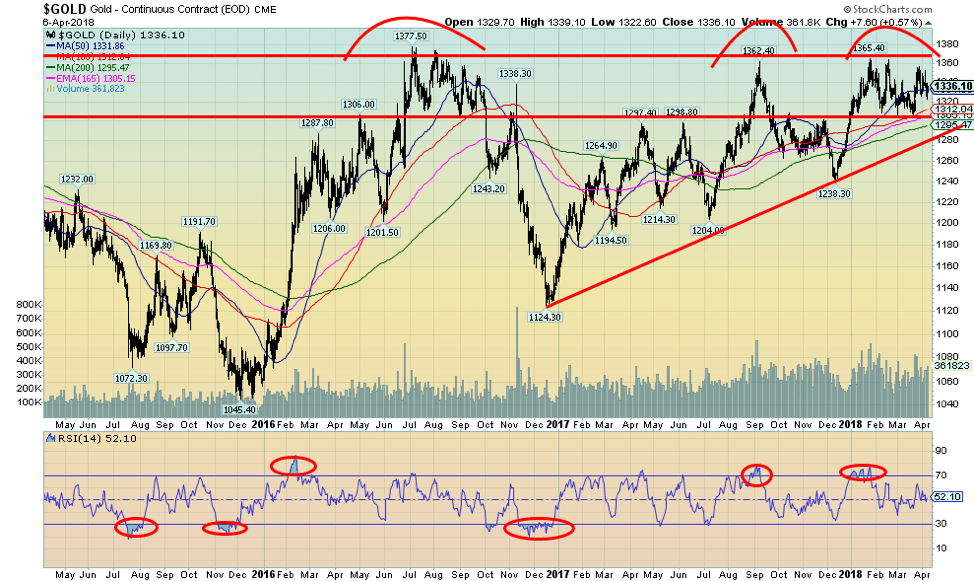
Trade wars off. Gold down. Trade wars on. Gold up. It is schizophrenic action and that just about sums up the action of gold over the past several weeks. Gold has traded as high $1,365 only to be followed by a decline and support that has materialized around $1,310. A breakdown under $1,310 could suggest a decline to at least trendline support near $1,280. Under $1,280 a breakdown could occur taking gold to $1,240 and even once again down to $1,200. We doubt this scenario but one cannot dismiss it until gold firmly takes out the major resistance that exists roughly between $1,350 to $1,375. Triple tops are extremely rare and a firm breakout above $1,350/$1,375 would see gold swiftly move to $1,400 and higher. Potential targets could be as high as $1,725. But, like silver, the best we can say about gold is that it is largely trendless right now. It makes it difficult to read. Sentiment doesn’t appear to be sufficiently bearish to suggest a low. The commercial COT is friendly for gold and very friendly for silver. Yet both languish. And others like platinum have fallen recently and looked somewhat bearish. Our best call remains that gold should eventually break out to the upside. The period into May/June can seasonally be friendly for gold. We remain optimistic but recognize that a bear move could also develop.
© David Chapman
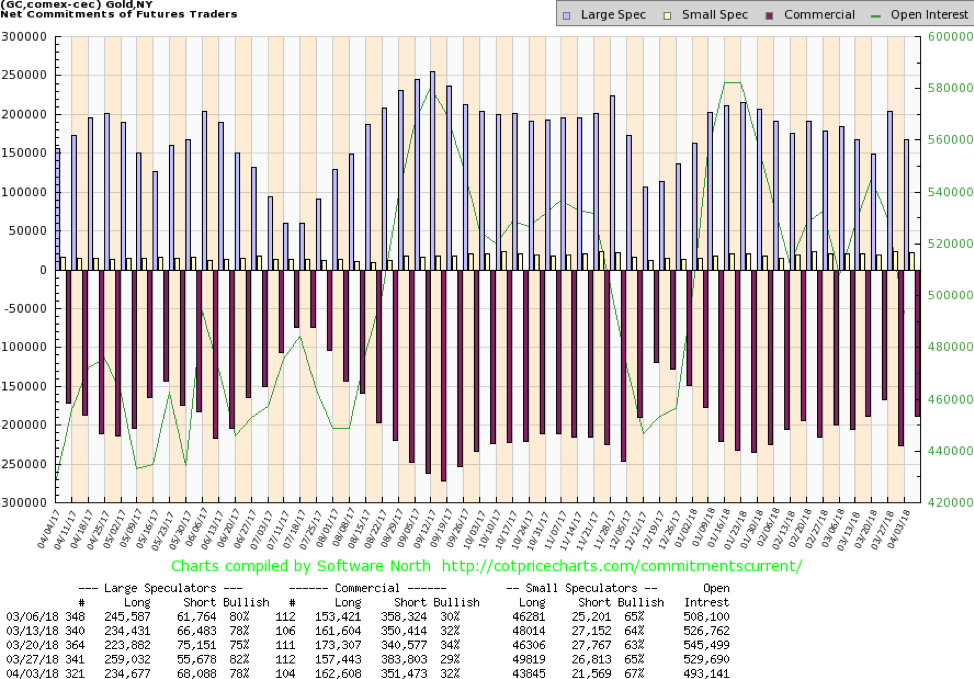
The gold commercial COT jumped this past week to 32% from 29% the previous week. That tells us the commercials were covering shorts on the recent plunge and this helps maintain our current bullish stance. Long open interest jumped roughly 5,000 contracts while short open interest fell over 22,000 contracts. No surprise that the large speculators’ COT (hedge funds, managed futures, etc.) fell to 78% from 82%. Long open interest dropped 25,000 contracts while short open interest jumped almost 13,000 contracts. The odds continue to favor the bulls here.
© David Chapman
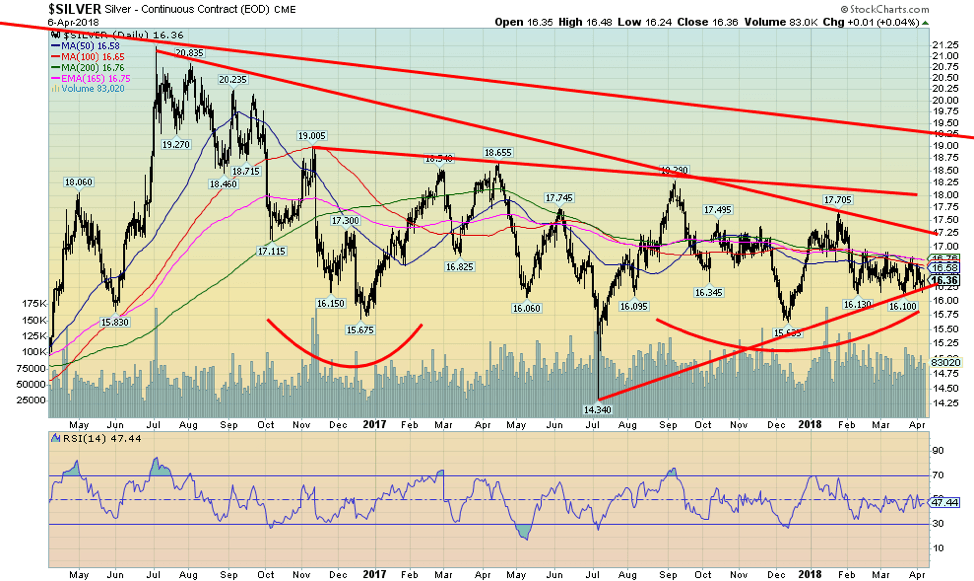
Despite a very favorable COT report silver prices continue to languish. The past several weeks have seen the silver trade in a band topped out around $16.70/$16.80 and bottomed out at $16.10/$16.15. It shouldn’t stay in this band forever. Unfortunately, the pattern is ambiguous and silver could break either way. We appear to be holding an uptrend line from the July 2016 low, but a break under $16.10 could see silver fall and test $15.65. The MAs are converging in the $16.65/$16.75 zone so a break above $16.80 could see silver run quickly towards $17.25 and the next good level of resistance. Further resistance is seen at $18 and then again at $19.25. Continued supply/demand deficits suggest that silver should break to the upside. The silver shortfall with regard to supply/demand is now some 16 years of production. The COT favors the upside. If a strong bull market does get underway for gold, silver should lead the way.
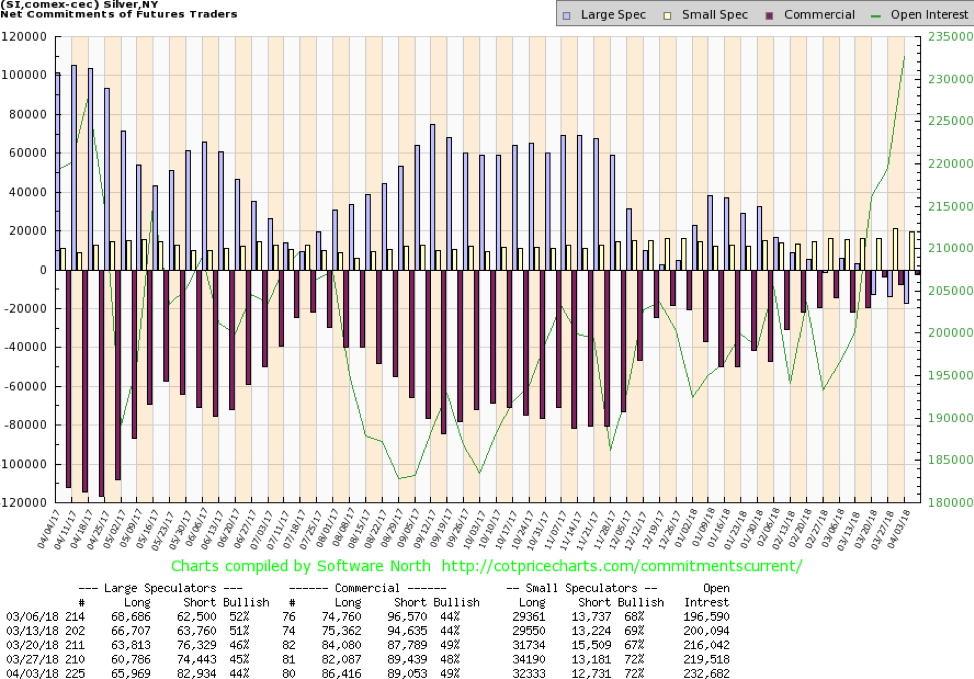
© David Chapman
The silver commercial COT was already at near record levels (at least for recently). This past week the silver commercial COT moved back to 49% from 48% as the longs added just over 4,000 contracts while holding short open interest relatively steady. The large speculators’ COT slipped to 44% from 45% even as they added roughly 5,000 long contracts but they also added over 8,000 short contracts. The large speculators continued to be in a net short position, something we have rarely if ever seen before. The silver COT remains quite bullish in favour of silver.
© David Chapman
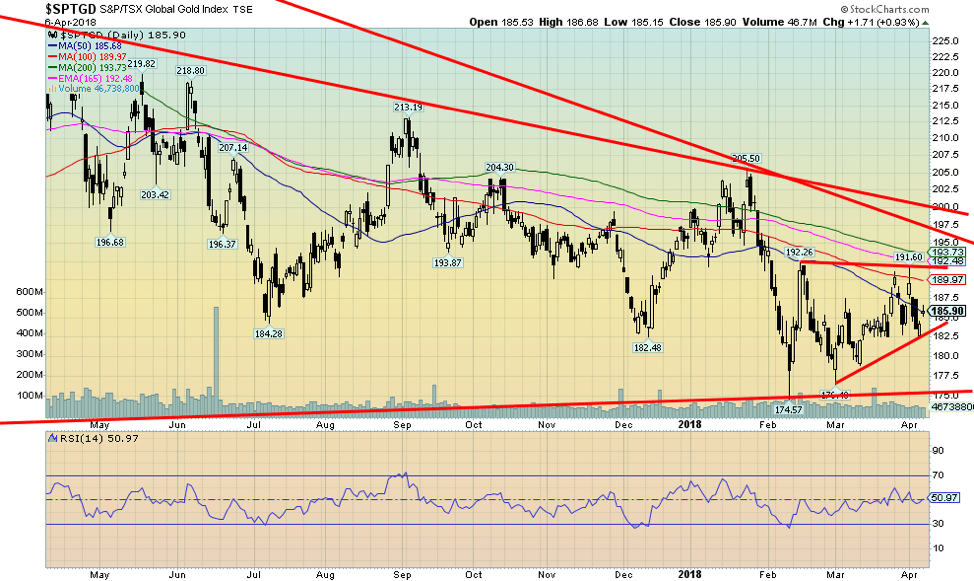
The gold stocks continue to frustrate. If there is any good news here it is that the gold stocks as measured here by the TSX Gold Index (TGD) appear to be making a small series of higher lows. Given a relatively flat top near 192 the pattern forming could be an ascending triangle. The TGD needs to break above 192 to project a possible move to 210. At 210 the TGD would also be taking out resistance visible at 197 and 200. The level 210 is the final band of resistance. A firm break above that level could see the TGD rise to 275. There appears to be good support down to 170/175. A break under 182 could well translate into another test of that support. Gold stocks need to lead and for what seems forever gold stocks have been lagging. The gold mining companies are highly leveraged to the price of the gold so a rise in gold prices should lead to a stronger rise in the price of the gold stocks. Some days they act like gold stocks and other days they act instead just like stocks such that if the stock market falls the gold stocks fall as well even if gold itself is up. The best we can say is that we are encouraged with appears to be a massive bottom pattern for the gold stocks as represented here by the TGD. The same can be said about the stocks of the Gold Bugs Index (HUI). The gold stocks that make up the TGD and HUI will lead the way but the big winners would come with junior gold miners and the exploration stocks. Admittedly they tend to lag. Continued patience is required even if it is frustrating.
Chart(s) of the week
© David Chapman
© David Chapman
© David Chapman
© David Chapman
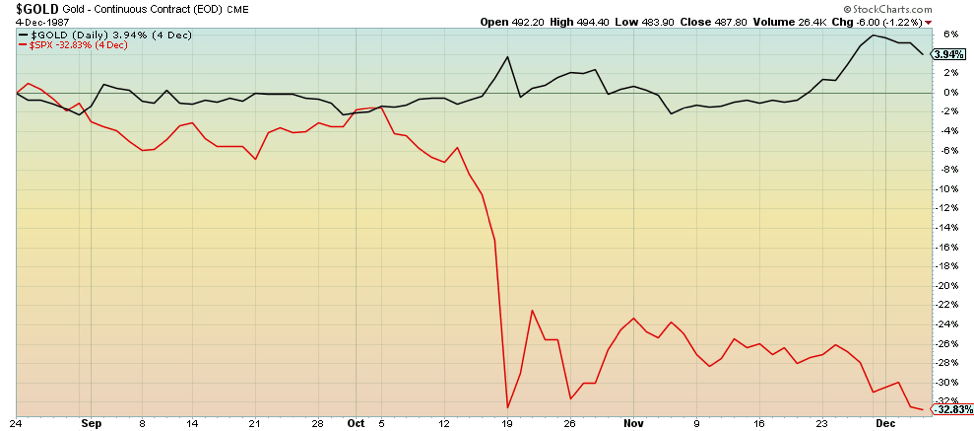
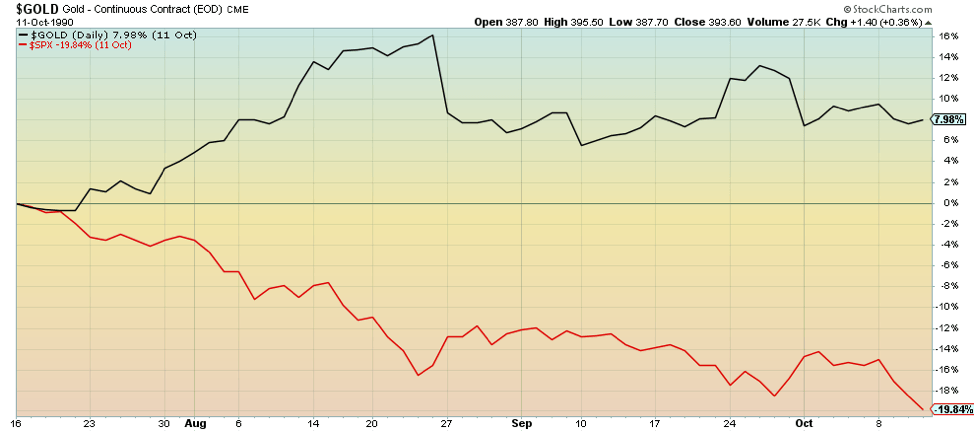
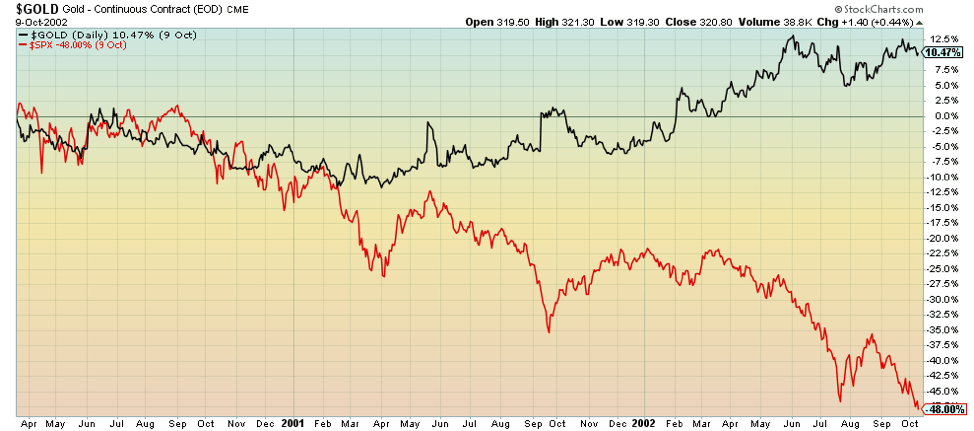
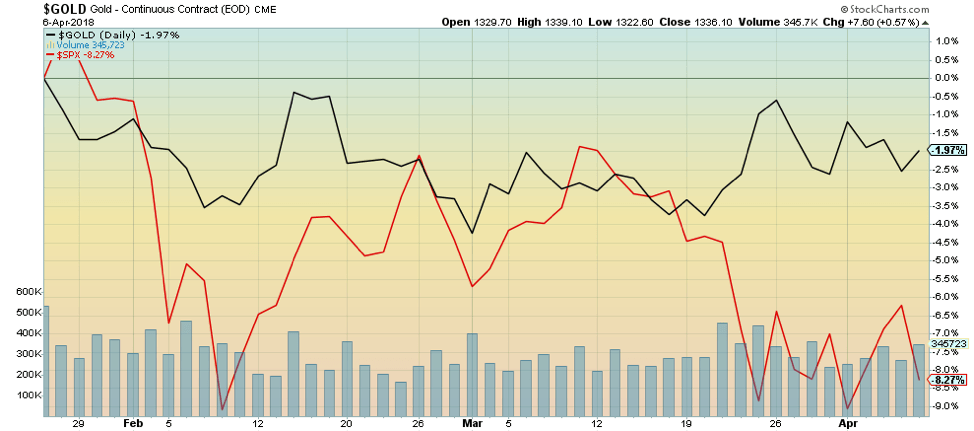
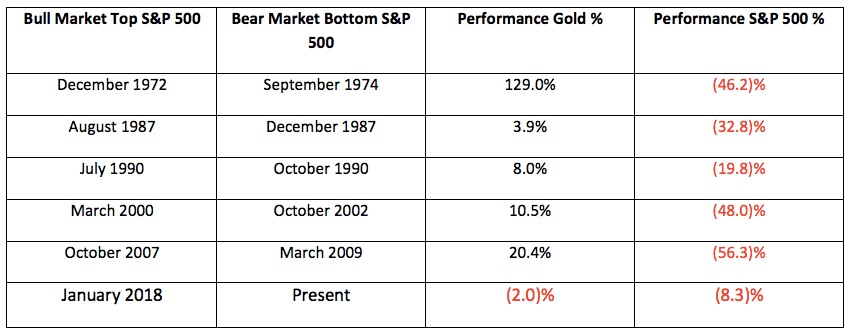
A question that has been asked was how gold performed vs. the stock market during bear markets. While the jury is out on the current market gold it is noted that gold performed admirably during previous bear markets. Note that the current market cannot yet be termed a bear market as U.S. stock markets are not yet down 20% or more, a level that traditionally defines a bear market. So far this is a correction but we have included it for comparison purposes. We also included the 1972–1974 bear market although we did not have a good chart. The data covers the bear market from the bull market top to the bear market bottom for the S&P 500. The performance only compares physical gold and the S&P 500. Gold stocks are not gold although their underlying business is gold. Gold stocks during a bear market tend to perform like stocks and not as gold. Owning gold stocks is not the same as owning physical gold.
Each of these charts starts at the top of the bull market and ends at the bottom of the bear market. Putting it on a table, one sees the following:
© David Chapman
During bear markets, gold has consistently outperformed the stock markets. Gold is a non-correlated asset to both stocks and bonds. It can act as a hedge during stressful markets. The jury is still out on the current market and, as we note, we are not officially in a bear market. Despite a negative performance from gold, the S&P 500 has been even weaker.
—
DISCLAIMER
David Chapman is not a registered advisory service and is not an exempt market dealer (EMD). We do not and cannot give individualized market advice. The information in this newsletter is intended only for informational and educational purposes. It should not be considered a solicitation of an offer or sale of any security. The reader assumes all risk when trading in securities and David Chapman advises consulting a licensed professional financial advisor before proceeding with any trade or idea presented in this newsletter. We share our ideas and opinions for informational and educational purposes only and expect the reader to perform due diligence before considering a position in any security. That includes consulting with your own licensed professional financial advisor.


El Dorado Raises $9M to Expand Cross-Border Fintech Platform
El Dorado, a Latin American fintech improving cross-border financial services, raised a $9 million Series A led by Paradigm with...


Bitcoin Stalls Near $60K as Strategy Moves, ETFs Outflow, and EU MiCA Rules Take Effect
Bitcoin hovers near $60,000 with ETF outflows, while Strategy boosts reserves, sells BTC, and raises dividends to reassure investors. Ethereum...


Cannabis Dominates Global Drug Use: Trends, Risks, and Shifting Markets
Cannabis remains the world’s most widely used illicit drug, with 256 million users in 2024, surpassing all others combined. Growth...


Italy Approves First Hydrogen-Powered Train for National Rail Network
ANSFISA has approved Italy’s first hydrogen-powered train, the Alstom HMU214, for use on the Brescia–Iseo–Edolo line. Capable of 140 km/h,...


Cotton Market Weakness Persists Despite Brief Rebound
Cotton prices fell to new lows last week before a modest rebound. USDA data shows crop conditions remain worse than...
 |
|
 |  |
 |
|
-

 Cannabis1 week ago
Trulieve NYSE Listing Signals New Era for Global Cannabis Industry
-

 Africa2 weeks ago
Remote Work Reshapes Sales Management: Key Lessons for Moroccan Leaders
-

 Biotech6 days ago
Gilead HSV Plan Could Transform Market Outlook
-

 Crypto2 weeks ago
Crypto Market Stays Stable as Bitcoin and Ethereum See Mild Declines
You must be logged in to post a comment Login