Featured
Gold tumbles amid signs of a slowdown in the economy
In the past week, U.S. stock markets almost broke out to new highs and gold tanked all because of the news that the U.S. and China will discuss and see if they can end their trade impasse. There are continued signs that the global economy is slowly sliding downward. The U.S. August job numbers didn’t help but Canada reported gangbuster job numbers and the BofC held off on any interest rate cuts.

No way out. That’s how we see things as we prepare to enter the fall of 2019. It’s a never-ending spin—Brexit, trade wars, Hong Kong, devastating storms, polarized politics, and more. One has to feel for the people of Grand Bahamas, Abaco Islands as they endured 40 hours of deadly Hurricane Dorian, hoped they would survive, and, then crawled out to complete devastation: their home gone, many killed, and no food. All they can do is wait. It’s been like a bad movie, whether it is hurricanes, earthquakes, tsunamis, wildfires, or floods.
But amidst the carnage of Hurricane Dorian, strange things happen. Stock markets don’t care about hurricanes but they do care about trade wars. So, when it is announced that U.S.-China trade talks will resume next month, then suddenly everyone thinks that a deal is imminent. Given past events, maybe not. It is one tweet away from “tanking” once again. But that didn’t stop the stock market this time as “risk” was back on and the market soared and gold tanked.
And what about the Fed? Well, the Fed chatter is that they’ll cut interest rates a quarter-point at the September 17–18 meeting. The market also leaves open a small possibility that the Fed will do nothing. But for those expecting a half-point cut, that doesn’t seem to be in the cards. The Fed isn’t getting a lot of help, however, as the Bank of Canada held interest rates steady at their recent meeting, citing the strength of the Canadian economy despite their concerns over trade wars. Maybe the BofC is right, as on Friday the jobs report showed that Canada created 81,100 jobs in August, albeit many of them part-time. They only expected 10,000 jobs. The unemployment rate was steady at 5.7%.
There are many who believe or want the Fed to be more aggressive in its rate-cutting and even bring back quantitative easing (QE). None has been so vociferous on this then the tweets of President Trump. We suspect it will eventually happen eventually but not yet. Slashing interest rates and bringing back QE could be negative for the U.S. dollar but positive for gold and the stock market. But oddly it might be negative for bonds.
The Peoples Bank of China (PBOC) cut the reserve ratio to its lowest level since 2007. The cuts are designed to release $126 billion of liquidity into the banking system. That’s the third cut in 2019. Much of China’s banking system is becoming “zombie banks” laden with bad loans, particularly in the real estate sector. China’s recent manufacturing purchasing manager’s index (PMI) rose to 50.4 in August, up from 49.9 in July. Readings above 50 suggest the economy is expanding. Below 50, contracting.
Jobs report: A slow economy?
As to America’s economy, the August jobs report was a disappointment. The nonfarm payrolls came in below expectations at 130,000, although the official U3 unemployment rate held steady at 3.7%. The poor nonfarm was despite a boost from census hiring that apparently added at least 25,000 jobs. Census jobs like many of the jobs created are part-time or temporary. The Bureau of Labour Statistics (BLS) broadest unemployment measurement U6 rose to 7.2% from 7.0% and Shadow Stats unemployment jumped to 21.2% from 21.0%. Maybe they reacted to the jump in the Labour Force Participation rate to 63.2% from 63.0%. More people looking translates into a higher unemployment rate. But overall the rise in the U6 and Shadow Stats unemployment is a more a sign of growing employment weakness than it is of strength in the economy.
Encouragement also came from the August Manufacturing PMI, rising to 50.3 from the preliminary 49.9 and July’s 50.4. Better still. the non-manufacturing PMI jumped to 56.4 for August from 53.7. That buoyed thoughts of continued consumer spending. Consumer spending is, however, a lagging indicator. The most recent consumer confidence index showed a sharp drop. Consumers read and they are increasingly concerned about Trump’s trade wars. The trade wars are having an impact and it is not just China that is paying.
What’s happening to the economy?
So how did the markets respond? Well, the big rally on Thursday softened following the jobs numbers, while gold rebounded slightly from Thursday’s pummeling. The more things change, the more things stay the same.
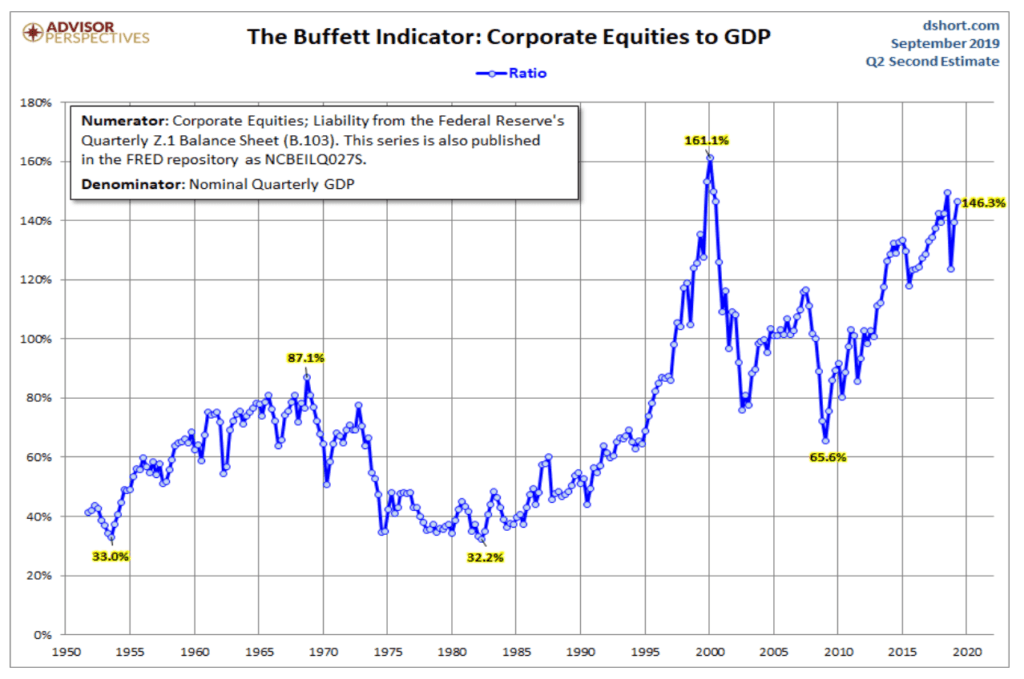
Well maybe not. The stock market cap to GDP long-term valuation indicator, also known as the Buffett Indicator, rose to 146.3% based on Q2 GDP and August data. That’s up from 139.5% the previous quarter. The indicator peaked in 2000 at 161.1% with the top in the dot.com/high-tech bubble. It also surpasses the peak in 2007, the height of the housing bubble and before the sub-prime crisis brought the market crashing down in 2008. Another measurement, using instead the Wilshire 5000, shows the indicator is at 139.3% which is higher than the 136.9% seen in 2000 but slightly below the peak thus far seen in 2015. By these measurements, the stock market is not cheap. Does it signal an imminent collapse? Well, no. But it does suggest that one should be very cautious buying at these levels even as the NYSE advance-decline line keeps rising into record territory.
Bond yields
Bond yields backed up this past week after hitting a three-year low at 1.47%. The trade talks helped the stock markets but sent the bond prices (prices move inversely to yields) lower. The soft job numbers on Friday helped stem the backup in yields. A deluge of corporate bond issues, including Apple and Disney, didn’t help as more product tends to drive yields higher. But what should be a concern is that the yield on U.S. 10-year Treasury notes at 1.55% is quite a bit lower than the dividend yield on the S&P 500 at 1.94%. That helps to drive funds into higher-risk stocks.
Adding to bond woes, we have noted that negative yield bonds, primarily in the EU and Japan, now total roughly $17 trillion, including at least $1.2 trillion of negative yield corporate bonds. That has helped push funds into U.S. Treasuries seeking higher yields and, of course, helps push funds into the stock markets also seeking yield and higher returns through growth. But many funds, particularly pension funds and insurance companies, have to buy bonds.
Negative yields are not new. The Swiss tried it to disastrous results way back in the 1970s. They were trying to prevent a sharp rise in the value of Swiss franc. The Swiss franc was seen as a safe haven following the end of the Bretton Woods gold standard in 1971 and as the world was pushed into floating currencies centered around the U.S. dollar. The U.S. dollar was overvalued and started a sharp fall with one of the main beneficiaries being the Swiss franc. Funds flowed into Switzerland. The result was that the steep rise in the value of Swiss franc hurt Swiss exporters and Switzerland fell into a steep recession.
US dollar remains high
That didn’t stop the flow of funds into Switzerland so the Swiss doubled down and even increased during the oil crisis of 1973. Besides a recession, the country was hit by strikes and foreign workers were expelled to try and help stem the recession and strikes. But the finance sector soared. Only when the Swiss National Bank (SNB) focused exclusively on the exchange rate and not on inflation concerns did things begin to shift. The negative rate experiment didn’t end until around 1982 when the U.S. began to turn the corner on its high inflation rate. It took Switzerland years to recover from the debacle.
The U.S. dollar has remained high and that is not helping U.S. exporters which is Trump’s main aim with his trade wars. Could the U.S. resort to negative interest rates? Former Fed Chair Alan Greenspan seems to think so. Historically, interest rates have never been this low. Not even during the Great Depression. But with $74.1 trillion of U.S. debt outstanding (government, corporations, consumers) and over $250 trillion of debt outstanding globally, the world can ill-afford a rise in interest rates. Even a rise to a reasonable 5%, a level that prevailed through much of the 19th century would be disastrous in today’s markets.
Historical financial crises
But a reminder that throughout history there have been financial crises and each time experts have claimed that “this time is different.” The only thing that is different is what brought the world to the brink of collapse. The history of financial crises is the history of debt collapse and the story plays itself out time and time again. Since the end of Bretton Woods in 1971, the world has seen several financial crises: 1974–1975, 1980–1982, 1990, 1998, 2000–2002 and 2007–2009.
Each crisis has been worse than the previous one and each one was bailed out with sharply increased liquidity from the central banks through direct injections, interest rate cuts, and a massive increase in debt from all, governments, corporations and consumers. Since 1971, U.S. GDP has increased by $14 trillion but total U.S. debt (government, corporations, consumers) has increased by $70.4 trillion. That suggests that it took over $5 of debt to purchase $1 of GDP. Is that sustainable? We live in a world of debt illusion even as liquidity injections and more debt have bailed us out every time and prevented a steeper economic decline.
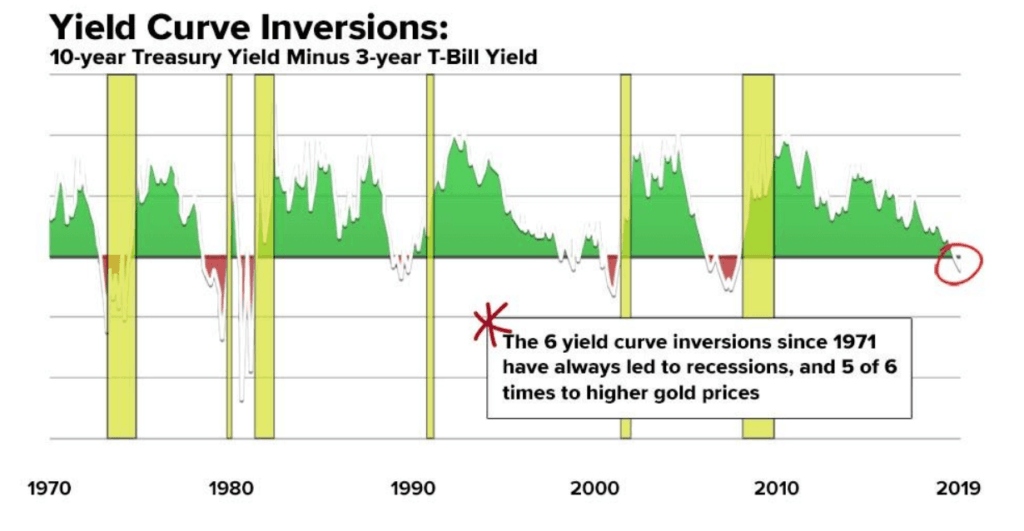
We have noted the inversion of the yield curve. It is a warning. It does not necessarily translate into recession as the lag can be anywhere from 7 months to 19 months with 14 months as an average. But an inverted yield curve has predicted every recession since 1971. An inverted yield curve has also seen gold prices rise five out of the six times the yield curve inverted. On average the price of gold doubled every time the yield curve inverted. On that basis, a rise to $2,500–$3,000 could happen by 2020. That is not a guarantee it will happen, but if history does repeat itself then some time into 2020 gold will rise and a recession could get underway. Since May when the 10-year—3-month spread went negative gold is up 17% and at its recent peak gold was up 21%.
No sign of recession for global economy
Globally, there is still no sign of a recession despite various areas of weakness: in China where there are some indications that their GDP could fall under 6%, in the EU, particularly Germany, the largest economy to record negative growth in the last quarter, in the United Kingdom as it gets torn apart by Brexit, and slowing signs in the U.S. Fed Chair Jerome Powell correctly pointed out that the most likely course for the time being at least is moderate growth both for the U.S. and the world.
This came despite the weaker job numbers reported for August. Powell did note “significant risks” that could threaten growth, particularly the trade dispute between the U.S. and China, which is really a dispute for power between the two global powers. That story has been played out many times in the past. Think Britain and France in the 18th century or Germany and Britain in the late 19th early 20th century. Both ended in global wars.
Stock markets around the world
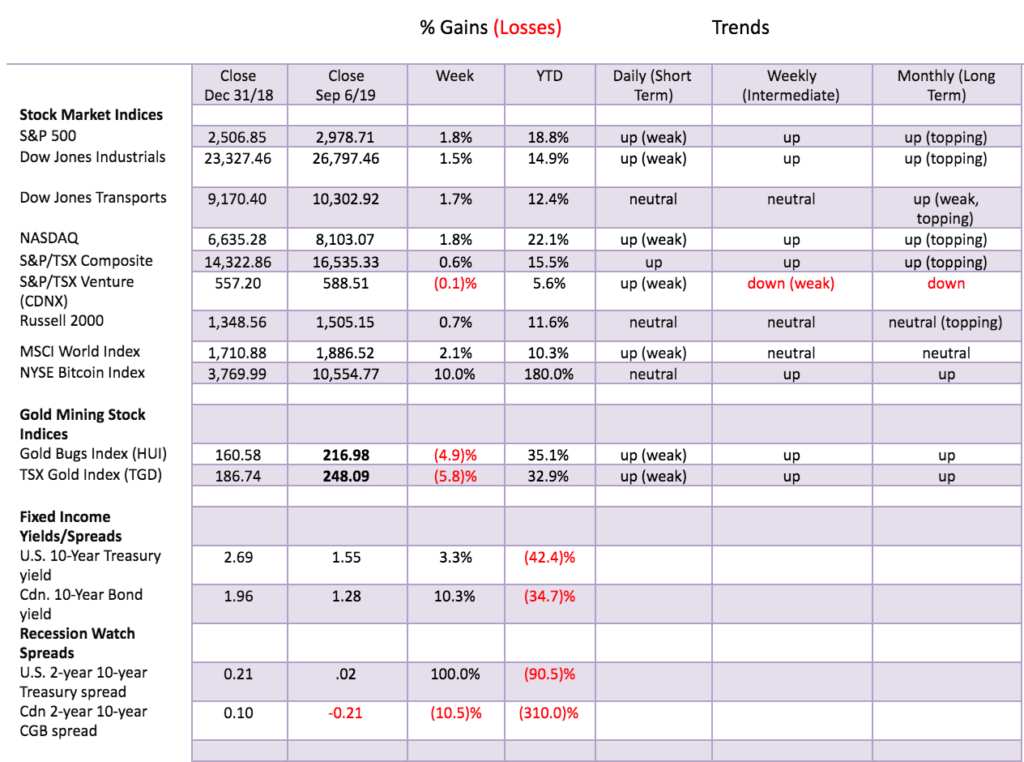
Stock markets closed higher this past week in the U.S., in the EU, and especially in Asia where China’s Shanghai Index (SSEC) gained 3.9% and the Tokyo Nikkei Dow (TKN) was up 3.6%. The S&P 500 was up 1.8%, the Dow Jones Industrials (DJI) gained 1.5%, the Dow Jones Transportations (DJT) was up 1.7%, and the NASDAQ jumped 1.8%. Canada’s TSX Composite gained 0.6% and is poised to either break out or fail at current levels. The TSX Venture Exchange (CDNX) lost a small 0.1%. The London FTSE gained 0.8%, the Paris CAC 40 2.0%, and the German DAX was also up 2.0%.
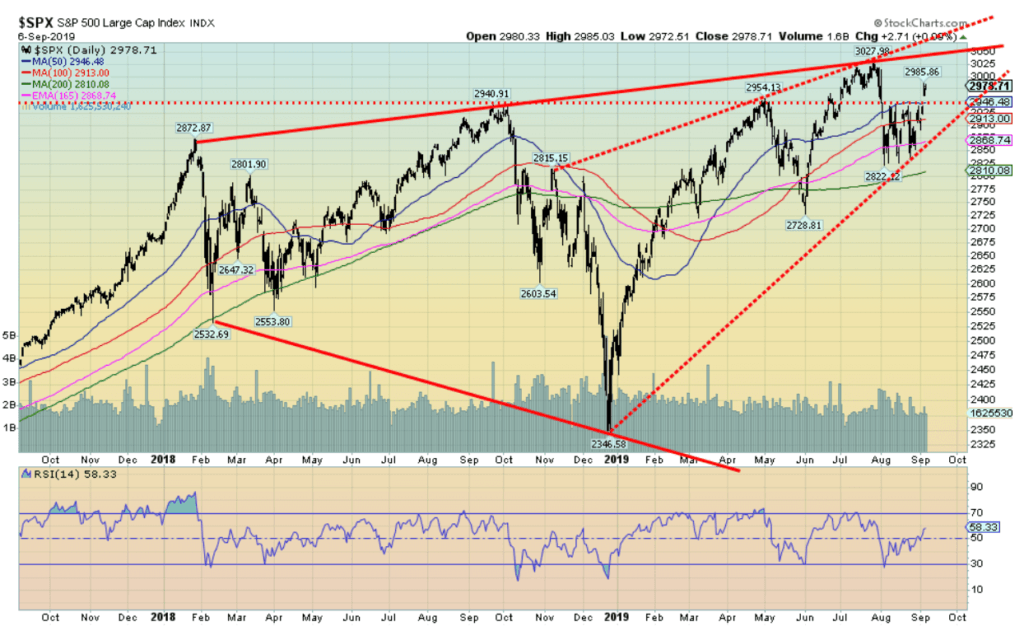
The S&P 500 appears to have broken out this past week. The S&P 500 has now re-traced the Fibonacci 78.6% level of the recent decline. This is a make or break level. A firm move through 3,000 would suggest a move once again to the top of the channel near 3,050. Or the index could break above 3,050 to the top of what appears as an ascending wedge triangle near 3,150. This would get the bulls very excited. Volume has been poor and there are numerous negative divergences across all time frames daily, weekly, and monthly.
Odds favor a failure and a collapse to the bottom of what we have been calling a broadening pattern. The bottom of the channel is near 2,200. Our expectations are that this could play out with a bottom into year-end or January. While it is always possible that the more bullish scenario plays out, there are just too many negative signs of which the most volatile is the trade dispute and a president’s penchant for tweets that change the game on a whim.
Gold and silver amid weak signs in economy
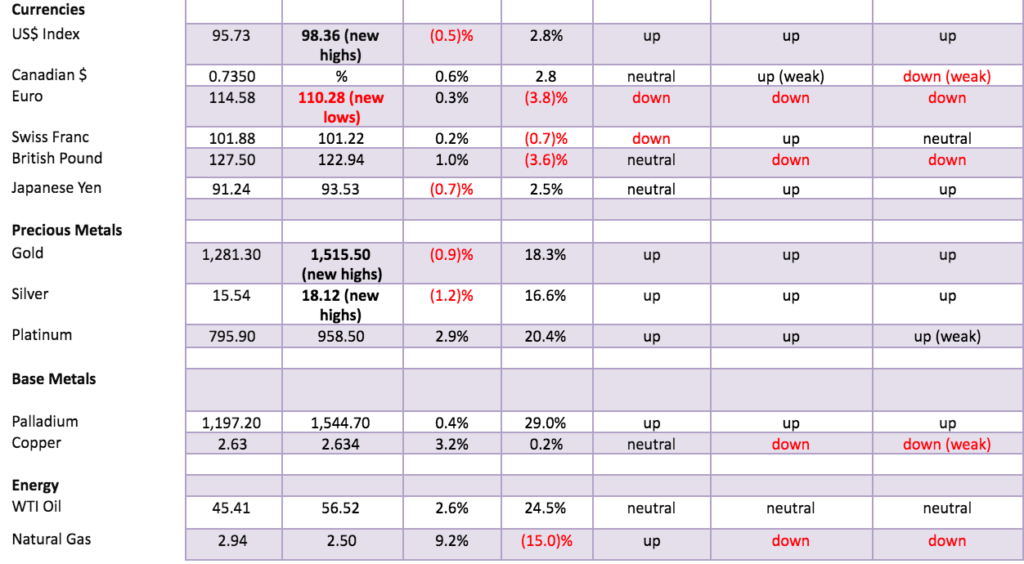
Gold and silver put in a reversal week. Both made new 52-week highs, then reversed and closed lower. Silver especially looked bad plunging 8% from its top in only a few days. Gold fell on the week by 0.9% and silver was off 1.2%. Platinum, however, gained 2.9%, diverging with gold and silver. Palladium was up 0.4%. The gold stocks took it on the ear as the TSX Gold Index (TGD) fell 5.8% and the Gold Bugs Index (HUI) was down 4.9%.
The hit on the gold stocks was largely limited to the producers that had been leading the market up. Gold and silver reacted negatively to the news that the trade talks were back on. However, the drop on Friday was odd considering the weaker than expected job numbers, the expectations of a Fed rate cut of a quarter-point at the September 17–18 FOMC, and ongoing signs of weakness for the global economy.
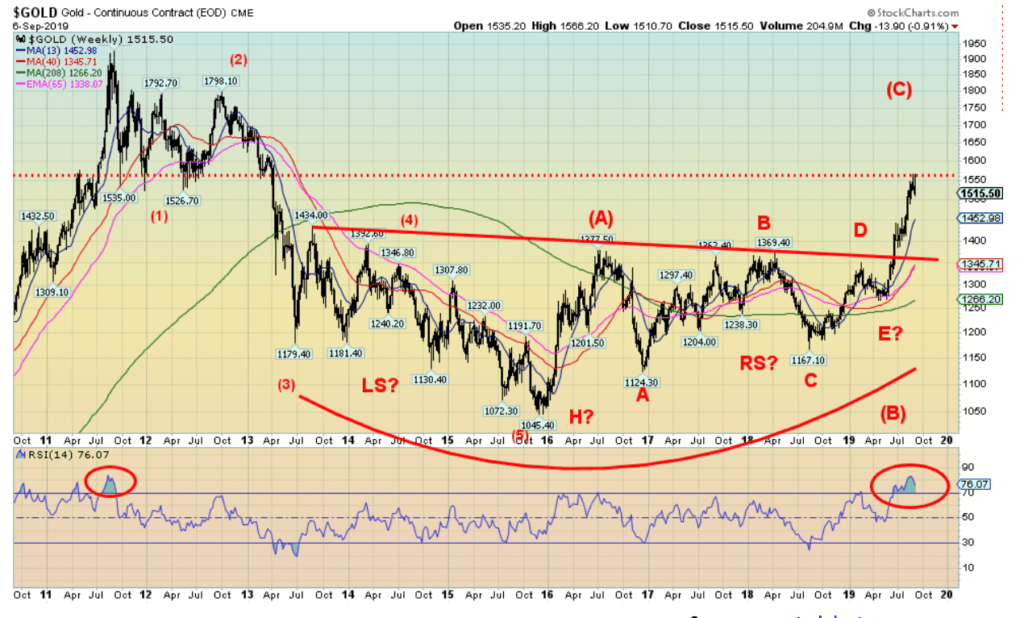
Our long-term weekly chart of gold shows that gold has reached up into the major resistance zone of $1,525–$1,600. The high on the week was $1,566 short of possible targets up to $1,590. It was not essential that the target is hit. However, the negative reaction was a surprise to many. Although it shouldn’t have been. The commercial COT this past week fell to 23% from 24%. The commercials held a record short position offsetting a record long position held by the large speculators. The sentiment indicators had soared over 90%. In other words, a correction is needed and was expected just not as dramatic as it happened. As gold falls we would expect the commercial COT to improve.
The correction could last into November and the nature of this correction should determine how the next move plays itself out. A normal Fibonacci 38.2% correction would take gold down to around $1,420 a 10% correction. From 2008 to 2011 gold went through two 10–15% corrections as it rose from $680 to over $1,900. Support is currently here near $1,500, but below that level, a confirmed top would be in. Below $1,500 support is seen at $1,480 and $1,450.
Silver spiked to $19.75 before reversing, losing 8% from the top. Silver has currently fallen to support near $18. But a firm break under $18 could draw silver towards better support near $17.50. If that level were to break, silver could fall further to the $16.50 to $16.75 level.
What happens next?
Much depends on the U.S. dollar. While gold has been rallying even as the U.S. dollar rallies, further rallies in the U.S. dollar could hurt gold. There remain some potential targets for the US$ Index up to 100.25/100.50. The high this past week was at 99.33 before the US$ Index reversed. If the Fed does not cut rates on September 17–18, that would be positive for the U.S. dollar and negative for gold.
Also, a negative for gold is the potential for interest rates to rise. The U.S. 10-year Treasury note jumped to 1.55% after hitting a low the previous week at 1.47%. The 30-year U.S. Treasury bond went back over 2%. The 10-year—2-year spread closed at +2 bp while the 10-year—3-month T-Bill spread closed at negative 41 bp, a slight improvement over the previous week. The spreads are still signaling an impending recession but it could be well into 2020 before one becomes visible based on past experience. Interest rates could rise just because there has been so much product issued and the ability to absorb it all becomes a problem for the market.
The bond market has become extremely bullish with unheard-of bullish sentiment readings. That is usually a danger sign. The bond market is extremely overbought. But with the U.S. government running $1 trillion deficits and mounting, the competition for funds is going to be fierce. Rising interest rates could be a death knell for the corporate bond market, especially with so many rated just above junk. Debt could still become the Achilles heel of the global economy. And history is littered with financial collapses that are really all about debt collapse.
Markets and trends
©David Chapman
(Featured image by DepositPhotos)
—
DISCLAIMER: David Chapman is not a registered advisory service and is not an exempt market dealer (EMD). We do not and cannot give individualized market advice. The information in this article is intended only for informational and educational purposes. It should not be considered a solicitation of an offer or sale of any security. The reader assumes all risk when trading in securities and David Chapman advises consulting a licensed professional financial advisor before proceeding with any trade or idea presented in this article. We share our ideas and opinions for informational and educational purposes only and expect the reader to perform due diligence before considering a position in any security. That includes consulting with your own licensed professional financial advisor.


Advances in Biomarkers and Targeted Therapies Transform Kidney Care in Autoimmune Disease
New biomarkers and targeted therapies are reshaping the management of kidney damage in autoimmune diseases like lupus and vasculitis. Experts...


Bitcoin Rises on Iran Deal as Crypto Markets React to AI and SpaceX News
Bitcoin rose above $65,000, gaining about 5% as a tentative Iran war agreement boosted markets. ETFs still show weekly outflows....

Rising Inflation, Fed Uncertainty, and Market Excess Amid War and SpaceX Mania
Rising inflation, driven by war, debt, and money growth, puts the Fed in a difficult position ahead of its meeting....


SpaceX IPO Sparks Déjà Vu as Market Risks Loom and Gold Bulls Stay Hopeful
The author compares the 2000 AOL Time Warner merger to SpaceX’s planned IPO, warning it may signal a market top....


The TopRanked.io Guide to 2026’s Biggest and Best Affiliate Opportunities
Want to earn affiliate commissions on literal billions of dollars worth of revenue? Then this week, we've got something special...
 |
|
 |  |
 |
|
-

 Crowdfunding2 weeks ago
Prestadero Sees Rising Female Loan Participation in Mexico
-
 Business4 days ago
The TopRanked.io Guide to 2026’s Biggest and Best Affiliate Opportunities
-
Business2 weeks ago
TopRanked.io Weekly Affiliate Digest: What’s Hot in Affiliate Marketing [+ The Best Affiliate Program Directory on the Internet]
-
 Crowdfunding2 weeks ago
Spain’s Crowdfunding Sector Surges as Real Estate and SME Financing Expand