Featured
Gold’s 15 Count: How Low Can it go Next Week?
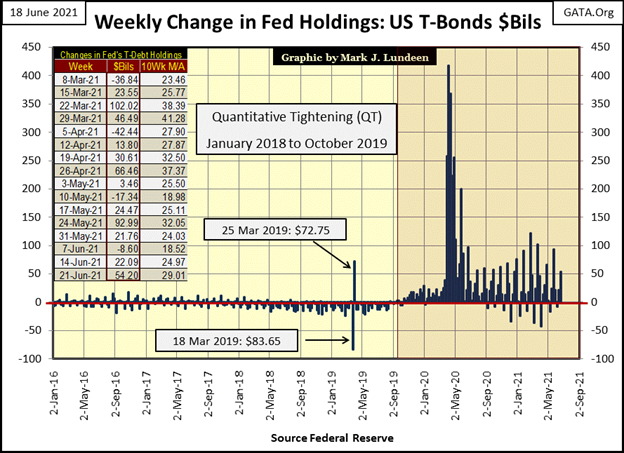
This week, the FOMC has “injected” an additional $54.20 billion dollars of “liquidity” into the financial system. This is far from the plus $400 billion they “injected” into the financial markets in a single week April 2020 to reflate market valuations. But come the next crisis, expect the pending Not QE#5 to exceed the extremes seen in their Not QE#4 seen below.

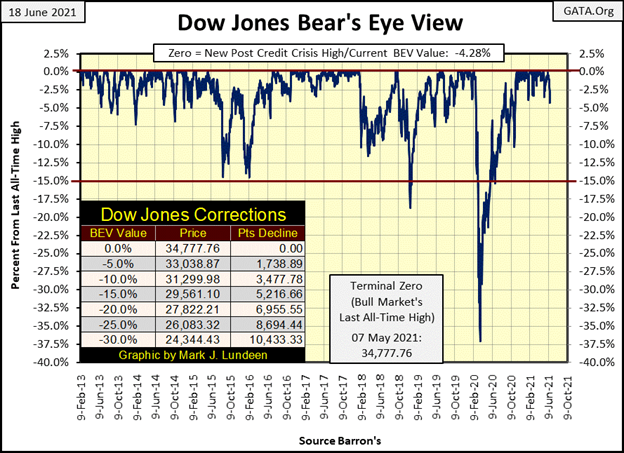
This week the Dow Jones closed with a BEV Value of -4.28%. It hasn’t seen a BEV value this low since November 4th when it last closed outside of scoring position with a BEV Value of -5.77%. That’s over seven months ago. Seven months in the market can be a long time. So, I have to ask myself; is this long time of inflating market valuations over, and if it is, what’s to follow it?
Next is my major market indexes BEV Values Table. The story for this week was one of progressing market weakness.
- Monday saw seven of these indexes close at new all-time highs, with everything else, except for the XAU in scoring position (less than 5% from a BEV Zero).
- Tuesday and Wednesday didn’t see any new all-time highs, but again everything, except for the XAU, remained in scoring position.
- Thursday saw two new BEV Zeros. But indexes #15 – 20 closed out of scoring position; or greater than 4.99% from their last all-time highs.
- Friday saw no new all-time highs, and only eleven of the twenty indexes closed the week in scoring position.
After reviewing all that, it’s obvious deflationary pressures were growing this past week. But there is no promise this deflationary trend will continue in the weeks to come.
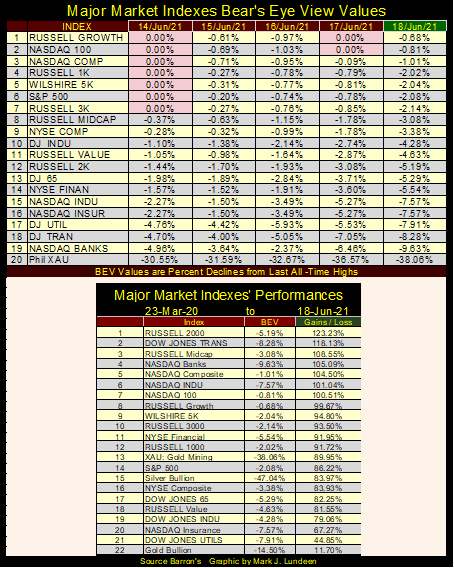
One thing that’s worrisome is seeing these major market indexes in the table above, from #1 down to #21, maintaining their oversized advances off their lows of March 2020. All such oversized gains eventually see corrections; big percentage claw backs to Mr Bear. And so far, these indexes have yet to see such a significant correction for the past fifteen months.
The possible exception to this would be XAU at #13 and silver at #15, as they haven’t done much for investors for decades. The people holding these assets are for the most part true believers; investors playing the long game who won’t panic at the first whiff of grapeshot.
Gold at #22, with its fifteen-month advance of only 11.70%, with a 14.50% current claw back from its last all-time highs of last August, is least subject to a big market correction. But the first seven in the above list, with their triple-digit percentage gains, following a fifteen-month, uncorrected advance are low hanging fruit for Mr Bear when he comes back, which one day he most certainly will.
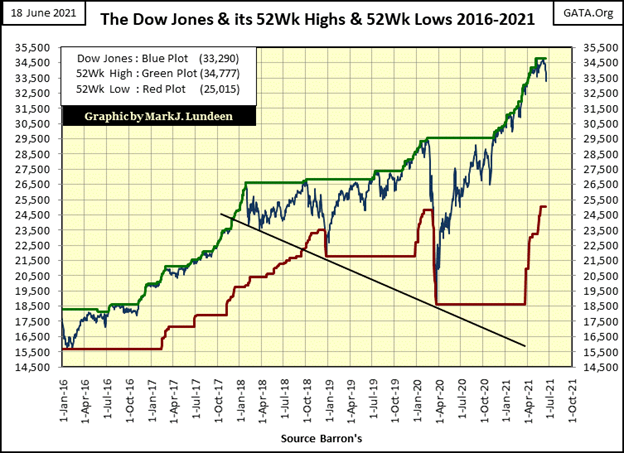
Let’s look at the Dow Jones plotted with its 52Wk High and Low lines below. At this week’s close the Dow Jones hasn’t deflated far from its last all-time highs of early May of this year. But looking at the BIG PICTURE, from its so far uncorrected advance from its lows of March 2020, my concern is that it’s a long way down to its red 52Wk Low line. And once there, what’s stopping the Dow Jones from once again pushing its 52Wk Line further down?
The FOMC and their “injections of liquidity?” That’s a trick that one day won’t work.
So, looking at the charts and tables above, should I be bullish or bearish? A good case can be made for both. That is, until I looked at the chart below plotting the Dow Jones in daily bars.
Two weeks ago on Friday June 4th, the Dow Jones closed just $22 from making a new all-time high. Two weeks later; today, the Dow Jones closed $1,487 from its last all-time high, and look at how it lost those points.
Beginning last week, a very bearish inverted bowl technical formation could be seen early in its formation (Red Curve). Then this week, the Dow Jones began a deflationary collapse from this inverted bowl (inside Black Oval). This is one ugly chart!
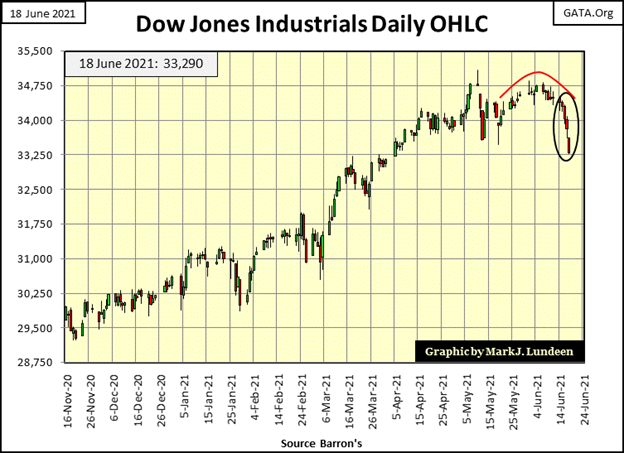
There is no guarantee Mr Bear is going to claw back much of the Dow Jones’ gains from its March 2020 bottom any time soon. Maybe the worst of this market decline was accomplished at the close of this week, and next week we’ll see the Dow Jones once again inflating towards a new all-time high.
But, I keep looking at the collapse from the inverted bowl in the chart above, and I get this feeling of Deja-vu all over again. If the Dow Jones begins seeing a series of days of extreme market volatility (Dow Jones 2% days) in the weeks to come, or worse; Dow Jones 2% days with NYSE days of extreme market breadth (70% A-D days), I’d get the hell out of Dodge City as fast as I could.
Gold and silver got whacked this week, as recorded in the Kitco.Com charts below. But these plots are COMEX prices, markets where most of the metal traded are only bad-faith promises to deliver bullion that doesn’t exist sometime in an increasingly uncertain future.
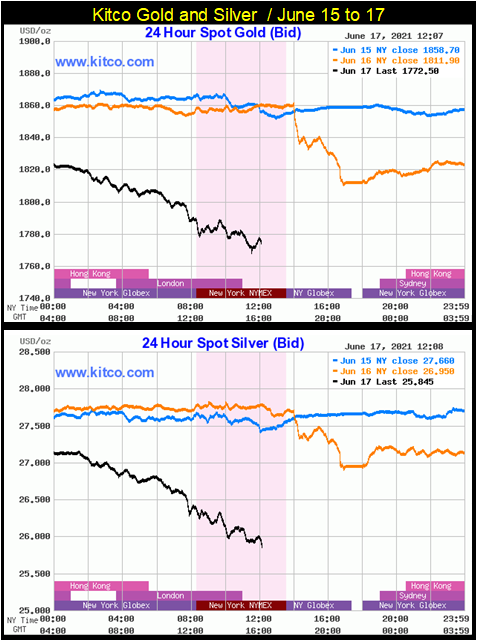
I was looking at silver eagle and silver round prices on Monday night from internet coin dealers who sell actual precious metal to the public. Single silver eagles were available for delivery for over $40, and 1oz silver rounds for a bit more than $30. On Thursday night, following the crash seen above, silver eagle and round prices seen on the internet were almost unchanged from where I saw them on Monday.
What does that tell you? It tells me the COMEX is becoming increasingly irrelevant in the precious metals markets where delivery of metal is actually demanded, as with internet coin dealers selling to the public.
Sorry, but I didn’t check prices for gold eagles. I suspect prices for gold eagles were also not impacted by Thursday’s crash in Kitco’s gold prices seen above.
Still, the prices for Kitco gold and silver are struggling. What’s with that? As I’ve said before; the “market regulators” allow the precious-metal bears to cheat in their “regulated” markets. This isn’t going to change until the system comes to a crisis, as today’s “market regulator” is tomorrow’s Wall Street banker, and today’s Wall Street banker is tomorrows “market regulator.” That’s the system; regulatory capture, and those inside this corrupt system like it this way.
For years, internet-market commentors have complained the naked shorting at the COMEX gold and silver futures markets is done at the behest of governments. When one realizes all US Treasury Secretaries have close ties to Wall Street, it’s best not to doubt that. Our current Treasury Secretary; Janet Yellen, primarily has an academic background. But academia is a direct beneficiary of the Federal Reserve System via its school loan program, and massive research funding to universities by the Federal Government itself.
As former Chairperson of the Federal Reserve, Yellen knows exactly how this system works, and isn’t going to change things to benefit the “gold bugs” at the expense of UC Berkeley.
Janet Yellen | U.S. Department of the Treasury
But the suppressed price of gold and silver, like inflated valuations in the stock market, will one day break free from this corrupt system of price fixing, as it must.
Below is a chart plotting dollars-in-circulation (CinC / Blue Plot) along with the US Treasury’s gold reserves (Red Plot) from 1925 to 2021. Looking at this chart’s insert:
- From 1925 to the early 1930s, dollars printed on paper and dollars in gold that backed those paper dollars were closely correlated. This is what a gold standard looks like; the paper dollars are backed by gold dollars.
- With Adolf Hitler’s appointment as Germany’s Chancellor on 30 January 1933, European central bank gold began flowing into the bullion vaults of the New York Federal Reserve Bank.
- The first causality of war is money. The dollar during WWII was no exception, as seen in the rise in CinC during the early 1940s.
- In 1957, a run on the “US Gold Reserves” began, as European central banks could see then what you and I can see now; the US was printing more paper dollars (Blue Plot) than they had gold reserves (Red Plot) to back them. These central banks began withdrawing their gold, and it was their gold from the United States.
- In August 1971 the US Treasury “closed the gold window”, terminating both the Bretton Woods’ $35 an ounce gold peg, and the run on the US gold reserves. At the time the US had issued 202 paper dollars for each ounce of gold reserves on hand, which is no way to maintain a $35 an ounce gold peg.
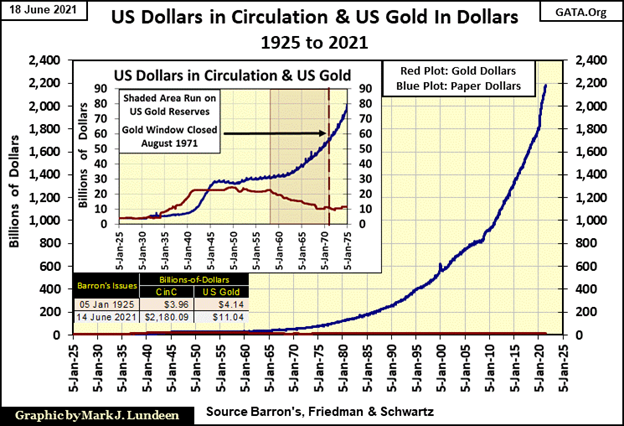
In the main body of the chart above, the effect of the closing of the Treasury’s gold window is evident. The gold reserves (Red Plot) have remained at around $11 billion dollars since August 1971. The US Treasury values their gold at $42.22 an ounce, fixing by weight the total hoard of US gold at around 261.51 million ounces of gold since the early 1970s. CinC has soared to $2.178 trillion dollars in the past half century. Only an economist could fail to see the inflationary impact of demonetizing gold.
Note: the US Treasury has never allowed a full and independent audit of the American people’s gold. Assuming it’s all there (which may be a mistake), by Barron’s 14 June 2021 issue, the United States has issued 8,330 paper dollars for each ounce of gold they claim to possess. This is why they suppress the price of gold and silver at the COMEX.
It’s only going to get worse. This week (chart below) the FOMC has “injected” an additional $54.20 billion dollars of “liquidity” into the financial system. This is far from the plus $400 billion they “injected” into the financial markets in a single week April 2020 to reflate market valuations. But come the next crisis, expect the pending Not QE#5 to exceed the extremes seen in their Not QE#4 seen below.
Realize this criminal gang, now gripping the financial system’s reins of power, no longer has the option of functioning in a responsible fashion. For them to do so would result in another Great Depression event, which would correctly be blamed on them.
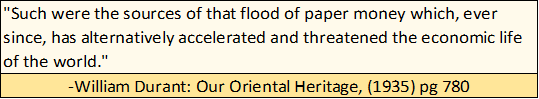
This has happened many times before, beginning with the 11th century Song Dynasty of China experiment with paper money. The experiment proved a disaster to the Song Dynasty, inspiring the following quote from William Durant.
Billionaires understand their dollars are going to become worthless someday. So, they use their dollars as down payments on loans for as many working class homes as possible. By design, ultimately this will prevent working people from ever becoming home owners. Instead, the working class will be paying rent to their “betters” to the day they die.
This video from Sky News Australia places this into the larger context of the Davos Group’s “Great Reset”; “where you will own nothing and you will be happy.” And that’s an order!
‘You will own nothing, and you will be happy’: Warnings of ‘Orwellian’ Great Reset – YouTube
They’re reinstituting the feudalism imposed upon farmers and the working classes during the decline of the Roman Empire. It was called the Dark Ages then. Call it what you want now; Great Reset? Sure, why not? Just understand this would not be possible without the Federal Reserve’s ability to “inject” unlimited “liquidity” into the banking system to finance this wicked scheme. For people with the ethical standards of Roman emperors, such as Caligula or Nero, this is actually a brilliant move.
The following verse from Ecclesiastes seems appropriate.
Let’s move on to gold’s BEV chart. Last week I was thinking gold was going to break above its BEV -5% line. You know; close in scoring position. Shows you what I know about the future! What actually happened was gold broke below its BEV -10% line this week, closing the week just 0.50% above its BEV -15% line. I don’t like it, but there it is.
This is the same BS gold and silver investors have had to put up with for decades. The “policy makers”, flooding the COMEX market with bad-faith paper promising delivery of nonexistent bullion, some day in the increasingly uncertain future, whacked gold and silver prices once again.
Keep in mind, for those who were waiting for a price pullback to purchase silver eagles from internet coin dealers, from last week’s close to the close of this week, silver-eagle prices remained basically unchanged. Do a Google Search for silver eagles and silver round prices. Silver closed the week at $25.80, see how much silver you can purchase for less than $30 an ounce, then do the same for gold.
So, what are we actually looking at in the chart below? I’d say a market fraud in progress. The big banks know the BIS’s (Bank of International Settlement) new Basil III standards on their reserves makes paper gold no longer a tier 1 asset. They’re attempting to reduce their short positions to mitigate the consequences of the Basil III standards that comes into effect on June 28th.
Trading in the gold and silver markets for the rest of June may not be all we would like it to be. But come July or August, I’m still expecting new all-time highs for gold.
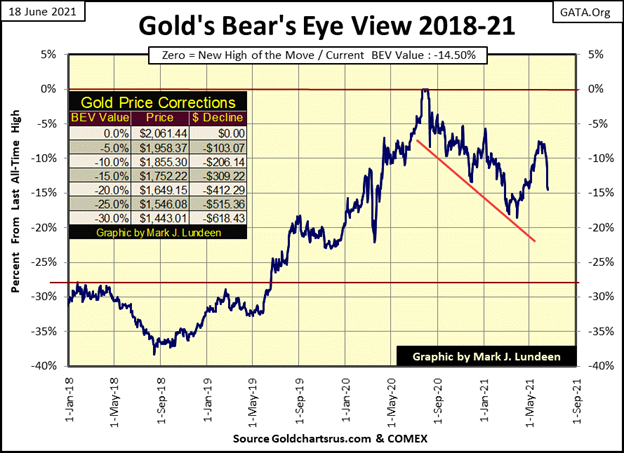
But dealing with gold’s BEV chart above as is, it’s a shitty little game for sure, but okay I’ll play. The key to the gold market seen in the chart above is its BEV -15% line ($1752) – can it hold? If not, we then look to its BEV -20% line ($1649) for support. Geeze Louise, gold going for $1649? Even on the COMEX this is a stretch with the current talk about rising CPI inflation. The mainstream financial media too is addressing the current, “but temporary” increase in CPI.
For myself, I’m keeping my eye on the prize; gold closing over $2061. Currently, I’m not going to seriously consider gold trading below $1649 on the COMEX, or anywhere else. But even if it does, I’m not going to sell. Sometimes one just has to keep an iron hand on the tiller and wait for the seas to calm down. I expect this may be such a time.
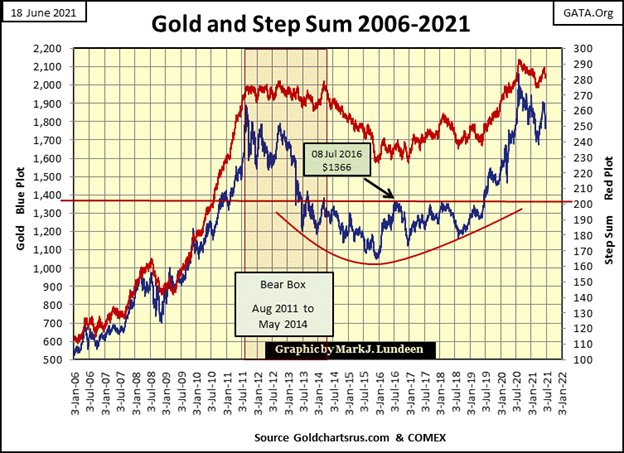
Here is gold’s step sum chart. Does this chart continue “looking good?” Well, it appears worse for wear after this week, and it may look still worse after next week. No matter, following the six-year bottoming formation spanning 2013 to 2019, where $1360 (Red Line) proved to be the line-of-doom every time the bulls attempted to break above it. Then three years ago in June 2019, the current advance cleared this line of resistance, and now stands on solid support far above it. For the bears, forcing gold to trade below $1700 will prove a difficult task for them to accomplish.
So once again, I’m keeping my eye on the prize; gold closing above last August’s $2061.
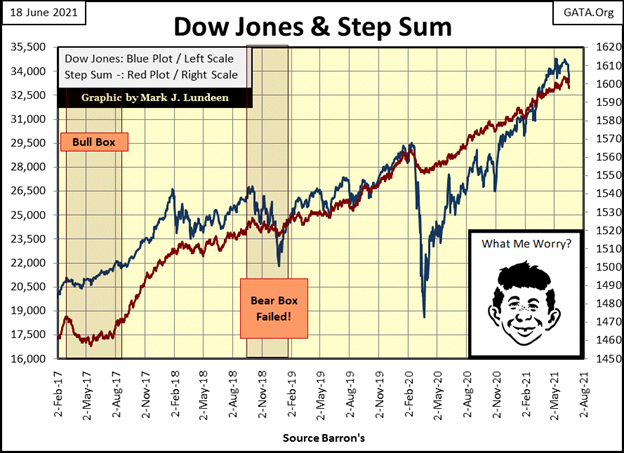
In the step sum chart for the Dow Jones, this week’s collapse in market valuations (aka market reality in a step sum chart) is obvious, but should it worry us? Well, Alfred below isn’t worried just yet, and he knows about as much about markets as do lots of “market experts” and economists seen on TV these days.
So, speaking for myself as I sit high up in the market’s peanut gallery, with absolutely no personal market exposure to the stock market, except for my precious metal mining companies, I too stand with Alfred, and refuse to worry about what comes next for the stock market.
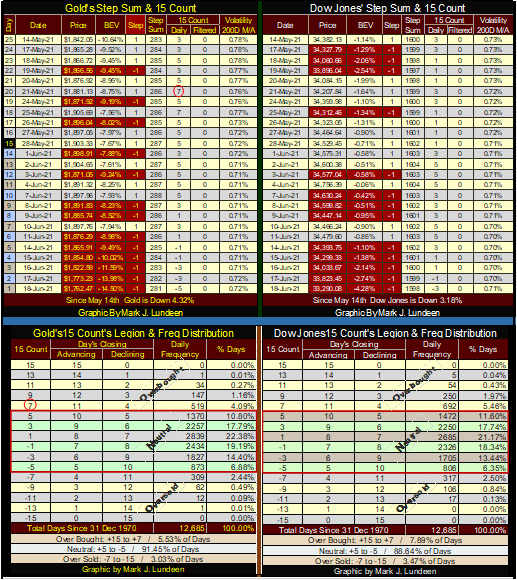
On May 21st, gold’s 15-count saw a +7 in its upper table (Red Circle below), taking it into overbought territory. What that means is for that and its previous fourteen trading sessions, gold advanced in eleven of them and closed down in only four. Here’s the math for a +7, 15-count:
11 + (-4) =7
Since 31 December 1970, gold has seen 12,685 trading sessions, with only 519 (4.09%) of these closing seeing gold’s 15-count at a +7. Like the Dow Jones, gold doesn’t like such a high 15-count. So, I wasn’t surprised seeing a correction following its 15 count of +7 on May 21st. However, for gold to correct back below its BEV -10% level, almost down to its BEV -15% level, took a coordinated attack by the bears in the futures market in my opinion.
As things stand at this week’s close, with gold’s 15-count at -5, most of the damage the bears can possibly impose on the gold market may have already been accomplished. But Basil III standards are still one trading week away (the five trading days for next week), so we may see more bearish action next week too.
Should next Monday for gold be a down day, we’ll see a 15 count of -7. A 15 count of -7 places the gold market in an oversold condition, which is good for us gold bulls.
Should every day next week be a down day, next week gold will close with a 15 count of -11, which as seen in its lower table, has happened only 12 times since 31 December 1970. With gold’s 15 count at a -11, or even a -9 sometime next week, we’ll see gold in an extreme oversold condition, from which a strong rebound should be expected.
So, I say to you gold bears, go bears go, be fearless and bold and sell, sell, sell all next week! Which as I’ve mentioned above, due to the Basil III standards coming into effect on June 28th, they just might anyway, with or without my permission. I’m just pointing out that the deeper into negative territory gold’s 15 count descends by the close of next week, the better it will be for the gold bulls come the first week of July.
What actually comes from all this, like me, my readers will just have to wait two weeks to find out.
—
(Featured image by QuoteInspector.com CC BY-ND 2.0 via Flickr)
DISCLAIMER: This article was written by a third party contributor and does not reflect the opinion of Born2Invest, its management, staff or its associates. Please review our disclaimer for more information.
This article may include forward-looking statements. These forward-looking statements generally are identified by the words “believe,” “project,” “estimate,” “become,” “plan,” “will,” and similar expressions. These forward-looking statements involve known and unknown risks as well as uncertainties, including those discussed in the following cautionary statements and elsewhere in this article and on this site. Although the Company may believe that its expectations are based on reasonable assumptions, the actual results that the Company may achieve may differ materially from any forward-looking statements, which reflect the opinions of the management of the Company only as of the date hereof. Additionally, please make sure to read these important disclosures.


Tilray Acquires HelloMD to Expand Medical Cannabis Digital Platform
Tilray Brands acquired HelloMD, a digital healthcare and medical cannabis platform, pending court approval on June 29, 2026. The deal...


Spanish Crowdfunding Market Reaches Record €761.6M in 2025, Driven by Real Estate and Crowdlending Growth
Spanish crowdfunding market reaches record €761.6M in 2025, driven by strong real estate dominance and rapid crowdlending growth, while donations...


Swedish fintech Lysa is preparing to enter the European ETF market
Swedish fintech Lysa is entering the European ETF market, registering its first ETF and expanding beyond its robo-advisor model. Managing...


Bitcoin Stalls Near $60K as Strategy Moves, ETFs Outflow, and EU MiCA Rules Take Effect
Bitcoin hovers near $60,000 with ETF outflows, while Strategy boosts reserves, sells BTC, and raises dividends to reassure investors. Ethereum...


Morocco’s Growth Holds at 4.6% as Agriculture Offsets Economic Pressures
Morocco’s economy grew 4.6% in Q1 2026, driven by a strong agricultural rebound offsetting declines in industry. Services expanded moderately...
 |
|
 |  |
 |
|
-
 Crypto1 day ago
Bitcoin Stalls Near $60K as Strategy Moves, ETFs Outflow, and EU MiCA Rules Take Effect
-

 Africa1 week ago
Moroccan Bond Market Shows Mixed Signals as Primary Eases and Secondary Pressures Persist
-

 Africa1 week ago
Morocco’s Economic Growth Outlook Strengthens for 2026
-

 Impact Investing2 weeks ago
AI Adoption in Italian Retail Stalls Despite Strong Experimentation