Featured
Why investors remain cautiously bullish on the Google stock
What could be the reason behind the bullish outlook on Google’s stock?

The time has come to review Alphabet Inc (NASDAQ: GOOGL) once again because it has failed to make any headway in recent months. This is not necessarily a bad thing, but it is always wise to frequently review investments and make sure nothing has changed. This is especially true if your bullish view on this investment was generated using the Google stock chart.
Yes, that is correct. I am bullish on Alphabet stock because the price action on the stock chart warrants this view. I analyze the merits of an investment using technical analysis, which is a method of investment analysis that is based on the notion that historical price and volume data can be used to forecast the future direction a stock is heading in.
I am bullish on GOOGL stock, but there are a few metrics and price patterns that need to be watched:
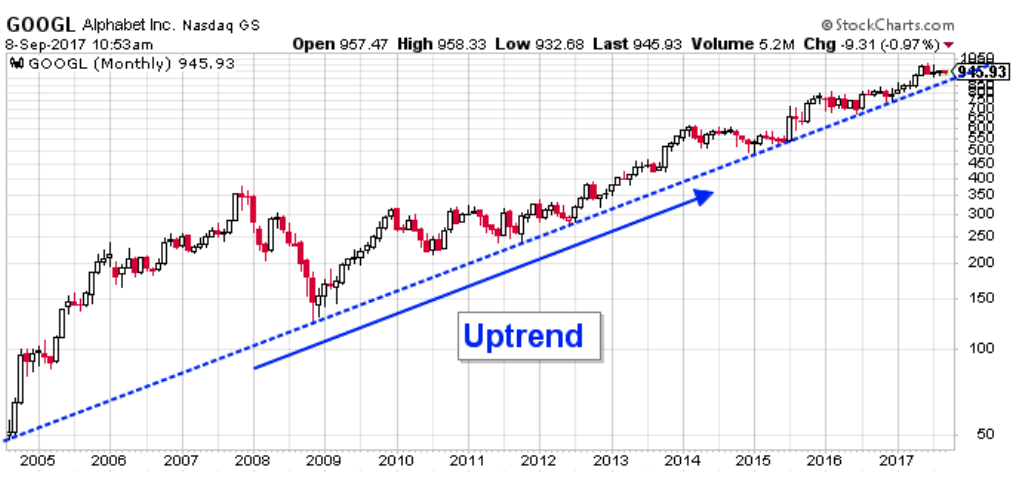
© StockCharts.com
The price chart illustrates that since inception in 2004, GOOGL stock has consistently made higher highs and higher lows, which is the quintessential characteristic of a bullish trend.
The price action has been so pristine that defining this quintessential bullish trend was easily accomplished using a simple uptrend line. Connecting the lows on the stock chart using a straight line creates this simple uptrend. The number of times this metric has been tested is a testament to the significance that this uptrend line carries.
Essentially, as long as the stock is trading above this uptrend line, I can only assume that a bull market is still in development and therefore higher stock prices will prevail. If Google trades below this trend line, I will have all the reason I need to step back from my bullish view on Alphabet stock. It would suggest that the bullish trend that began in 2004 had finally run its course and a larger correction was in the works.
This uptrend line defines GOOGL stock, and its significance should never be ignored.
The price action above the uptrend line has created a technical price pattern that can be used to discern whether the uptrend line is going to be tested or new highs will be forged.
The following Alphabet stock chart illustrates the price action that is currently occurring above the uptrend line.
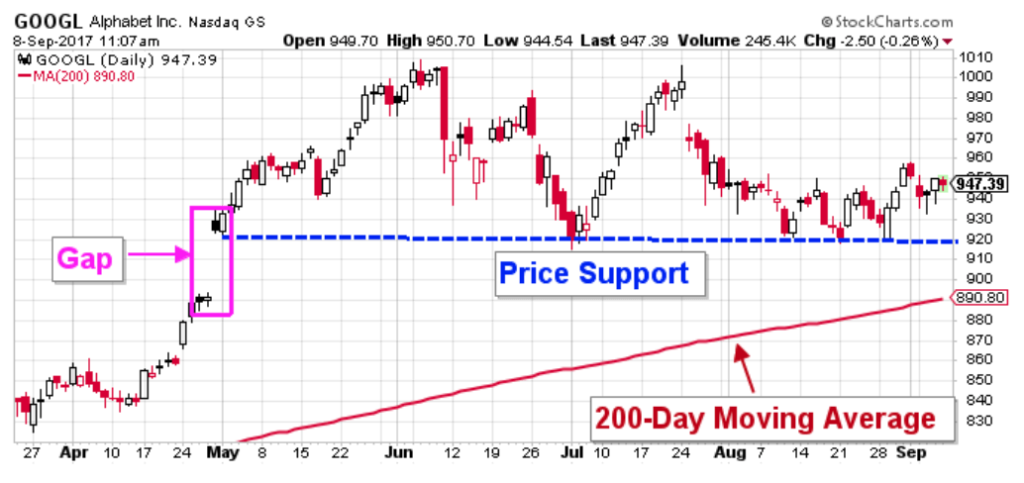
© StockCharts.com
The price chart reiterates what I mentioned earlier in that in the last few months, Google stock has made little headway.
On April 28, 2017, GOOGL stock gapped higher following a positive earnings report. Over the next few weeks, the stock price breached the $1,000 marker and has since been trading in a range bound by $920.00 and $1,010.00.
The $920.00 level is very significant; it has been tested four times since it was established and buyers continue to step into and support this metric. Closing below $920.00 would have a number of bearish implications.
The first implication would involve filling the gap, which would put the 200-day moving average to a test. The 200-day moving average is created by averaging the stock’s closing price over the preceding 200 days and plotting that value on the stock chart. The 200-day moving average is used as a dividing line that separates healthy bullish investments from unhealthy bearish ones.
What adds to the 200-day moving average importance is that it currently coincides with the uptrend line.
The second implication of trading below $920.00 is far more ominous because it would complete a potential double top, suggesting that Google stock is setting up to break below the uptrend line.
This potential double top is created as result of this investment’s two previous attempts to trade above the $1,000 price point and being unable to sustain that level. The low that separates these two tops sits at $920.00, and closing below that level would complete the pattern, suggesting that lower prices are likely to prevail.
A completed double top would imply an initial price objective of $830.00, which is below both the 200-day moving average and the uptrend line.
A break below these metrics would be all the reason I need to take a step back from my bullish view on this investment. As a result, it is imperative that Google stock remains trading above these metrics, which means it is also imperative that the share price refrains from trading below $920.00.
Analyst take
Alphabet stock is potentially setting up a bearish price pattern that could be putting the uptrend line that defined the bullish trend in the stock in jeopardy. It is imperative that GOOGL stock holds support at $920.00 to avert completing the bearish price pattern. At this juncture, I remain bullish on this investment, but if the share price falls below the uptrend line, that view will quickly change.
—
DISCLAIMER: This article expresses my own ideas and opinions. Any information I have shared are from sources that I believe to be reliable and accurate. I did not receive any financial compensation in writing this post, nor do I own any shares in any company I’ve mentioned. I encourage any reader to do their own diligent research first before making any investment decisions.


Temotiva Launches Crowdfunding Campaign to Advance Preventive Mental Health
Temotiva Innovación Lab has launched a crowdfunding campaign through Santander X Explorer, marking a new phase for the University of...


Fed Policy Shift Raises Concerns Over Debt and Inflation Risks
The Federal Reserve is criticized for resuming balance sheet expansion through Treasury purchases despite expectations of tighter policy under new...


AI Adoption in Italian Retail Stalls Despite Strong Experimentation
A survey on AI in Italian large-scale retail trade shows companies are increasingly adopting artificial intelligence, but only 1.4% have...


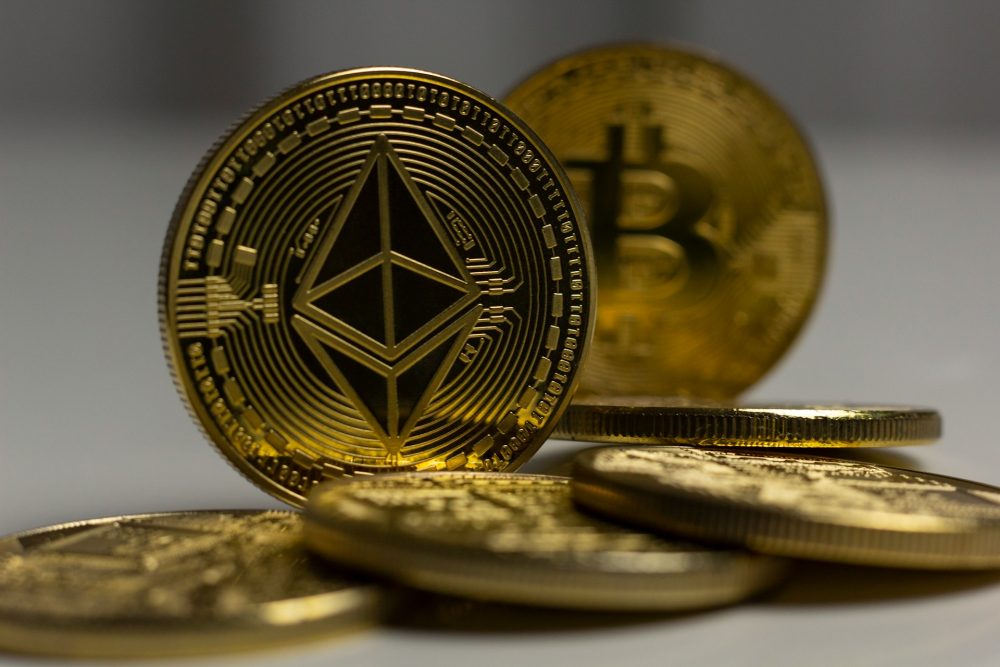
Crypto Market Stays Stable as Bitcoin and Ethereum See Mild Declines
The crypto market remained stable despite slight declines in major coins like Bitcoin and Ethereum. Bitcoin held near $64,362, while...


WNBA Removes Cannabis From Banned Substances List in New CBA
WNBA removed cannabis from its banned substances list in a new CBA running 2026–2032, aligning with NBA policy and allowing...
 |
|
 |  |
 |
|
-
 Fintech2 weeks ago
German Fintech Investment Slumps as AI Becomes Key Focus
-
 Crypto2 days ago
Crypto Market Stays Stable as Bitcoin and Ethereum See Mild Declines
-
 Crowdfunding1 week ago
Sustainable Restoration of the Haus Hövener Garden in Brilon
-

 Cannabis5 days ago
Europe’s Cannabis Shift: Rising Use, and New Risks
You must be logged in to post a comment Login