Featured
Historic crashes on the world’s financial markets
The crash of 2020. There was nowhere to hide. The “plague” stalked “Wall Street”. Everything was on sale – stocks, gold, oil. Even bond prices fell as the week dragged on. It has been a crash for the record books. Not even the “bird doctor” could save this. The monetary authorities are in a deep “pickle”. The politicians “hands are tied”. And behind all this carnage lies a mountain of debt.
No, we are not proposing to send in the “bird doctor” to combat COVID-19. The plague doctor was common during the period of the bubonic plague in the mid 14th century. It was also known as the “Black Death.” But the bizarre costume didn’t come into vogue until the 17th century. It was a protective suit worn by the doctor to protect him from the plague. The suit consisted of a light waxed overcoat and a mask with glass eye openings and a beak-shaped nose: hence, the “bird doctor.” The nose was stuffed with herbs, straw, and spices so that the doctor wouldn’t have to smell the rotting bodies. The doctor used a cane so he didn’t actually have to touch the bodies.

We’ve come a long way. Now, we just lock down entire countries and use the power of the state to keep people indoors and/or ensure they sit a meter apart if outside. It probably won’t work. Isolation is not a solution to the problem when it results in lost income, children not in school, difficulty in buying food, and not to discount the costs on the psyche of being cooped up for an unknown period of time.
If the “Black Death” is anywhere, it is in the stock markets as record after record seems to be falling. It is as if the “bird doctor” is stalking Wall Street, Bay Street, and The City. People’s retirement funds have been ravaged. A 31% collapse of the TSX Composite in a mere three weeks is nothing to sneeze at. Nearly four years of gains wiped out in three weeks. And it may not be over. It is the fastest transition from a bull to a bear ever recorded, surpassing even the 1929 collapse in terms of its speed.
We read that the Bank of Montreal (BMO) is expecting Q2 growth in Canada to fall by 3.5% annualized. That says nothing about expectations for Q1. If that is expected for Canada, we’d be loathed to suggest what may happen to Italy, Germany, China, etc. and, yes, even the U.S. Not even the tweeting president can save this one. We may end up calling this the Trump bear.
BMO calls for Q2 because that is when the coronavirus is expected to peak as the weather warms. Yet, compared to previous plagues, this one is still pretty small even if we suspect it is/was being underreported in China, not reported from North Korea, and, as some suggest, the U.S. is underreporting because they lack testing kits. Imagine. At last count there have been over 160,000 cases and over 6,000 deaths, with 156 countries and territories affected, including one international conveyance, the Diamond Princess cruise ship at last count. We’re getting there on the countries as there are only 197 of them, including the two observer states The Holy See (Vatican City) and Palestine.
There now appears to be little doubt that the world is headed for a global recession. The question is, what will the fallout be, given an overleveraged global market and record debt? Cutting interest rates does nothing for the mountain of corporate debt where spreads are already rising. Cutting interest rates will do nothing for the estimated $3.4 trillion debt of bonds rated barely above junk. Downgrades in this category could trigger a fire sale with no bid. Cutting interest rates will do nothing if the banks start running scared and decide to pull in and retrench sharply on lending. What we will have, and may already be experiencing, is a lack of liquidity despite $1.5 trillion in injections from the Fed and endless rounds of repos. You may want to sell, but who are you going to sell to if the market goes no bid? Is a bank holiday possible? There are precedents.
There is a belief out there that the Fed will step in to save the day. The trouble is, the actions of the Fed cannot stop what has officially become a pandemic. The Fed can’t fix disruptive supply chains or lockdowns that force people to stay home. For an entire decade now the G7 countries and China have become accustomed to recording low-interest rates, endless liquidity, and numerous interventions via QE and more. This has perversely allowed people (and corporations) to ignore fundamentals and base their decision on the Fed (or whatever central bank) will bail you out. The question becomes, what will they do when the job losses and the defaults mount, threatening the banking system? Doing what they did in 2008 won’t work anymore as that strategy is tapped out. Bail-outs become bail-ins. And, speaking of the banking system, we are reading that nearly the entire European banking system is teetering on the edge. Hence, rumors of a bank holiday.
If the market begins to lose faith in the Fed and the authorities to stop this, then the real selling will get underway. The bond market is already signaling that there is a big problem. U.S. 10-year treasury yields have fallen at one point as low as 0.54%. Canadian 10-year yields fell to 0.53%. Those yields are well below the rate of inflation. The low rates are signaling economic stagnation, something Japan in particular and also the EU are quite familiar with. Both have experienced years of low, even negative, interest rates. One would think there was a 9/11 coming or that it has arrived—except that rates didn’t fall that low even then. If we are this low now without a recession, what will they do when a recession actually arrives, an event that now appears likely to happen.
They say that the banking system is in better shape today than it was in 2008. Where, we are not sure, but they are supposed to pass regular stress tests. However, there are other worries. There are pension funds, hedge funds, mutual funds, and more that we also have to worry about. We are hearing rumors that some giant hedge funds could be in trouble. These multi-billion-dollar behemoths are no small matter. The largest, Bridgewater Associates, has upwards of $130 billion under management. Recall it was the collapse of few small hedge funds of Bear Stearns in 2007 that started the ball rolling on the 2008 financial collapse. In 1998, the collapse of the hedge fund Long Term Capital Management (LTCM) almost brought down the global financial system before massive intervention from the Fed.
The COVID-19 pandemic may have been the trigger for the current collapse. But behind it are other dangers lurking, including the potentially negative effects of climate change and the omnipresent threat of global war. In January 2020 the Doomsday Clock was set at 100 seconds (1 minute and 40 seconds), the smallest on record. While those are definitive dangers, the real danger lurks in the over-leveraged balance sheets of the corporations. When will we start to see the write-downs and negative hits to earnings and the real possibility of defaults? And it is not just over-leveraged corporations—consumers are also over-leveraged and there is the real possibility of sovereign debt defaults as well.
As job losses begin to mount, add in some defaults, and soon consumer confidence begins to wane. Then we have to look to the overleveraged housing market and soon realize that a housing price collapse could quickly follow. For an entire decade the world has been living an illusion fueled by endless QE and the biggest borrowing binge in history. The COVID-19 virus is just the face of the real, underlying disease—debt collapse. It is not a question of if; it is a question of when.
However, all of this plays out over time. Have we hit a bottom yet on this wave down? Possibly, or if not, we are very close. Our “Chart of the Week” shows how an initial crash is followed by a wave to the upside, a wave that often lasts several months. We have the technical conditions in place that might suggest a low is at hand.
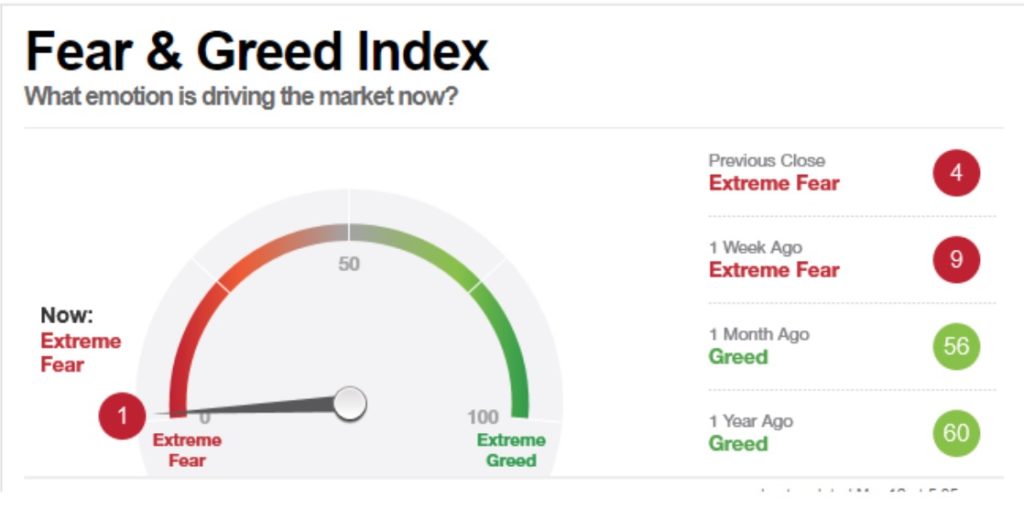
Our first chart below shows the “fear and greed index.” The closing on Thursday March 12, 2020 was the lowest ever. It is showing extreme fear; yet a month ago the index was still green, reading greed. The “fear and greed index” can’t get any lower. As with any of these indicators, it doesn’t necessarily mean we are at the bottom, but it does suggest that a potentially significant low could be at hand.
Our second chart shows our favourite VIX Volatility Index which is also a measurement of fear and greed. The VIX hit the current level seen only once before—at the time of the 2008 financial crisis and the Lehman Brothers collapse.
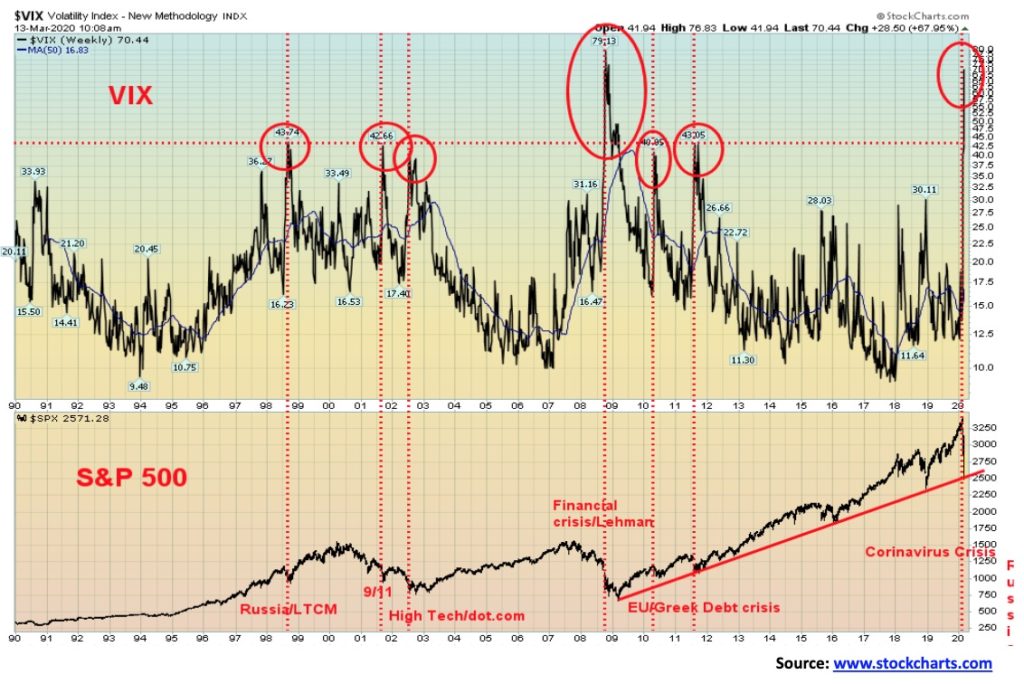
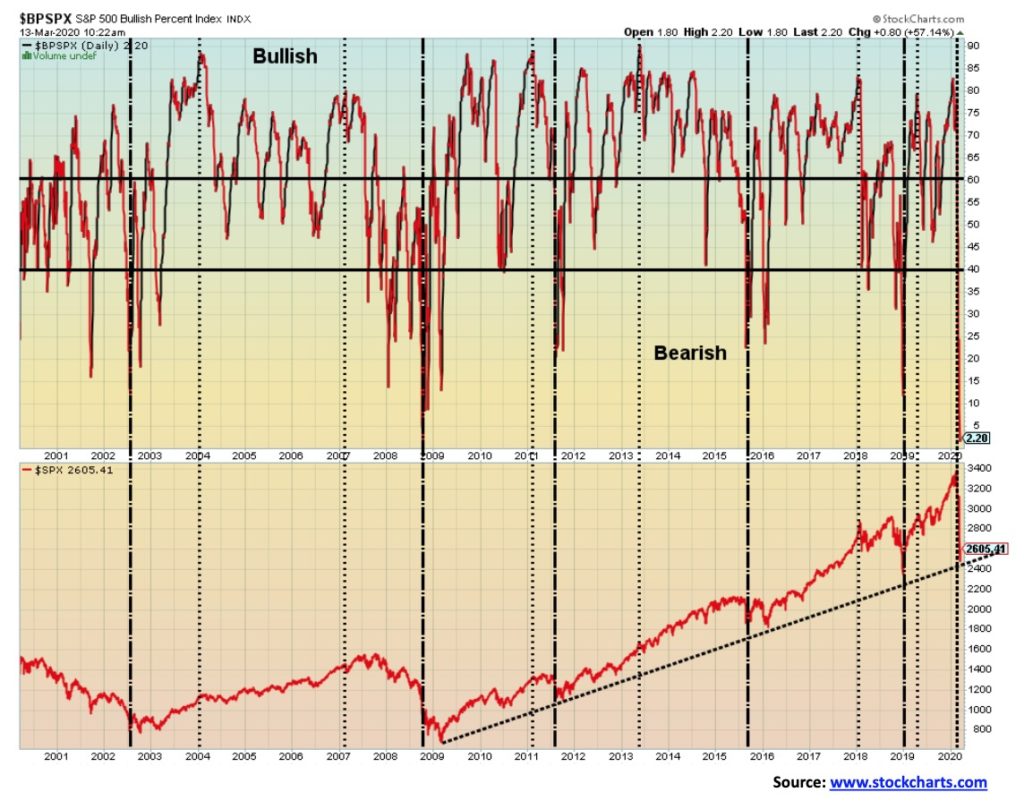
Note as well that the S&P 500 has touched down on the uptrend line from March 2009 low. Even if eventually we crash through that line, initially at least we should receive a solid bounce off of it. The nature of the bounce will give us clues as to when the third leg down or C wave down gets underway. As we noted, the rebound wave following a crash can last for at least a few months and could last several months.
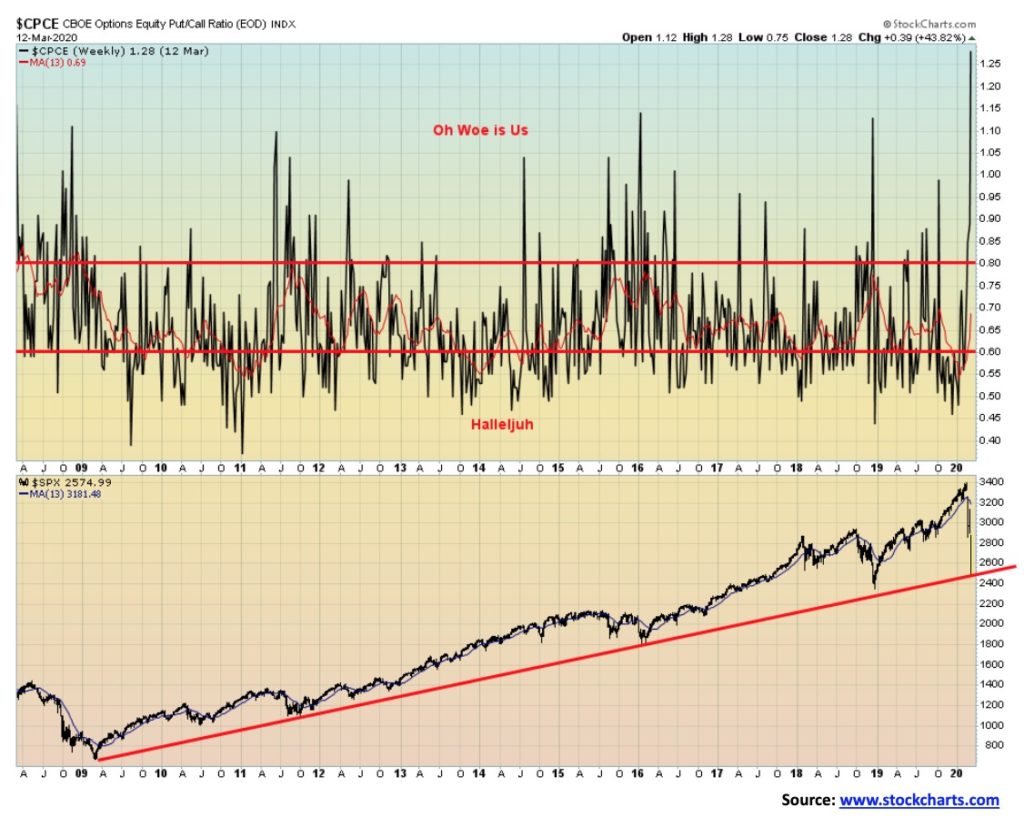
The put/call ratio is in uncharted territory. We have never seen it so high. It is higher now than it was at the time of the 2008 financial crisis. Another indication that we are more than likely at or near a potential low.
Another one is below, the S&P 500 Bullish Percent Index. It has hit a reading of 2.20. Again, we have never seen one this low since 2000, not even during the Lehman Brothers collapse of 2008. Another sign that the market here is probably a low-risk entry point.
There are numerous other bull/bear indicators that we could show, all of which are basically saying the same thing: that we are at a point of extreme fear, and when we reach those points it is usually a low-risk buying point. We are not saying we have hit the absolute bottom. We could rally, then fall back again, but the signs will be the same.
The “bird doctor” may be stalking the land and Wall Street and Bay Street. But the sun still comes up in the morning.
Crash patterns are nothing new. We have been witnessing them since the beginning of markets. Given the events of the past month, we thought it would be educational to show some different styles of crash patterns from the past. Naturally, we can’t show them all. And crash patterns can vary as they can be straight forward ABC-type patterns or sometimes they become more complex as in an ABCDE-type pattern. The most classic pattern was the Dow Jones Industrials (DJI) from 1929–1932. There was an A wave crash that was swift but devastating. The crash from September 1929 to the low in November 1929 wiped 47.9% off the index. The B wave lasted until April 1930 and gained back 48%. The C wave was a long decline lasting from April 1930 to July 1932 and saw the DJI fall 86%. Altogether from September 1929 until July 1932, the DJI fell 89.2%.
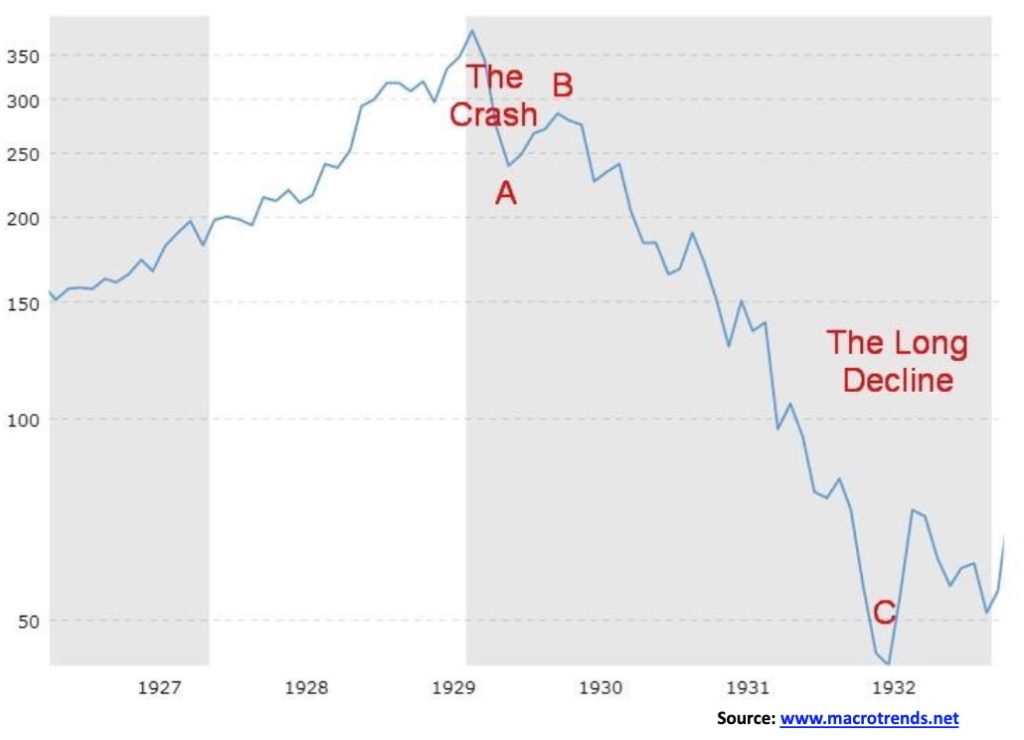
Chart of the Week – Dow Jones Industrials Crash Pattern 1927-1932
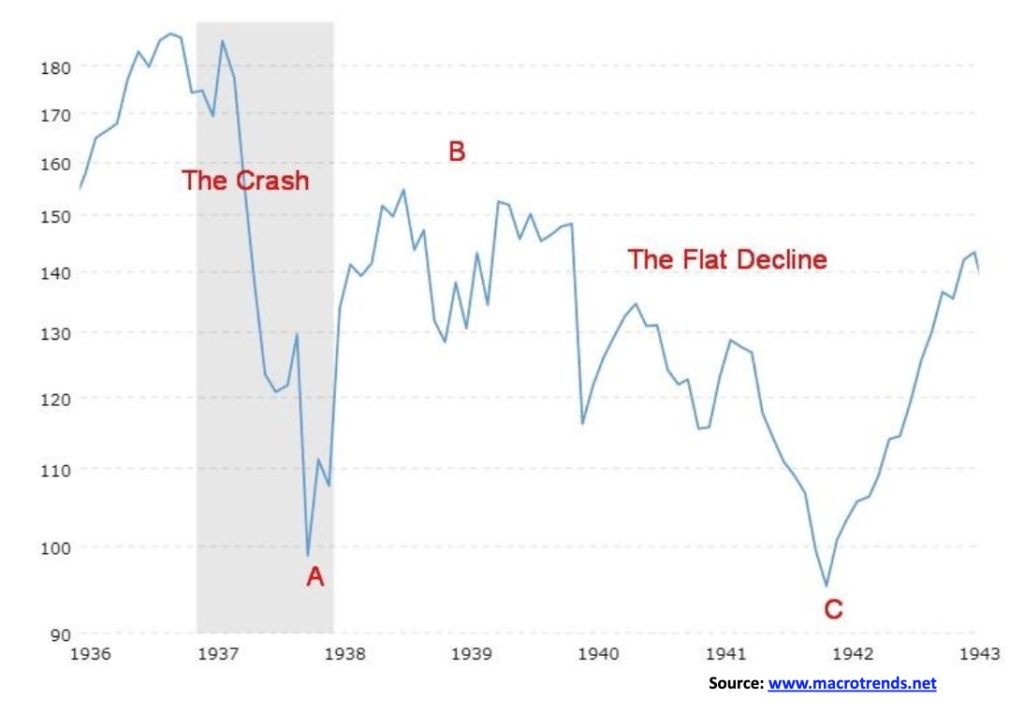
Another type of pattern was seen in the 1937–1942 stock market crash (shown on the next page). In that crash the initial A wave down lasted from March 1937 to its low in March 1938. The DJI fell 49.1%. The B wave was actually two-pronged with a wave up from March 1938 until November 1938 and the DJI gained 60.1%. An interim wave down lasted from November 1938 to April 1939 and the DJI lost 23.3%. The final leg up went from April 1939 to September 1939 as the DJI recouped 28.4%. The final C wave down lasted from September 1939 to April 1942 as the DJI crashed 40.4%. Altogether, the DJI was down from the top in 1937 to the final low of 52.2% in 1942.
Other noteworthy crashes were the long 1970s bear market that topped in February 1966 and made its final bottom in August 1982. Nominally, altogether the DJI only lost 22.0%, but when one adjusts for inflation the decline was a lot steeper, a whopping 72%. The bear played out over a period of 16 years and was a very complex ABCDE-type pattern with the major crash occurring from January 1973 until December 1974 when nominally the DJI fell 45.1%.
The 1987–1990 bear was more typical with the crash occurring from August 1987 until October 1987 as the DJI fell 36.1%. The rebound lasted from October 1987 to July 1990 and the DJI, nominally at least, made new highs, gaining 72.5%. The final leg down lasted from July 1990 to October 1990 and it was relatively short, losing 21.2%. It never took out the October 1987 low. Noteworthy here was the A wave down once again was the crash.
One could argue that the 2000s bear was really two bears with a bull in between. The first bear lasted from January 2000 to its final low in October 2002. The real crash occurred on the final wave down from March 2002 to October 2002 as the DJI fell 31.5%. The A wave down saw the DJI go through a series of downs and ups before crashing into 9/11. The DJI lost 29.7% during that wave. Altogether the DJI lost about 38%. In between, the DJI rallied from October 2002 to October 2007 making new all-time highs and gaining 94.4%. The final financial crisis/Lehman Brothers crash lasted until March 2009 as the DJI fell 53.8%. In this case, the most severe decline was the final C wave from October 2007 to March 2009.
So, what will this one be? Already the crash that, in reality, got underway from the January 17, 2020 top has seen the DJI crash so far 27% from the January top. In a space of only one month, all of the gains from December 2018 have been wiped out. Keep in mind this is only the A wave down. If we follow previous patterns, as we should, there will be a B wave recovery that should recoup anywhere from 50% to 100%. Once complete it would be followed by another leg down. That could take us out until at least 2022 before we see the final bottom.
We acknowledge Elliott Wave International (www.elliottwave.com) for its insights in helping us construct this look at crashes.
Nowhere to hide. The crash of 2020 will, no doubt, go down in the annals of stock market history. The top was on February 12, 2020. Exactly one month later, on March 12, 2012, or 29 days later, the Dow Jones Industrials (DJI) was officially in the bear market territory, having fallen 28.5% from the high. Move over 1929. That market took 71 days to hit its bottom on November 13, 1929, and it was 55 days later that the DJI entered the bear territory with the crash of 1929. Altogether that big drop was 47.9%. The stock market this week set a record for the fastest transition from a bull to bear ever. The devastation on people’s retirement funds is still being tallied.
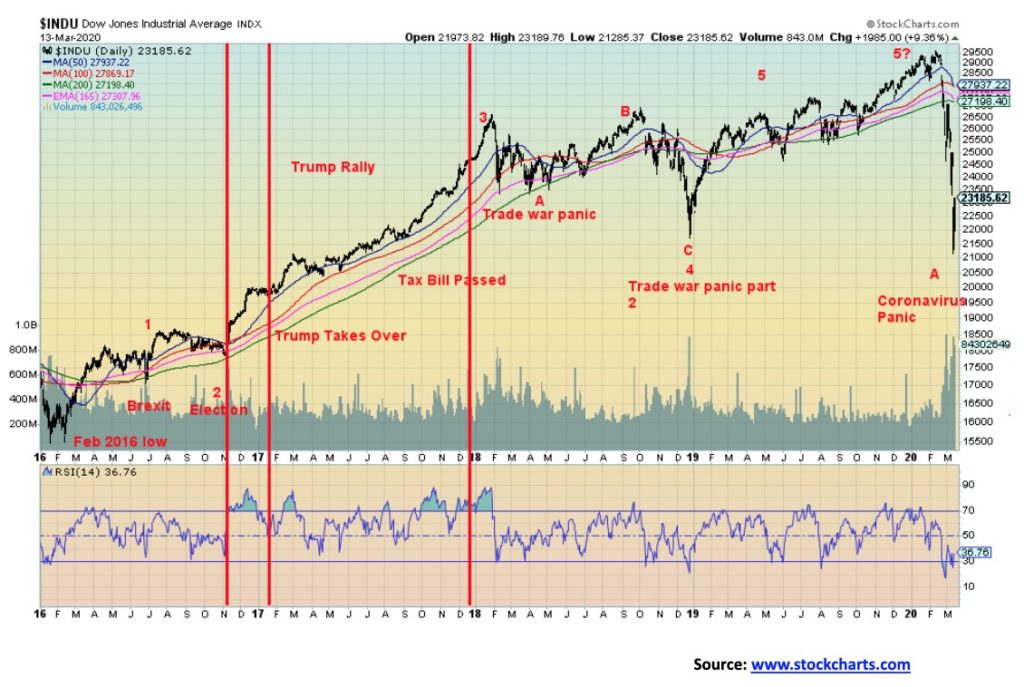
The records kept on falling this past week. Monday, March 9 opened up with a 1,520-point drop for the DJI. On Friday, March 12, the DJI bested that, falling a record 2,174 points altogether. However, the DJI wasn’t done. On Friday, March 13 it made history again, but this time to the upside, 2,035 points altogether. On the week it was also a record as the market fell at the low 4,072 points, easily surpassing the week of February 24, 2020. As a result of the big rally on Friday, the President was tweeting off walls.
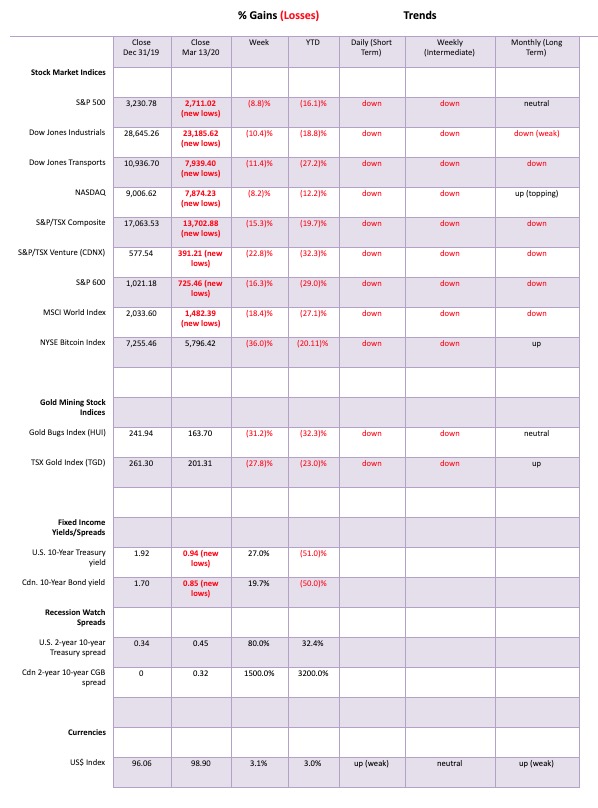
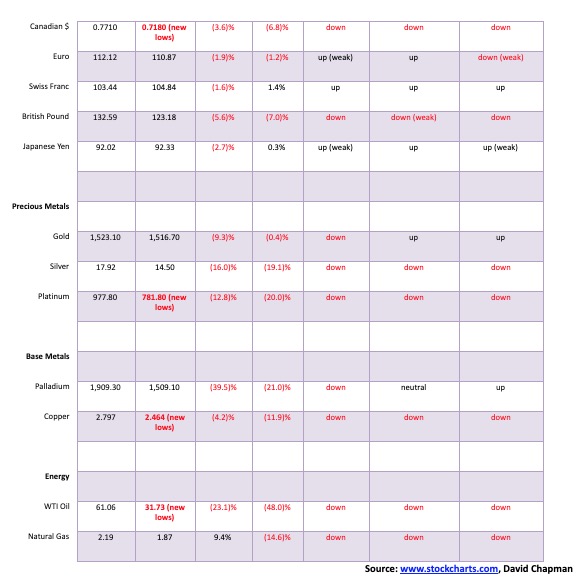
On the week the DJI fell 10.4% and is now down 18.8% on the year. The Dow Jones Transportations (DJT) dropped 11.4% this past week and is down 27.2% on the year. For the rest: S&P 500 down 8.8%-week 16.1% year, NASDAQ down 8.2%-week 12.2%-year, S&P 600 (small cap) down 16.3%-week 29.0% year. Here in Canada, the TSX Composite fell 15.3% week and down 19.7% year, while the TSX Venture Exchange (CDNX) was off 22.8% and 32.3% on the year. Every index noted hit new 52-week lows and in the case of the CDNX new all-time lows.
Bitcoin was not a safe haven either as it fell 36.0% and is now down 20.1% on the year. Not even gold was safe, dropping 9.3% and is now down 0.4% on the year. The World MSCI Index dropped 18.4% and is now down 27.1% on the year, the London FTSE off 17.1% week 28.8% year, Paris CAC 40 down 19.9% week 31.1% year, German DAX down 20.0% week 30.3% year, Tokyo Nikkei Dow (TKN) down 16.0% week 26.3% year and the star the Shanghai Index (SSEC) down 4.9% week 5.3% year. The SSEC was improving as China seemed to be coming out of its coronavirus crisis and getting back to work.
So, what does one do in the midst of such carnage? Few went to cash before this happened. A few more raised some cash but nowhere near enough as the collapse was so swift and so all-encompassing. But, as we noted in our essay, we are at extremes. We can’t say it’s over but with stimulus packages, interest rate cuts and more, the market has an opportunity to stabilize and potentially start a B wave advance. We can’t with clarity say the A wave down is over. We might get a bounce, then followed swiftly by another collapse to new lows.
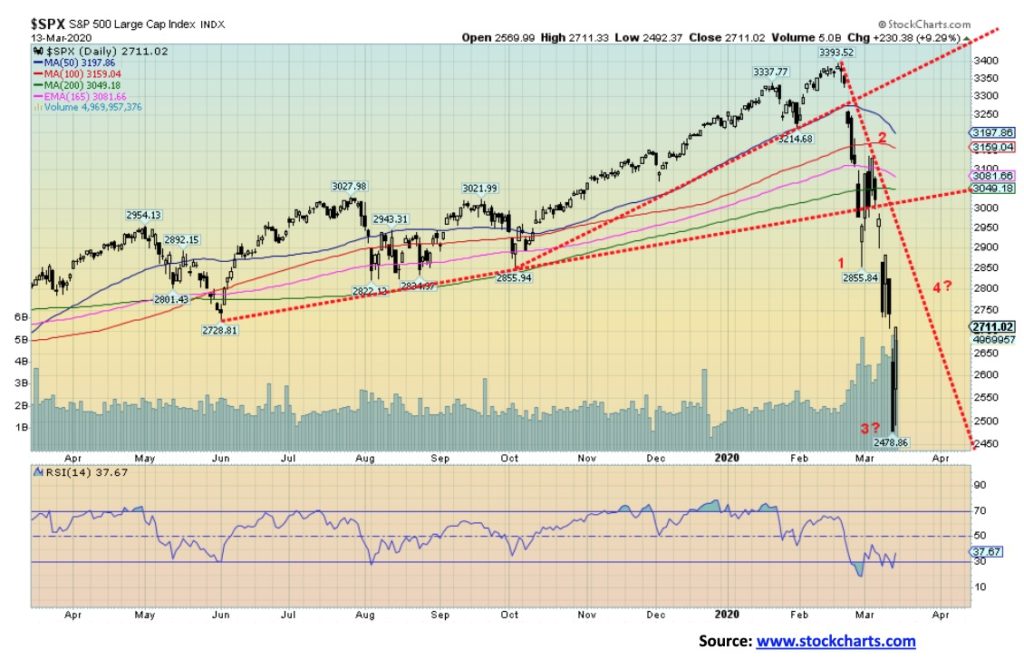
If we use the February 12 top, we count waves 1, 2, and 3 down. To come wave 4 up, that may have started on Friday followed by wave 5 down. This wave is an impulsive one to the downside. If it was a corrective wave it would be ABC and the low might be in on Thursday. If we use January 22 as the final top, then we may have completed five waves down even if wave 2 was higher than January 22. For a number of other indices, the January 22 top was not exceeded. If this is a wave 4, then we should remain below the bottom of wave 1 at 2,856 on the S&P 500. So, we are not holding our breath that this is over just yet. Once this wave up is complete, then another sharp decline could follow. If the wave down, for example, was comparable with October 1987 then that wave down was 36.1%. An equivalent now would take the S&P 500 to 2,170. That would take the S&P 500 below the December 2018 low.
However, have no doubts about it—we have started a bear market. Typically, a bear market lasts at least a year and a half but could last upwards of 2 ½ years. With this kind of swift drop combined with the negative effects of the coronavirus crisis, avoiding a recession seems almost impossible. The manner in which everything is being shut down will have a huge economic cost. If it is over quickly, then the damage might be limited and the recession will be over in a year. But if this drags on for a couple of months or more, the damage may be irreparable as debt defaults mount and unemployment soars because people are laid off. Thousands of part-time workers and freelancers in the gig economy have little or no safety net and no access to things like EI. People’s portfolios have been ravaged. A prolonged slump and collapse of consumer sentiment could spill over into the housing market, sparking a crash there. At that point, a steep recession could get worse and become a depression.
We’ve said all along that the devastation caused by the 2008 financial crash has left the central banks with few bullets. The world is engorged on debt, and as asset prices fall, the debt remains unchanged and increasingly unserviceable. Defaults follow, both corporate and consumer. Corporate debt to GDP in Canada is around 120% and consumer debt to GDP is about 102%. At the end of 2018 non-financial corporate debt to income was 315%. Overall, the amount of global debt outstanding of BB-rated or lower far exceeds what was outstanding after the 2008 financial crisis. Upwards of 60% of Canadian corporate debt is in US$. Not a good thing to have when the Canadian dollar is falling vis-à-vis the U.S. dollar.
There is a serious financial crisis brewing. We have noted that the Fed’s repo program started back in September, long before the coronavirus crisis erupted. The Fed at one point added $3 trillion to the repo facility. Something is wrong out there. Yes, the Fed may temporarily push this off if the health crisis can be brought under control. But, no matter what, we have entered a bear market and bear markets are not over in 29 days irrespective of a 1 on the fear and greed index and over 60 on the VIX. It may only mean we get a tradeable low, but for many the rebound could be a time to restructure and prepare for the next phase. Once we find a low, a recovery rally follows and those rallies can last a few months, even longer. Once the recovery rally is complete, the third and final phase of the bear unfolds.
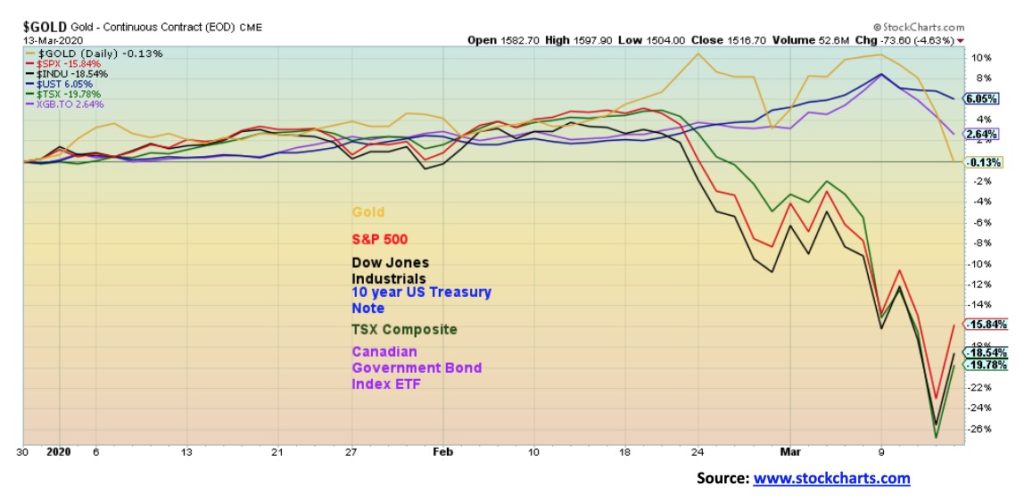
Our final chart shows performance. Gold is down a small 0.1% so far in 2020. Far better than the S&P 500 down 15.8%, the DJI down 18.5%, and, the TSX down 19.8%. Bonds have done well with the U.S. 10-year treasury note up 6.1% and the Canadian Government Bond Index ETF (XGB) up 2.6%. In the past bear markets, government (not corporate) bonds and gold have proven to be the top performers.
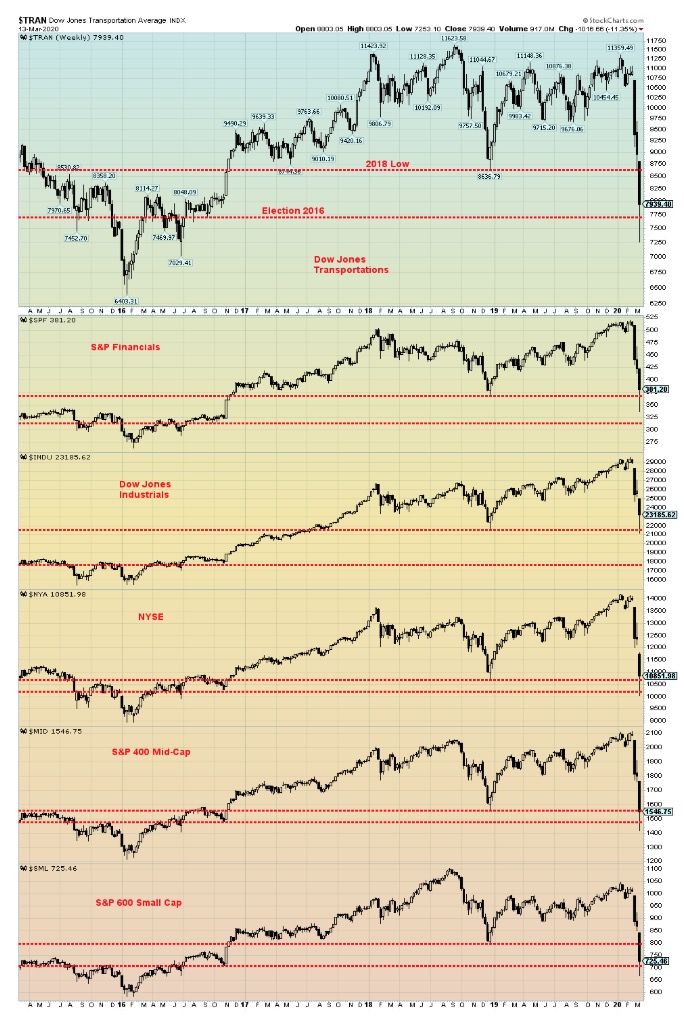
We are showing the above chart to get a good sense of the damage done this past week. Nothing was spared. We drew two lines on each of the above indices. The first one is the December 2018 low and the second one is the 2016 election of President Trump. Four of these indices took out not only the 2018 low, but they also took out the 2016 election low. Four years’ worth of gains wiped out in a matter of days. The worst was the Dow Jones Transportations (DJT), losing 11.4% on the week and 27.2% on the year so far. The DJT is laden with airlines and cruise lines amongst others. Also slicing through both the 2018 low and the 2016 election low were NYSE (barely), the S&P 400 Mid-Cap and the S&P 600 Small Cap. The S&P Financials took out the 2018 low and the Dow Jones Industrials (DJI) went just below the 2018 low before rebounding. All in all, a devastating week and one for the history books. The bear has arrived.
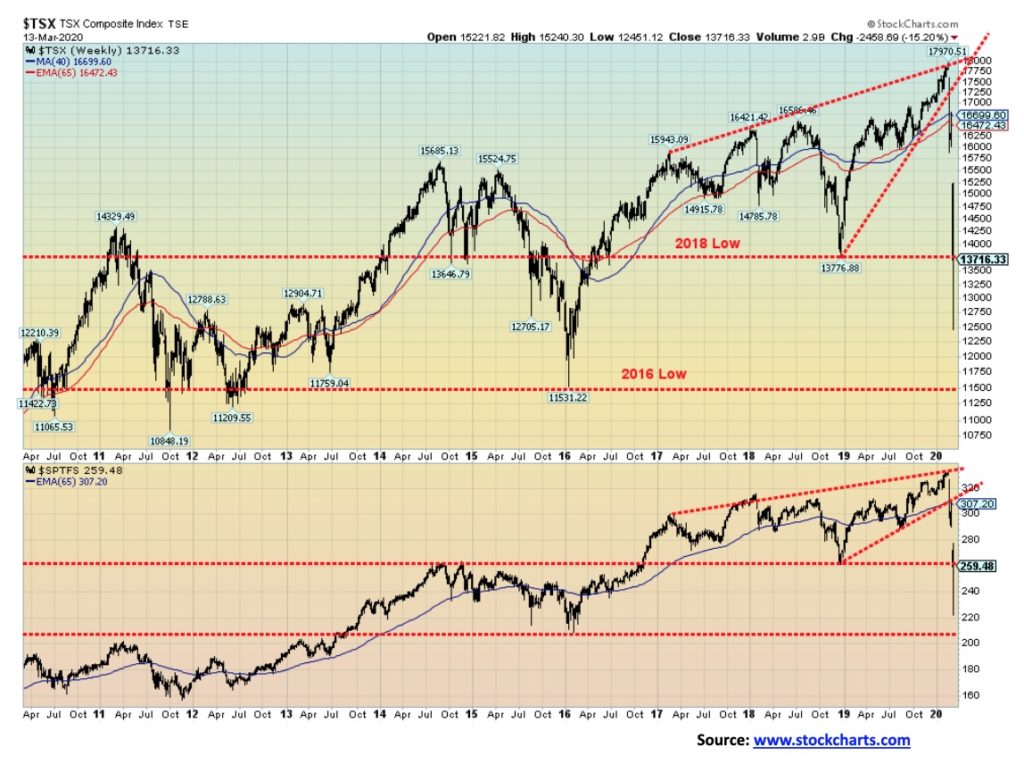
The TSX Composite and the TSX sub-indices were massacred this past week. We say massacred because that is the only way one can describe the carnage. Only 2 out of 14 sub-indices did not make new 52-week lows. All the TSX major indices, the TSX Composite, TSX 60, and the TSX Venture Exchange (CDNX) made new 52-week lows. The CDNX made all-time lows as the junior miners, technology, and others were taken out to the back-shed and hung. Our chart above shows only 2 of these indices. The TSX Composite and the TSX Financials (TFS) that make up 32% of the TSX. The TSX fell 15.2% this past week while the TFS was down 11.3%. The TSX is now down 19.6% on the year and the TFS down 18.0%. We know we have entered a bear market because not only did we take out the 2019 low, but we took out the 2018 low. The TFS is now barely above the 2016 low. The TSX a little bit higher off the 2016 low. So, two years was wiped out and almost four years of gains. Poof, gone.
The two sub-indices that didn’t make 52-week lows were Golds (TGD) and Information Technology (TTK). Still, they were down 27.8% and 10.0% respectively this past week. On the year, the TGD is down 23.0% and the TTK down 7.7%. By comparison, the TTK was a star. The stars of the week were the TTK, Consumer Staples (TCS), down 8.2% week and 5.7% year and Telecommunications (TTS), down 9.5% week and 10.8% year. At the other end of the spectrum was Energy (TEN) down 36.7%-week 55.8% year. Avoid Energy. Look at TCS, TTS, and TTK, given their stronger performance comparatively. Utilities (TUT) and select Income Trusts (TCM) should be okay as well.
In between, Consumer Discretionary (TCD) down 15.0% week 26.2% year, Health Care (THC) down 20.3% week 39.2% year, Industrials (TIN) down 10.5% week 12.3% year, Materials (TMT) down 24.1% week 27.9% year, Real Estate (TRE) down 15.0% week 11.1% year, Income Trusts(TCM) down 16.8% week 12.5% year, Metals & Mining (TGM) down 20.9% week 28.7% year, and Utilities (TUT) down 17.2% week 8.5% week.
As to the indices—well, the TSX 60 (large cap TSX stocks) was down 14.3% on the week and 18.4% thus far this year. The CDNX is almost too ugly to look at, losing 22.8% on the week and is now down 32.3% on the year. On the other hand, many of the junior mining stocks are trading below the value of their resource in the ground making them cheap, cheap, cheap. Some are even trading below cash value. Just be prepared to hold for a while.
Would we be surprised if the TSX fell to its 2016 level? No, although it may not do that right away. There will be congestion resistance up to around 13,700/13,800. Above 13,800, the TSX could move higher towards 15,000. There are some big gaps to fill. We didn’t show the daily chart of the TSX, but it has left a breakaway gap at the top, two runaway gaps, and finally, with the washout on Thursday, what could be an exhaustion gap. We have never seen that happen on a major index before. It was that kind of week. No prisoners were taken.
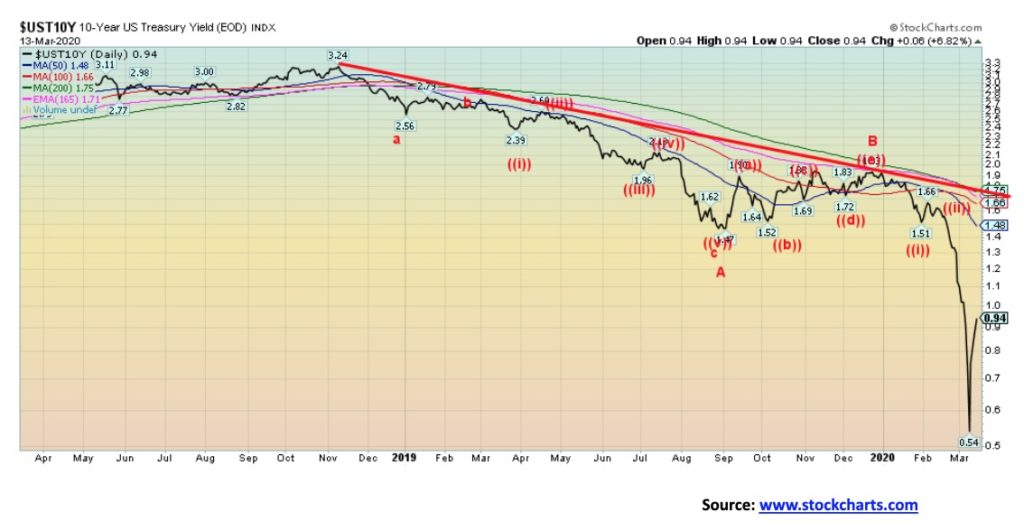
In the midst of the coronavirus crisis, the 10-year U.S. treasury note fell to 54 bp. It is now 94 bp. What happened? Out came the stimulus packages and since there are going to be bigger deficits, interest rates backed up. We could soon be back over 1.00% and headed for 1.50%. At the height of the coronavirus scare, there was a flight to safety of U.S. treasuries. Now it is fear of higher borrowing demands and a potential for a loss of liquidity to sell bonds and lock in those profits. We also have the specter of further rate cuts. The Fed meets this week on March 17–18 and the expectation now is that the Fed could cut the Fed rate by 1.00% on Wednesday. The same thing played out in the eurozone as Germany announced spending plans of at least $550 billion. That sparked a selloff in the bund market. Liquidity is also a major issue in the euro markets as they are in the U.S. The ECB, unlike the Fed, has no room to cut rates, given rates are already negative in the eurozone.
If we have a concern in all of this, it is that there could be a liquidity crunch in the bond and money markets. Not only would it be chaotic but it could spark defaults and fund collapses. Because the Fed is buying up all the treasury bills as part of its repo program there is also a growing shortage of treasury bills. Many need the short-term liquidity that treasury bills provide. One doesn’t have the same liquidity holding money market instruments such as bankers’ acceptances or commercial paper. There is also a much higher risk of default in those money market instruments.
Our expectation is that the 10-year yield is going to go higher here with initial targets up to around 1.50%.
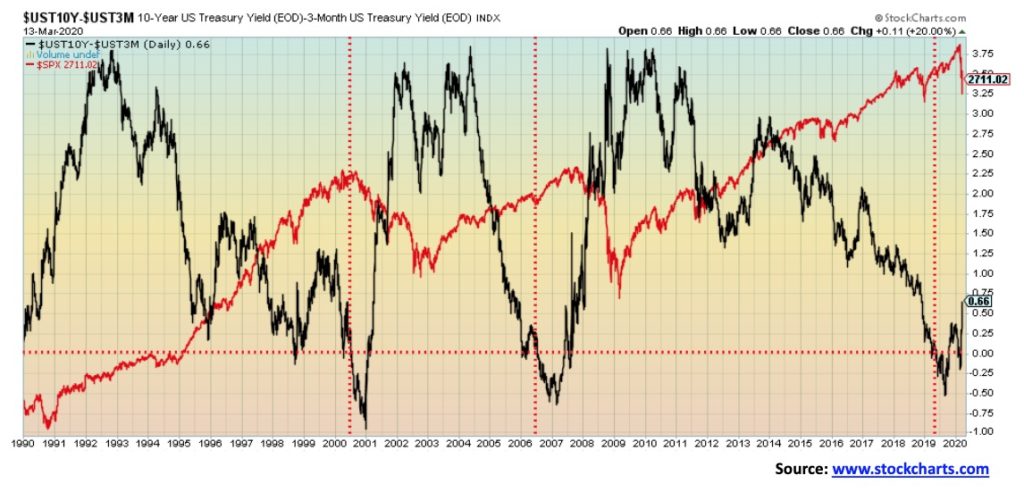
Rather than show our usual 2–10 spread we thought we’d show the 3m–10 spread (U.S. 3-month treasury bills less U.S. 10-year treasury notes). That spread has widened out to 66 bp. The 2–10 spread has widened out to 45 bp and appears to be headed higher. Targets for the 2–10 spread appear to be 56–60 bp over. For the 3m–10 spread, targets appear to be 90–95 over. A rise in the spread after they turn negative is not surprising. What happens is that the monetary authorities (Fed) push the short rates lower and the long-dated bonds begin to reflect the potential realities of rising borrowing demands as a result of a recession. That puts downward pressure on the price of long-dated bonds and upward pressure on the price of short-dated bonds (notes) (prices move inversely to yields). The result, of course, is higher rates in the long end, lower rates in the short end, and a widening of the spread. We note that, as we saw in the past, it took several months before a recession started or the stock market fell. That was quite noticeable in August 2006 when the 3m–10 spread first turned negative but the stock market took until October 2007 (13 months) to top and by that time the spread had turned positive again. Fast forward to now and the spread turned negative in May 2019, but the stock market didn’t make its final top until February 2020 (8 months) to top. A recession is now imminent, along with the bear market in stocks.
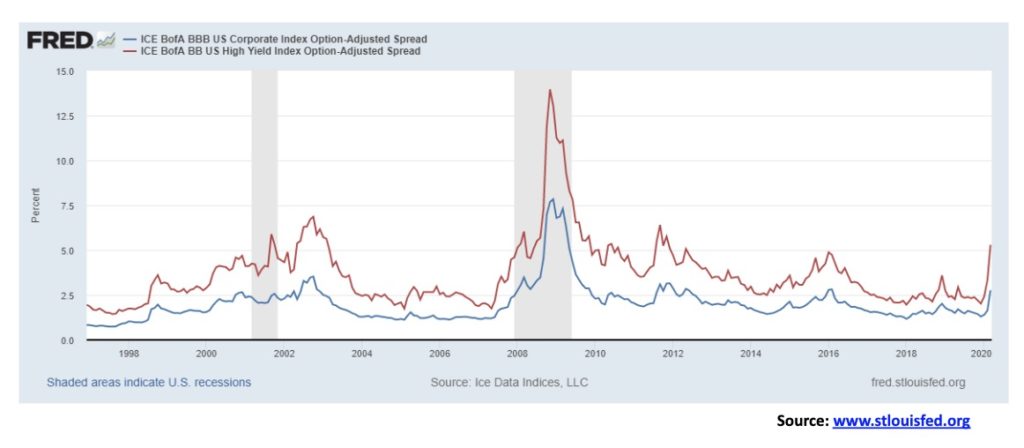
If there was any doubt that we could be facing a credit crunch and credit downgrades, it is the sudden widening of these weak credits that sends the message. BBB debt is the lowest investment-grade debt. The spread widened from 1.64% over 10-year U.S. treasuries to 2.77% now. BB debt is the highest-rated non-investment grade or junk bond debt. That spread rose from 3.33% to 5.30%. They have both broken the trend seen over the past decade. They could be on their way to the spreads seen during the 2008 financial crisis where BBB debt rose to 7.84% over and BB debt jumped to 13.96% over. Scores of bankruptcies followed. A downgrade of BBB debt could force liquidation into a market with no liquidity. In the U.S. we are already seeing big problems in the muni-bond market where spreads leaped and prices fell sharply. The bond markets are reacting to a leap in spending plans that is sure to reverberate back on the bond market with higher borrowings and that in turn push prices lower and spreads higher. We’ve always said the real problem is in the bond markets, particularly corporate bonds. And with 48% of the investment-grade corporate bonds in the U.S. rated BBB, there are some real dangers there for a blow-up and a major debacle.
The U.S. dollar has become the go-to currency to rush to as a result of the unfolding crisis. After looking like it was going to fall out of bed, we mused last week that a rebound rally would probably happen this week. We didn’t expect a rebound that has retraced almost the entire fall. But with rumors swirling over in Europe concerning the banking system and withdrawals of cash rising, we have mused as to whether a bank holiday is coming or worse—regulation on cash and even gold. The ECB’s failure to come with an aggressive package such as the Fed and U.S. came up with helped the rush into U.S. dollars.
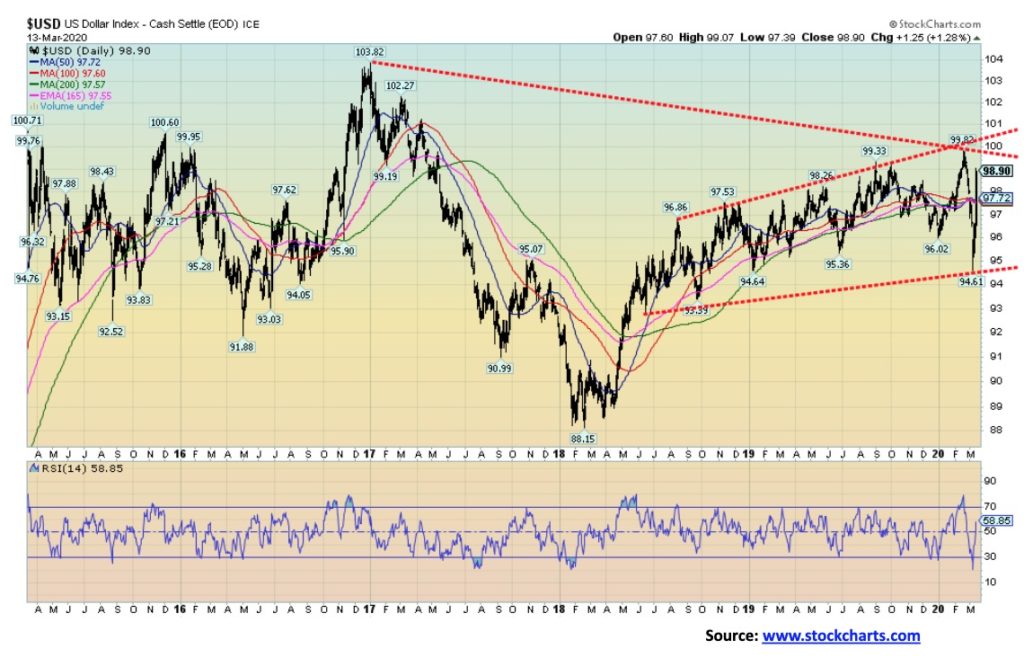
This past week the US$ Index rose 3.1% or almost 300 points. It was one of the steepest rises in years. The euro fell 1.9%, the Swiss franc was off 1.6%, the pound sterling dropped 5.6% as the U.K. is perceived to be in a bigger mess than the U.S., and the Japanese yen was down 2.7%. The Canadian dollar fell to fresh 52-week lows, losing 3.6% as the BofC cut the key bank rate by 50 bp. The move has forced us to reassess where we are with the US$ Index. The failure to break down once we were under 95 suggests to us that we could once again go higher. The U.S. dollar has become the defacto currency of choice. Gold was pounded down as a result. It won’t take much to break out over that downtrend line near 99.25, given we closed at 98.90. After that, new highs above 99.82 are possible. But we’d need to get over 100 to suggest that the US$ Index is poised to go much higher. So, we could fail once again near the highs or just above them. To the downside, we only firmly turn back down with a close under 97.
The US$ Index has seen quite a rush to the upside. Failure to see new highs or even a failure just above the previous high of 99.82 could send the US$ Index right back down.
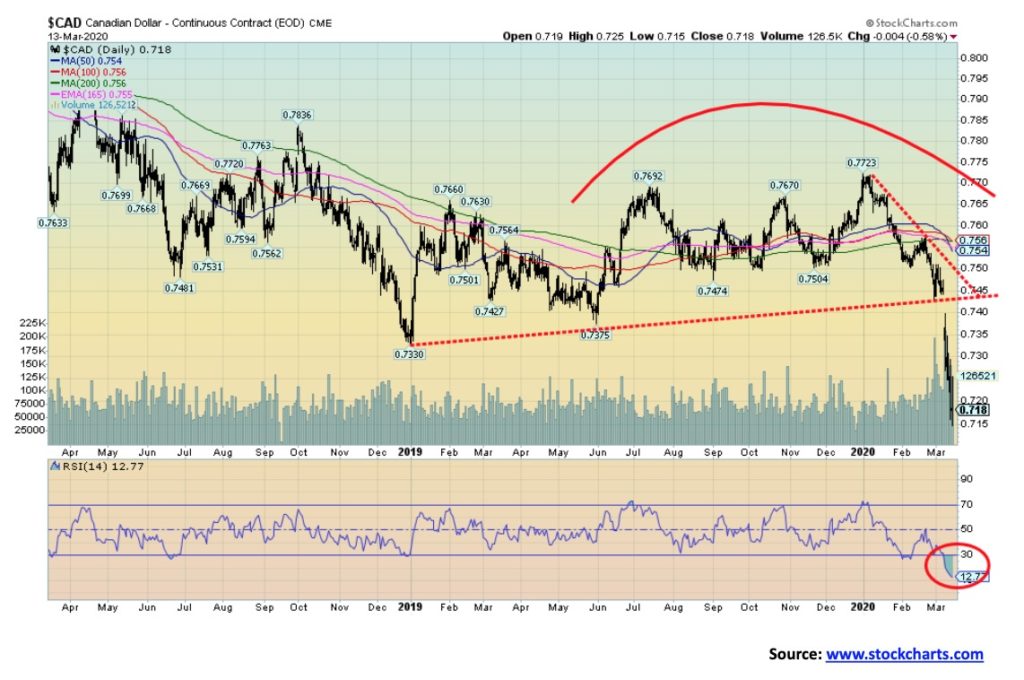
The Canadian dollar crashed this past week along with everything else. The BofC’s cutting of interest rates by 50 bp to 0.75% didn’t help. The Canadian dollar fell 3.6% this past week to 71.80, the lowest level seen since early 2016 when the Canadian dollar fell to 68.10. The all-time low was seen in January 2002 at 61.80. Given the double whammy of the coronavirus and the collapse in oil prices, the odds of Canada avoiding a recession are slim to none. Canada may have already started a recession. Job losses are a lagging indicator, so look for them to rise in the months ahead. That could help push the Canadian dollar even lower and test the 2002 low. At that level, it is a long way from what we call purchasing power parity of 83.00 or stated the other way around 1.20. On that basis, the Canadian dollar is cheap vs. the U.S. dollar. Not surprisingly, the Canadian dollar vs. the U.S. dollar has ranged over the years from the low of 61.80 to a high of 1.10. The Canadian dollar is grossly oversold at this point with an RSI of under 13. Expect a bounce at minimum but resistance is now up to around 74.00.
Nothing was spared this past week. Not even gold, the supposed safe haven. It is actually not unusual. During the 2008 financial crash, gold fell 33%. Just that the stock markets fell 50% plus. Gold played its role in outperforming. Silver? Well, not so much as in 2008, silver crashed 61%. To keep things in perspective, the S&P 500 fell 57.6%. So far, this time around the S&P 500 fell 27% from its high, gold has fallen 11%, and silver has dropped about 27%, similar to the S&P 500. So, what happened? Margin calls, rumors of an over-leveraged hedge fund in trouble forced into liquidation, and the usual suspects of the bullion banks selling on behalf of the monetary authorities to suppress the price of gold. Gold fell 9.3% this past week and is now down on the year by a small 0.4%. Compared to everyone else, that’s outperformance.
What was surprising is that the stock markets rallied back on Friday following the announcement of some stimulus plans, but gold failed to respond and fell a sharp $50+. But it was paper gold sold on the futures exchanges. On the other side, mints, refineries, and gold brokers saw significant demand for gold and silver coins and bars. There was little selling of physical. Central banks, led by Russia and China, continue to add to their reserves by upwards of 650 tonnes annually. A sharp rally in the U.S. dollar didn’t help gold. While gold in U.S. dollars was falling 9%, gold in Canadian dollars was only down 2.4%. Gold in euros was not quite as good, down 7.8% on the week. But if the euro were to fall further as we now suspect then gold in euros should hold or even rise.
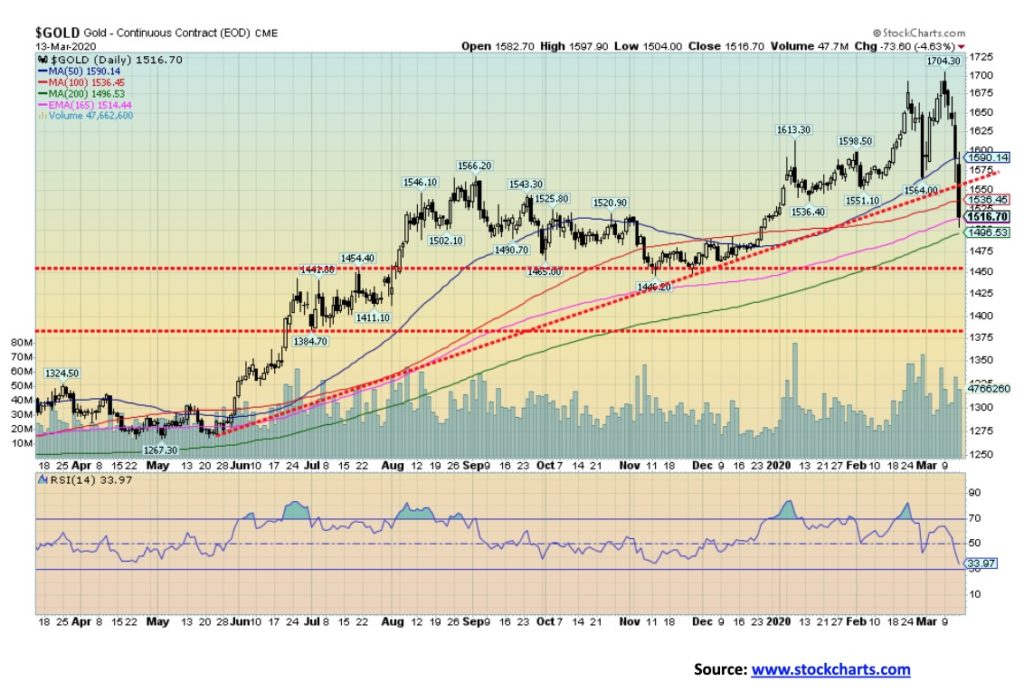
Gold has broken the uptrend line from the May 2019 low. This suggests to us that gold could fall down and test its major breakout level near $1,450. The 200-day MA is just below near $1,500. A breakdown under $1,450 could send gold even lower to test the 5-year breakout level near $1,370. Below $1,370 we would embark on a major drop to potentially test the 2015 low near $1,045.
Gold has a well-established cycle of lows, roughly every 2.5 to 3 years with an outside range of 2–4 years. The last significant low was seen in August 2018, so a low this summer would fit the cycle. Gold also has a well-established cycle of lows roughly every 8 years or, as Merriman of MMA Cycles calls it, 7.83 years. The last one was seen in December 2015. With an orb of 6–9 years, a major low could be seen in 2021. That would also fit with Merriman’s longest gold cycle of 23.5 years. The last one was the double bottom of 1999 and 2001. That would put the next major low anywhere from this year (less likely) out to 2026. The question is how low could we go? Is a test of the December 2015 low of $1,045 impossible? If gold were, for example, to fall as much as it did in 2008 a target could be around $1,175. That is, in U.S. dollars. If the U.S. dollar were to remain strong, then gold in other currencies would outperform.
To keep things in perspective, gold is up 424% since 2000 vs. a gain of about 85% for the S&P 500 and 63% for the TSX. Gold has support at $1,490/$1,510 and resistance at $1,550 and up to $1,600. Only over $1,600 could we suggest higher prices. Under $1,500 and we should test $1,430/$1,450. We appear destined to go through a rough patch for gold, irrespective of what money-pumping is carried out by the monetary authorities. We would not expect our final low to not occur until, at minimum, later this year or more likely into 2021.
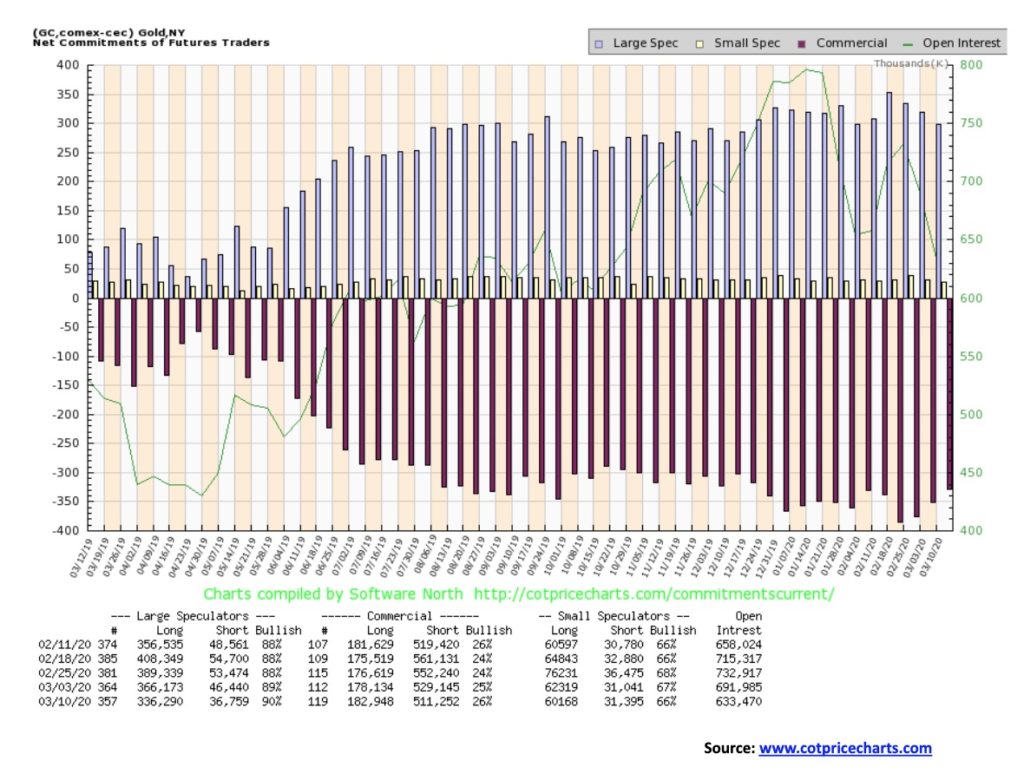
Some improvement is better than no improvement. The gold commercial COT improved to 26% this past week from 25%. This report is as of the Wednesday of each week so it does not include the two big days seen on Thursday/Friday this week. Short open interest fell about 18,000 contracts and long open interest rose almost 5,000 contracts. Overall, however, it was largely a short-covering exercise. The large speculators COT (hedge funds, managed futures, etc.) rose to 90% from 89% although they cut their long open interest by roughly 30,000 contracts and also cut their short open interest by about 10,000 contracts. It’s an improvement, but it is still not a bullish COT.
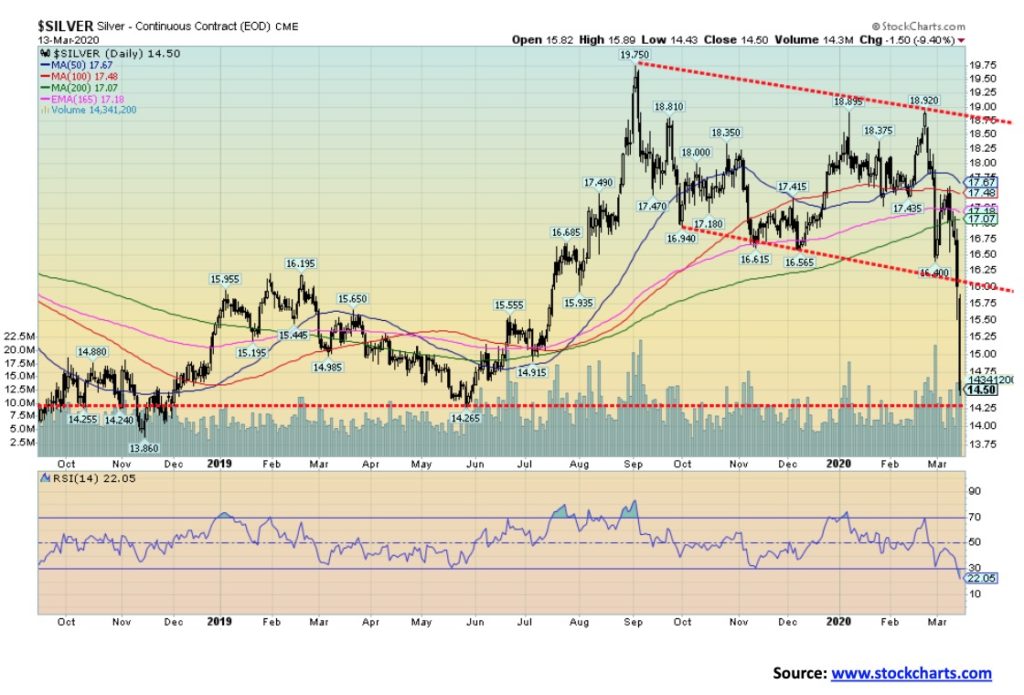
The divergence between gold and silver came home this past week as silver crashed 16% on the week and is now down 19.1% in 2020. What had appeared at least to be an orderly decline within a down channel became a collapse this past week as everything was on sale, given the crash in the stock markets. The gold/silver ratio that was already ridiculously high got even higher, rising to 104.60, the highest level seen in 50 years. We had noted that the divergence between gold and silver where gold made new highs but silver did not was concerning. That is similar to the divergence that occurs between the DJI and the DJT. This one played out in a nasty silver collapse. Silver prices have now collapsed back to where they were in May 2018. Further losses could be seen. However, given oversold conditions (RSI at 22) a corrective bounce may soon develop. Silver would need to regain above $16 to suggest to us that higher prices are possible. The 200-day MA is a long way off, near $17. Silver seems destined to go down and test the lows of 2015 and 2018 between $13.60 and $13.80. Silver never really went up like gold. Its 2016 high of $21.23 remains the high-water mark. And levels of $25 seen back in 2013 are a long way off. Gold easily bested both its 2013 high and 2016 high. Silver monumentally failed to reach any of its minimum targets while gold did. Could silver break down under its 2015 low of $13.62? Silver seems to hit a key low point roughly every 3 years, although that can vary from 2 to 4 years. Given that the last one was in November 2018, a low might be expected from anywhere in late 2020 to late 2022. We are at a potentially good support zone. We need to see some consolidation, but given the damage, any rally we suspect will be limited to up to $16.
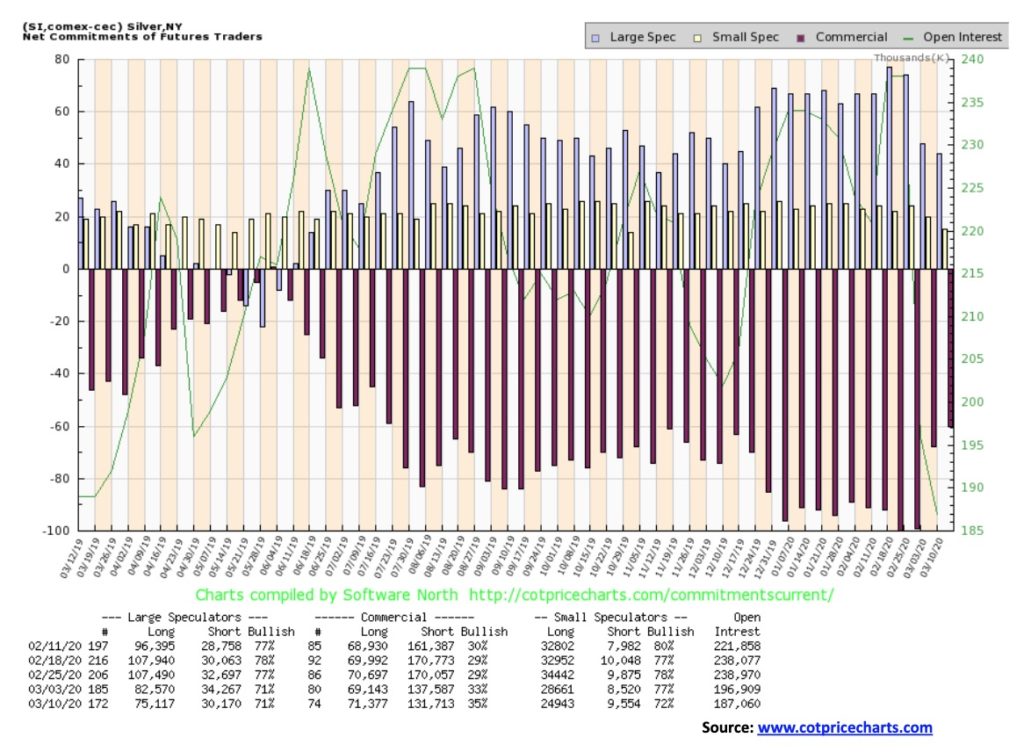
There was a decent improvement in the silver commercial COT this past week as it rose to 35% from 33%. Long open interest rose just over 2,000 contracts while short open interest fell almost 6,000 contracts. As with gold it was largely short covering. And, as with gold, it does not include Thursday and Friday’s action where silver fell sharply. We will be looking for further improvement with next week’s report.
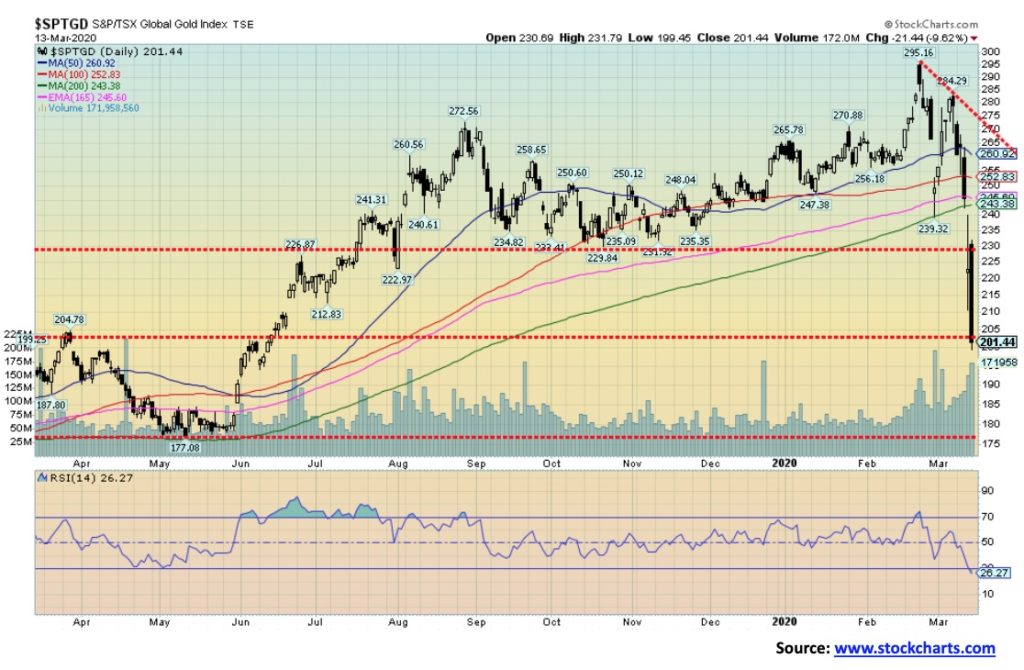
In the crash of 2020, nothing was spared and gold mining stocks were no exception. The transition from a high seen on February 24 to Friday’s low close for the TSX Gold Index (TGD) was swift and vicious. The TGD fell 27.8% this past week and is now down 23% on the year. It has been worse for the Gold Bugs Index (HUI) as it fell 31.9% this past week and is now down 32.3% on the year. The TGD wiped out all the gains from June 2019. If there is something positive, it is since the major low of December 2015 the TGD is still up 56.4% vs. a 5.4% gain from the TSX in the same period. The TGD has found potential support in a congestion zone that ranges from 200 to 230. On any rebound 230 might cap it. A breakdown under 200 could send the TGD down to the May 2019 low of 177. Below that is the 2018 lows at 147 and finally the 2015 low near 114. Given some oversold conditions, a rebound is possible but our expectations are that the TGD would cap out near 230 at best. However, oversold and overbought conditions are not unusual for the gold stocks and they can persist for some time. The gold stocks are still cheap compared to gold. However, this has persisted over the past five years. The last period where the gold stocks were expensive compared to gold was 2002–2008 and for a brief period in 2010–2011.
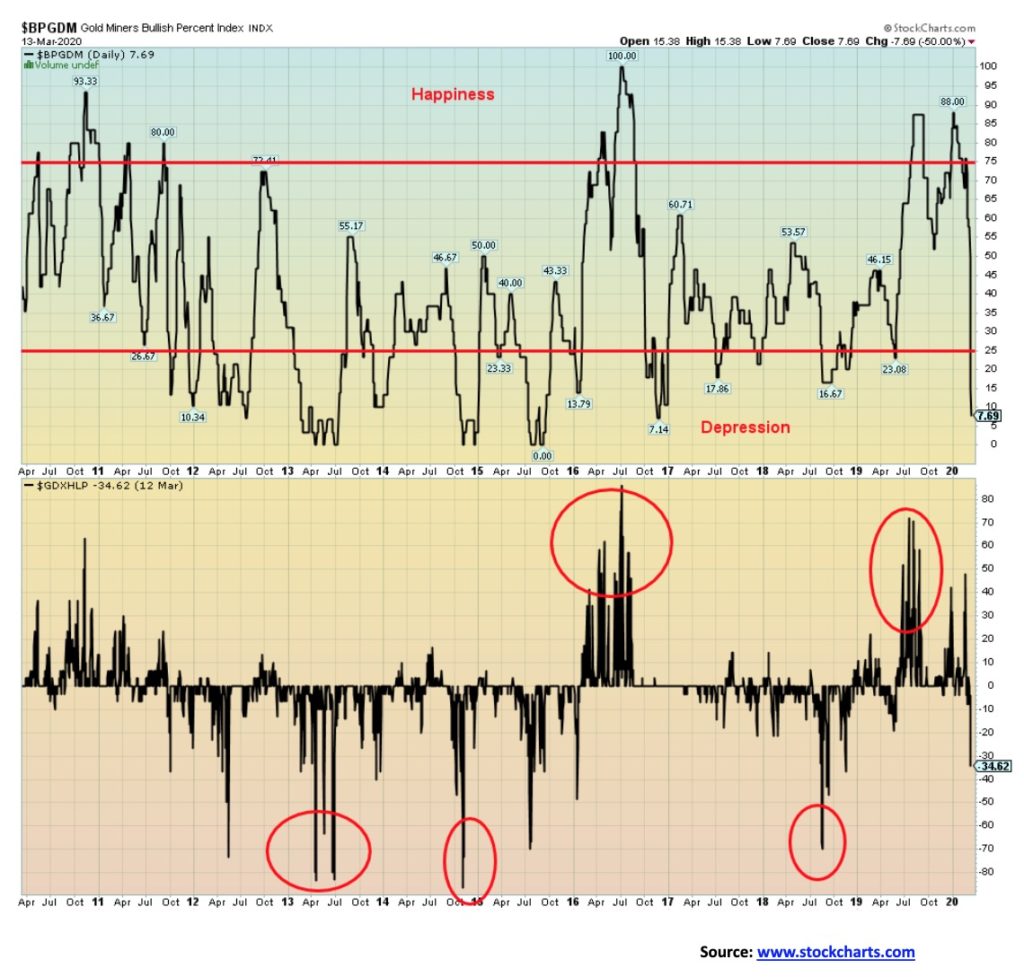
If there is a glimmer of hope for the crash of the gold miners this past week, it is the Gold Miners Bullish Percent Index (BPGDM) and the Gold Miners New Highs – New Lows Percent Index (GDXHLP). The BPGDM has fallen to 7.69 an extremely rapid decline from the high of 80 seen in early January 2020. The GDXHLP has also fallen below zero although it is not yet at what we would call extremes such as we saw in April/June 2013, October 2014, and August 2018. That suggests to us that we may not have seen a low just yet for the gold miners but it doesn’t rule out at least a tradeable corrective rally. Nonetheless, the changeover from bull to bear has been rapid.
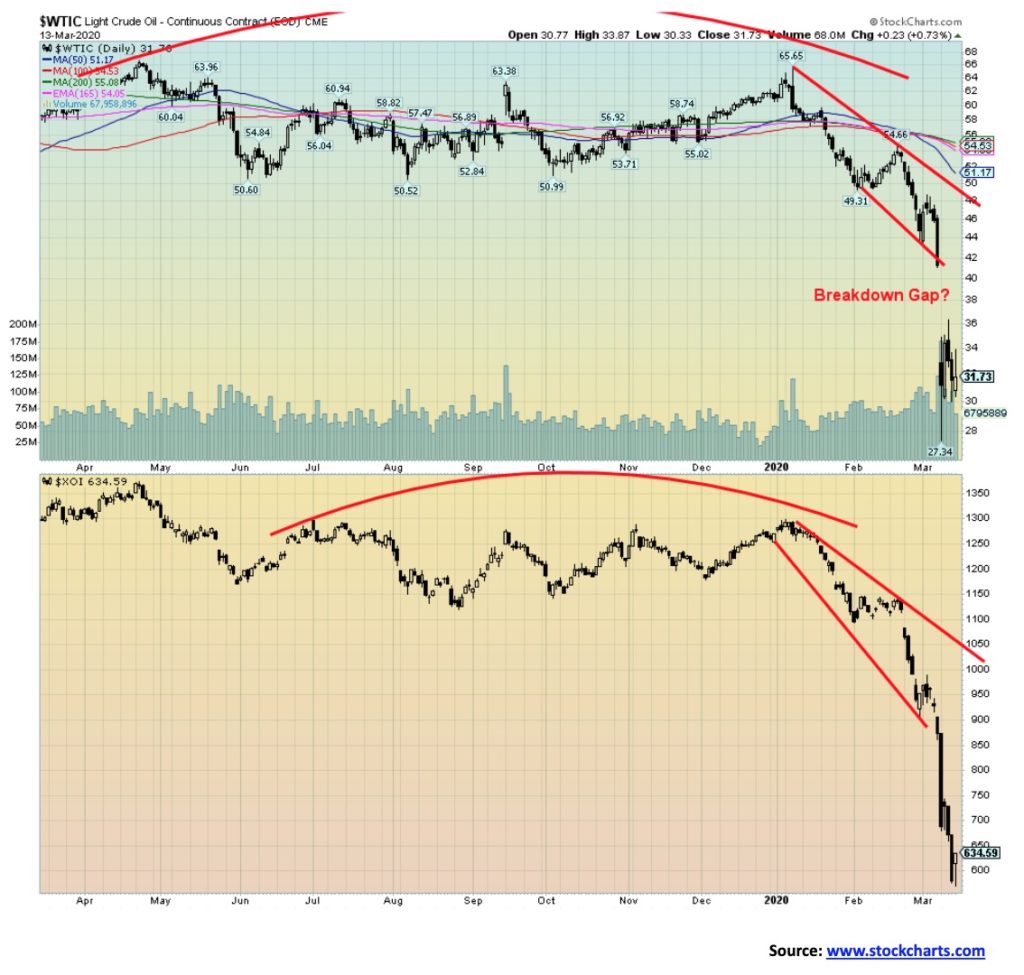
The 2020 crash of the oil market. WTI oil prices crashed 23.1% this past week and are now down 48% since the start of the year. Don’t expect them to recover any time soon as the price war intensifies between Russia and OPEC (Saudi Arabia). Both are pumping up supply just as demand has fallen sharply because of the coronavirus pandemic. Oh, there was a bit of bounce on Friday as the U.S. prepared an economic relief package, but against the backdrop of falling demand/rising supply relief is probably several months off. If there is a glimmer of hope for oil prices, it is once again rising tensions between the U.S./Iran/Iraq after the death of two U.S. soldiers and a British national from the ongoing bombing of the U.S. military installations in Iraq. The U.S. retaliated and the expectation is that there will be more attacks on U.S. military installations. That hasn’t yet shifted forecasts that are looking at maybe a $37 average for 2020.
Caught in the middle are U.S. shale producers and Alberta. Apparently, Russian companies can absorb prices down to $15/$20 before it bites badly. Saudi Arabia needs $80 to help balance its budget even if they can produce it for less than $5. Russia has good reason to bite U.S. shale companies, given sanctions against Russia, particularly Nord Stream 2 and Rosneft. U.S. shale producers need $40 to $80 or more.
The U.S. shale producers are laden with debt, although much of it doesn’t come due until 2021. Apparently, some $110 billion is considered distressed. There is at least $1 trillion outstanding. Sovereign downgrades of oil producers are likely to follow including Saudi Arabia, Iraq, Oman, Nigeria, and Angola in particular. Chevron has slashed its dividend by a whopping 86%. Energy stocks have been hammered with the Arca Oil & Gas Index (XOI) crashing 27.3% last week, down 50.1% on the year, and the TSX Energy Index (TEN) down 27.8% this past week and 55.8% on the year. Layoff announcements are already starting in energy companies in the U.S. and Canada and bankruptcies are sure to follow. Alberta’s budget has crashed as a result.
That’s a huge gap on the oil chart. Given the circumstances, filling it might prove extremely difficult in the weeks ahead. The $26.05 low of 2016 came close to falling this week with a low at $27.34. Prices falling into the teens would not be a surprise, given the ferocity of the price war and animosity between the Saudis and Russia. Of the two, Russia can withstand it the best. As to everyone else not so much. Consumers will enjoy low gas prices.
—
(Featured image by M. B. M. on Unsplash)
DISCLAIMER: This article was written by a third party contributor and does not reflect the opinion of Born2Invest, its management, staff or its associates. Please review our disclaimer for more information.
This article may include forward-looking statements. These forward-looking statements generally are identified by the words “believe,” “project,” “estimate,” “become,” “plan,” “will,” and similar expressions. These forward-looking statements involve known and unknown risks as well as uncertainties, including those discussed in the following cautionary statements and elsewhere in this article and on this site. Although the Company may believe that its expectations are based on reasonable assumptions, the actual results that the Company may achieve may differ materially from any forward-looking statements, which reflect the opinions of the management of the Company only as of the date hereof. Additionally, please make sure to read these important disclosures.


El Dorado Raises $9M to Expand Cross-Border Fintech Platform
El Dorado, a Latin American fintech improving cross-border financial services, raised a $9 million Series A led by Paradigm with...


Bitcoin Stalls Near $60K as Strategy Moves, ETFs Outflow, and EU MiCA Rules Take Effect
Bitcoin hovers near $60,000 with ETF outflows, while Strategy boosts reserves, sells BTC, and raises dividends to reassure investors. Ethereum...


Cannabis Dominates Global Drug Use: Trends, Risks, and Shifting Markets
Cannabis remains the world’s most widely used illicit drug, with 256 million users in 2024, surpassing all others combined. Growth...


Italy Approves First Hydrogen-Powered Train for National Rail Network
ANSFISA has approved Italy’s first hydrogen-powered train, the Alstom HMU214, for use on the Brescia–Iseo–Edolo line. Capable of 140 km/h,...


Cotton Market Weakness Persists Despite Brief Rebound
Cotton prices fell to new lows last week before a modest rebound. USDA data shows crop conditions remain worse than...
 |
|
 |  |
 |
|
-

 Crypto2 weeks ago
Crypto Market Stays Stable as Bitcoin and Ethereum See Mild Declines
-
 Impact Investing23 hours ago
Italy Approves First Hydrogen-Powered Train for National Rail Network
-

 Fintech1 week ago
Mollie Expands Across EEA With €350M Investment to Strengthen European Payments Network
-

 Cannabis2 weeks ago
Europe’s Cannabis Shift: Rising Use, and New Risks