Featured
How are the markets reacting to the Coronavirus
A week ago, the markets thought the end was nigh as the coronavirus scare gripped the world. Now, not so much; even as coronavirus grows, the feeling is it is coming under control, the economic fallout can be contained, and even a cure might be found. Everything, including coronavirus, it seems, can be solved by just injecting billions into markets. China did it.

The markets have had a tough time reacting to the Coronavirus but there’s more going on than that. The predictions of men like Jim Rickards shed some light on how the market will react but the real truth is in the data.
So just who is Jim Rickards? Jim Rickards is an American lawyer, speaker, gold speculator, media commentator, author on finance, and a precious metals expert. His books include Currency Wars (2011), The Death of Money (2014), The New Case for Gold (2016), The Road to Ruin (2016), and Aftermath (2019). Rickards has been on Wall Street for 35 years. He was general counsel for the hedge fund Long-Term Capital Management (LTCM), the giant hedge fund at the center of the 1998 Russian collapse that almost brought down the global financial system. He has, in the past, been an advisor with the U.S. government. He is either known as a genius or an “the end is near” charlatan. Take your pick.
We mention Rickards as the dysfunction of the U.S. was on full display at the State of the Union address on February 4, 2020 with President Trump’s refusal to shake hands with Nancy Pelosi, the Speaker of the U.S. House of Representatives and her ripping up of Trump’s State of the Union address and tossing it. Pelosi is third in line for the presidency if anything should happen to Trump and Vice President Mike Pence. As Rickards goes on to say, “there is no middle ground. Either Trump will subdue the progressives or he will leave office early. Either outcome will prove highly disruptive to the normal political and economic functioning of the United States.”
So, what does this mean for the markets? A week ago, the markets thought the end was nigh as the coronavirus scare gripped the world. Now, not so much; even as the coronavirus crisis grows, the feeling is it is coming under control, the economic fallout can be contained, and even a cure might be found. While the U.S.’s economic numbers are well short of Trump’s much ballyhooed 3% growth, U.S. GDP growth still tops G7 members and most OECD members. As to a cure for coronavirus, even WHO has said they are not even close.
Everything, including coronavirus, it seems, can be solved by just injecting billions into markets. China did it. The U.S. continues its repo program. The ECB and BOJ are in an endless injection program. There are even rumors of another Fed rate cut surfacing in order to combat any negative effects of coronavirus. The central banks are ready, aimed, and fired to save us all. But can they? If endless boxes of money—helicopter money, some call it—are the answer than what exactly is money worth? Not much.
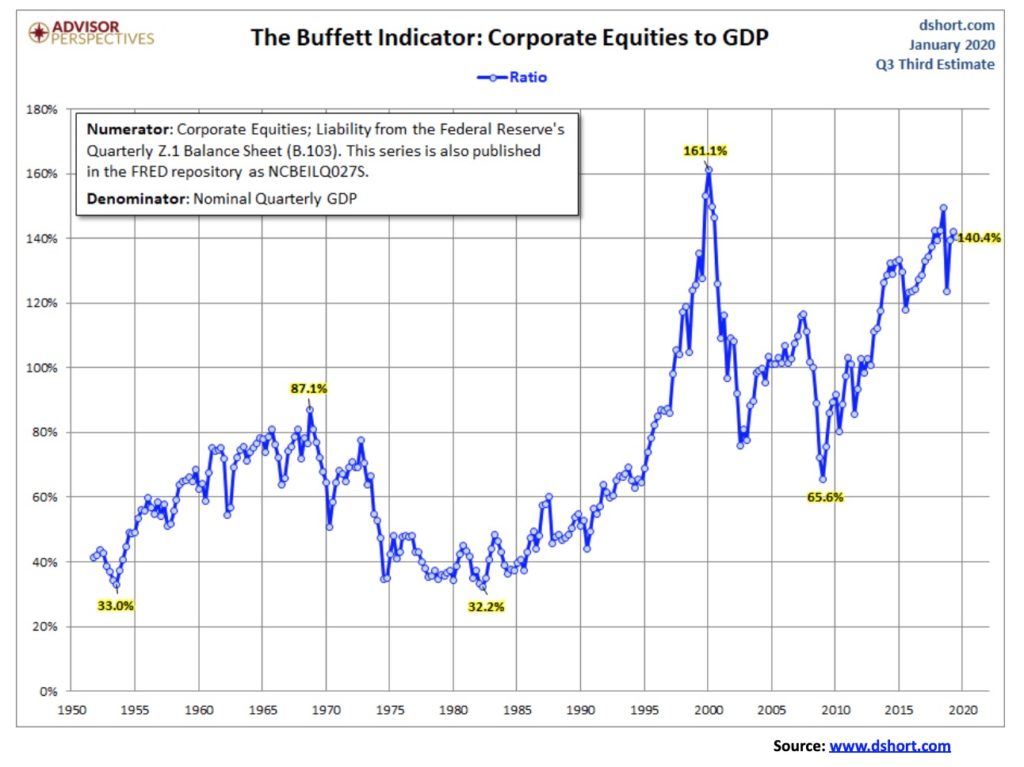
But stock markets and house prices keep going up and up. All that money chasing limited goods. The stock market has rarely been this overvalued. The chart of the Buffett Indicator, Corporate Equities to GDP, has only been higher than this once before: at the peak of the high-tech/dot.com bubble in 1999–2000. The chart below is as of early January. The indicator is actually higher now, at 152.3%. It is not a sustainable level. But are stock markets about to fall? Seems not.
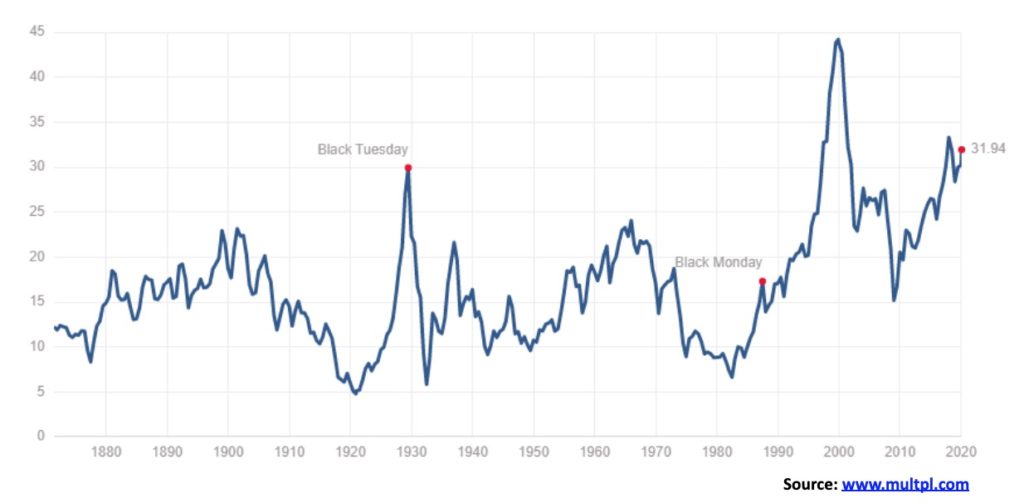
The Shiller PE Ratio is also at or near its highest level since the high-tech/dot.com bubble. It is even higher than it was at the top before the financial crisis of 2008 and the stock market collapse of 1929 that led to the Great Depression. Again, this is not a sustainable level. However, despite the lofty heights of these two indicators, this is not a guarantee that the market is about to collapse. In fact, it could go even higher. Such is the nature of bubbles fueled by oodles of cash.
If only it were all so simple. The Chinese economy is imperiled. China makes up 17% of global GDP. S&P says that China accounts for a third of global growth. China is a key player through four key channels: commodities, capital goods, integrated supply chains and tourism. It is estimated that upwards of 80% of its manufacturing has been closed—90% if you count exporters. In other words, the Chinese economy has already been severely disrupted. China’s economy is interlocked with the world, so eventually this spills over to everyone else, even if they have not been hit hard by coronavirus (continued following charts below).
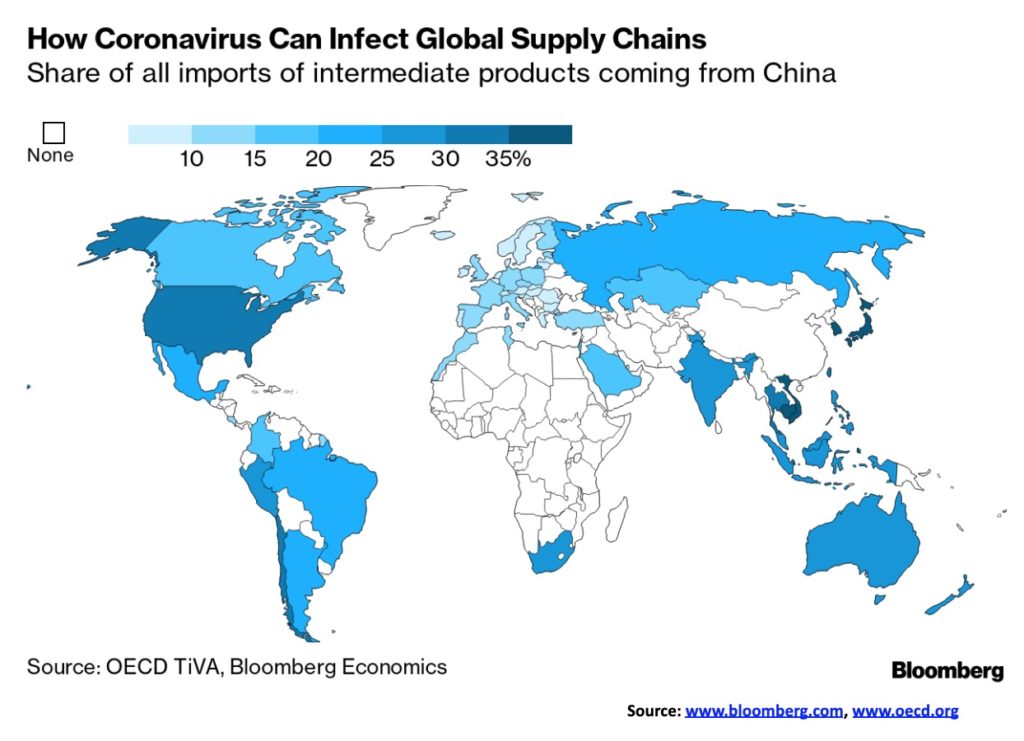
It is interesting to note that China was only about 4.5% of the global economy during the SARS outbreak. The negative fallout from coronavirus is expected to far exceed that of SARS. While the major impact is China, it is spilling outside its borders as supply chains dry up (see chart below). Hyundai, as an example, has closed plants in South Korea because they can’t get the supplies they need from China. Others impacted include auto makers Tesla, GM, Toyota, and Volkswagen whose plants in China have closed. Apple is also experiencing fallout. Oil prices have taken a big hit because of a drop in demand estimated at 3 billion barrels a day in China. OPEC is grappling with cuts to keep the price up. Capital is flowing out of China despite tough controls on the part of PBOC.
While the equity markets appear to be shrugging off the crisis for the moment, we note that the junk bond market is acting very jittery. The corporate bond market, both in the U.S. and globally, is an accident waiting to happen. The amount of BBB-rated bonds (the lowest investment grade) in the U.S. is five times what was outstanding in 2008. According to the IMF, there is some $19 trillion of corporate debt at risk in the event of another global recession. The IMF said that some 40% of the corporate debt in just eight countries—U.S., China, Japan, Germany, Britain, France, Italy and Spain—would be impossible to service if there was a downturn just half as serious as that seen during the 2008 financial crisis. A flurry of downgrades could devastate the market and spark a selling panic. The coronavirus is spreading at a rate that could see it double every 6.4 days, according to some estimates. While the human tragedy is bad enough, what the world should really fear is a tsunami of economic contagion as a result of the fallout. And against this backdrop, the U.S. is at war with itself.
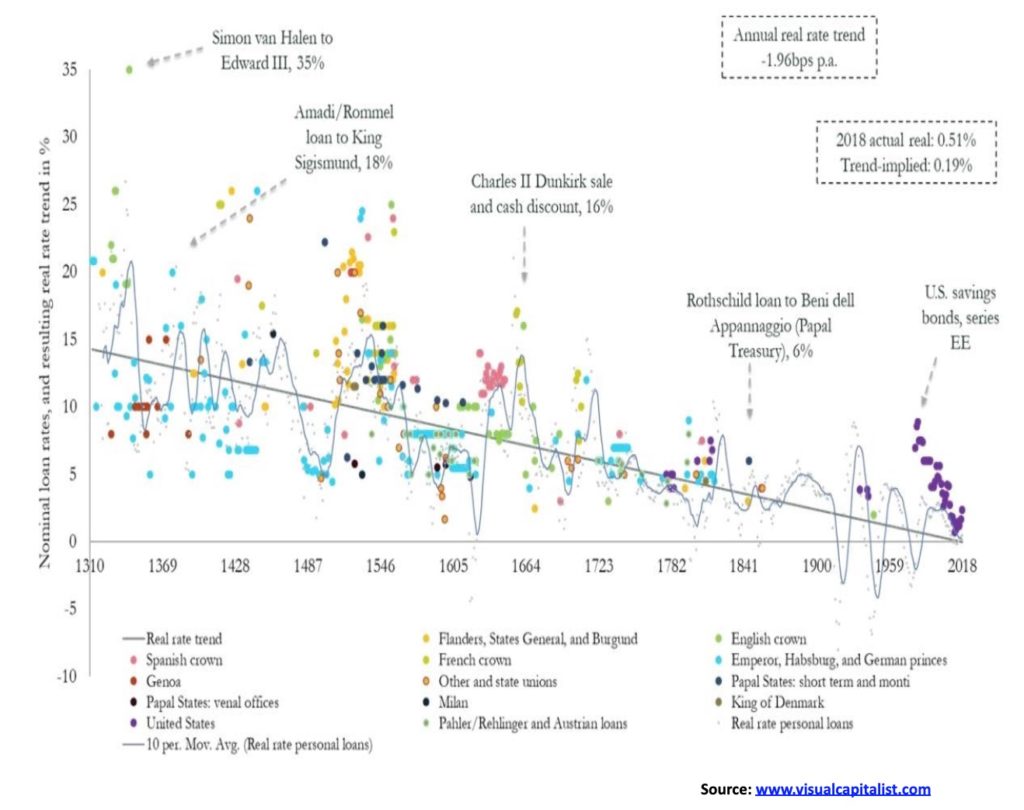
This is a fascinating chart that we thought we’d show. The full story can be found here. According to Bank of England (BOE) scholar Paul Schmelzing, interest rates have been falling by an average annual decline of -0.0196% (1.96 bp) through the last eight centuries. These are real rates, defined as the nominal rate of interest less inflation.
Schmelzing attests this phenomenon to three reasons:
- Productivity growth – productivity growth has been slowing. We have shown in the past that GDP growth has slowed over the past 50 plus years, the labour force participation rate is falling, and wage growth has slowed. As well, business investment growth has slowed. All that combined makes for lower demand for capital and thus lower interest rates.
- Demographics – the population is aging and fertility rates are falling. This results in higher savings rates, longer life expectancy, and lower labour force participation rates, all of which creates downward pressure on real interest rates.
- Economic growth – GDP growth in the OECD countries has fallen from 4.3% in 1961 to 3% in 2018 (and probably even lower now). Some have referred to it as “secular stagnation.”
However, falling interest rates have unintended consequences. Here is our own assessment:
- Negative interest rates – negative interest rates were unleashed to supposedly stimulate moribund economies, particularly the EU and Japan. Except it is not exactly working. The EU’s growth in 2019 is projected at 1.2%, Japan at 0.8%. Despite higher interest rates (which attracts capital from elsewhere) the US’s projected 2019 growth is 2.3%. The ECB and BOJ have become the biggest buyers of the negative interest rate debt. It has encouraged massive debt growth with nothing to show for it. Pension funds and others are forced to buy these bonds (for safety reasons) and they are paying for the privilege of owning them, thus leaving them short to service their needs. Negative interest rate bonds peaked at around $17 trillion but are now down to around $12 trillion. The ECB and the BOJ are both in trouble. The ECB could even go bankrupt.
- Bubbles – bubbles, bubbles, everywhere. Cheap money encourages borrowing and we are a world awash in debt estimated at over $250 trillion, up roughly $100 trillion since the 2008 financial crash. All that money goes somewhere, whether it is the stock market, housing, or just buying things. Corporations buy back their own stock and finance it with cheap borrowed money. When the music stops, there will be a reckoning. And history suggests that eventually the music stops. And no, in the end the central banks cannot save us as they are part of the problem.
No wonder the Fed can’t allow interest rates to rise. When they threatened to rise last September, the Fed stepped in with its repo program. Many wrongly connect it with being QE4. Instead, it may be more closely connected with the fact that the Fed cannot allow interest rates to rise. In a world awash in debt it could prove deadly. And, as we suspect, there is a potentially serious credit problem out there. Our suspicions lie in either the EU or Japanese banking system. We have consistently noted that the world cannot afford nor would it survive another financial crisis on the scale of 2008. Yet debt has exploded, along with increasingly lower interest rates. Another financial collapse will not be bailed out as it was in 2008 by the taxpayer. Governments know the taxpayer is tapped out. Instead, bailouts are to be replaced by bail-ins—meaning it will be depositors and bank debt holders who will pay the price.
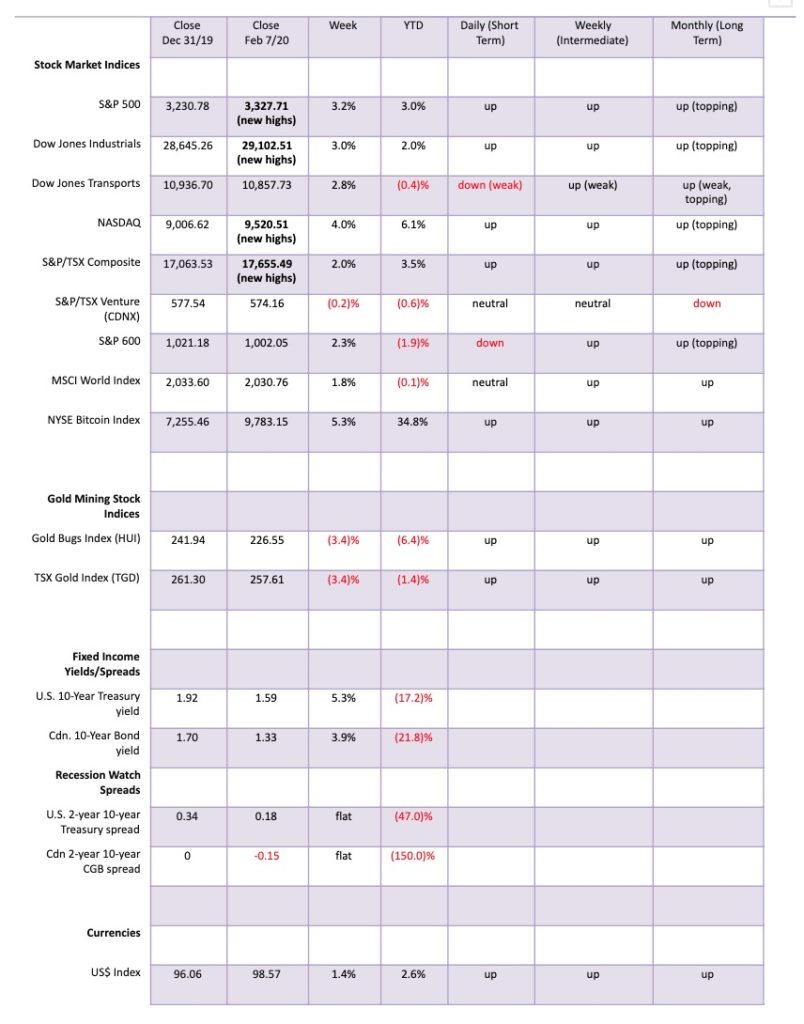
It was a wild volatile week to the upside as the coronavirus scare appeared to be pushed aside and the market instead focused on some good economic numbers. At least they did until the end of the week when the stronger than expected nonfarm payrolls came out and the market, instead of rallying further, turned down with the S&P 500 losing 0.9% on the day. However, on the week the S&P 500 gained a strong 3.2%, turning what had been a souring month of January into a week of euphoria as the markets recovered. The S&P 500 also made new all-time highs—again. Joining the S&P 500 in the new all-time highs were the Dow Jones Industrials (DJI), up 3.0% and the NASDAQ, up 4.0%. Others joining the all-time list were the NASDAQ 100, the S&P 100 (OEX), and the Wilshire 5000. Notably, the S&P 400 (mid caps) and S&P 600 (small caps) did not make new all-time highs.
Elsewhere, the TSX Composite made new all-time highs, gaining about 2.0% on the week but the TSX Venture Exchange (CDNX) continued its woes, losing 0.2%. Overseas in the EU, the London FTSE was up 2.6%, the Paris CAC 40 gained 2.8%, while the German DAX was up 3.2%. None of them, however, made new all-time highs. In Asia, the Shanghai Index (SSEC) lost 3.7% but that was quite a comeback from being down over 9% at one point (coronavirus, what coronavirus?). The Tokyo Index (TKN) gained 2.9% while Taiwan was up 1.1% and Hong Kong’s Hang Seng gained 4.2%. It should be pointed out that the Asian indices all gapped sharply down this past week and the rebound was merely what we call the “dead cat bounce” and an attempt to fill the gaps. They may have succeeded and, if the focus turns once again to the economic calamity befalling the coronavirus crisis, they may well resume their downward trend this coming week.
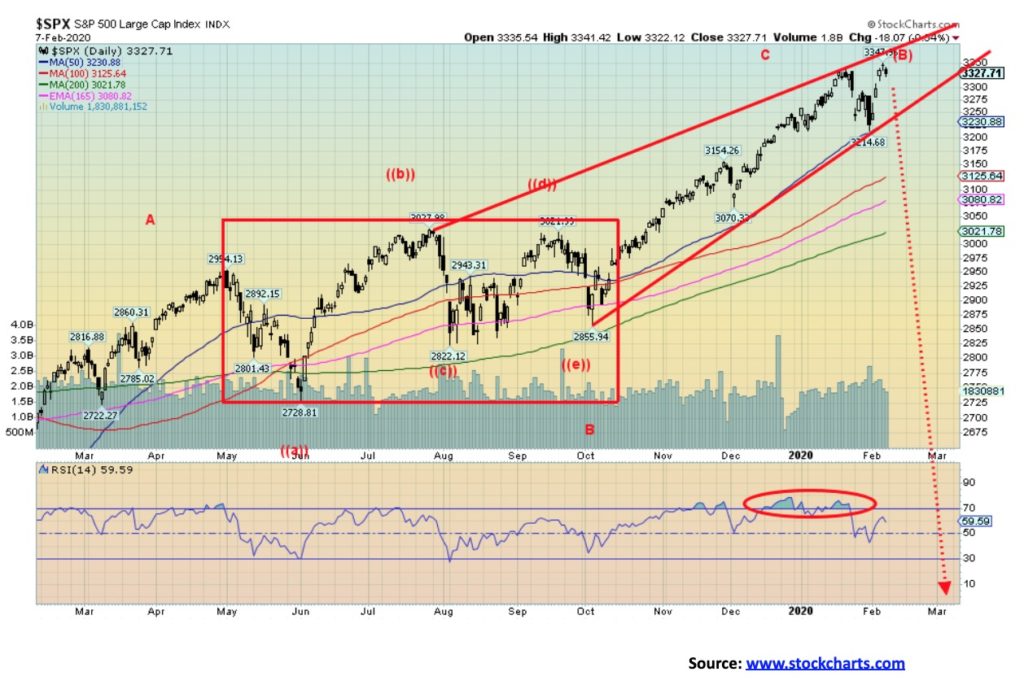
One could say the same for the North American indices, given Friday’s negative response to the above expectations job numbers. Key to watch is the uptrend line from the October 2019 low, currently near 3,240 followed by the recent low near 3,215. A break of 3,200 would confirm we are headed lower. Major support is down to 3,000. Below that, a bear market could get underway. New highs might only be temporary as there is good resistance up to 3,380 and possibly to 3,400. There are numerous indicators suggesting we are at or near a top, but in saying that we recognize every time we say that we suddenly make new highs once again. The NYSE advance-decline line is still positive, but by the week’s end was making small divergences with the price action. Unfortunately, the divergences aren’t strong enough to suggest a top. The VIX volatility index is making clear negative divergences with higher lows, even as the S&P 500 makes higher highs. The McClellan Summation Index ratio-adjusted (RASI) is at 650 so it is still positive. The number of stocks making new highs continues to decline even as the index keeps climbing. Ditto for the number trading above their 200-day MA. It’s actually falling as the index goes higher, another divergence. The put/call ratio briefly jumped into more puts than calls territory, but by the week’s end it was firmly back with more calls than puts. The negative signs are there, but is anybody heeding them?
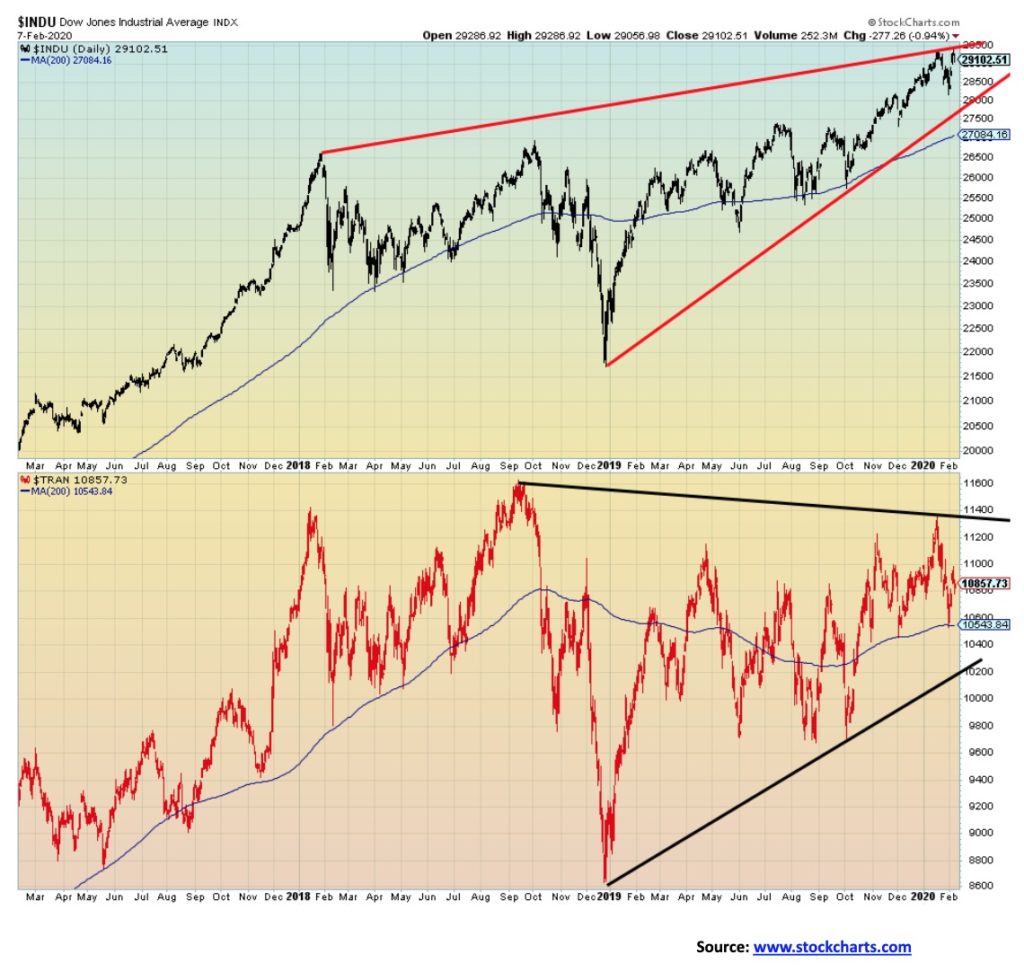
We keep emphasizing the non-confirmation divergence between the Dow Jones Industrials (DJI) and the Dow Jones Transportations (DJT). Dow Theory is clear—the averages must confirm each other. They aren’t even close. The DJI makes new all-time highs, the DJT can’t even recoup the January 17 high, let alone recoup the all-time high seen back in August 2018. The coronavirus hasn’t been kind to the DJT, given the hurt that airlines, shipping companies, and giant tourist-carrying cruise ships are feeling. The DJT appears to us to be forming a giant symmetrical triangle. Now, symmetrical triangles can act as consolidation patterns, but they also appear as tops and bottoms. If this is a consolidation pattern, then the DJT would break out above 11,360 and potentially project up to over 14,000. We doubt that somehow as many indicators are suggesting instead this is a major top. The breakdown zone is at 10,200 and could project down to 7,200, a decline of 33.5% from current levels. A break back under 10,500 would be the first sign of trouble. We also note what could be huge ascending wedge forming on the DJI. We are not as firm on that one, but if it is then the breakdown zone is at 27,700 and could project down to the 2018 lows near 21,700. Now, that would catch a few people’s attention. New highs above 29,500 would at least temporarily end that discussion.
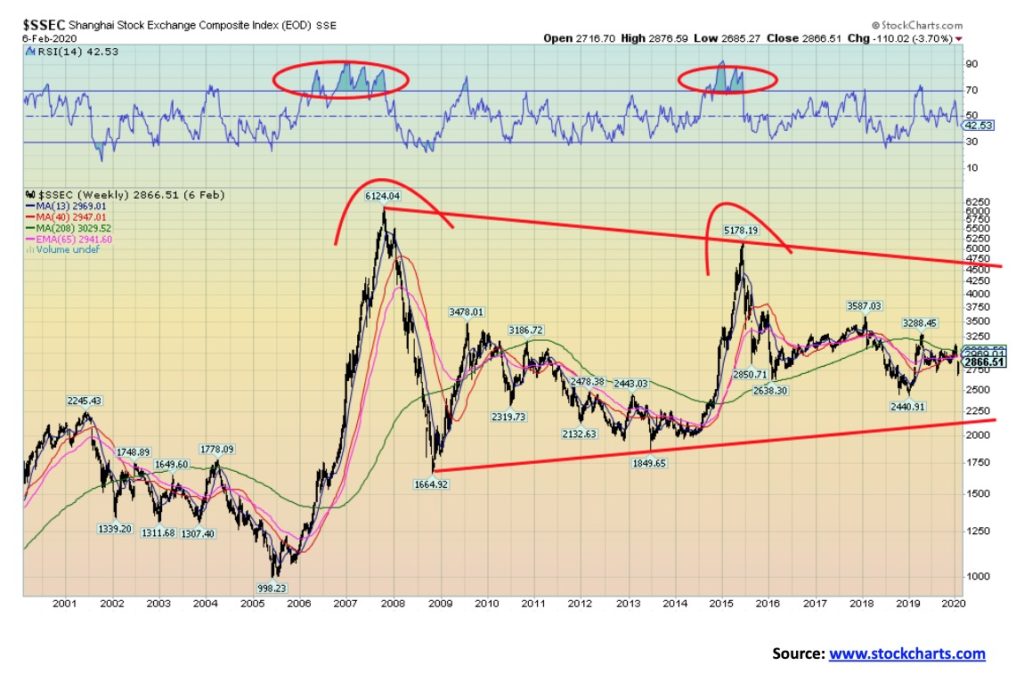
Asian markets in particular are nowhere near their former highs. The Shanghai Stock Exchange (SSEC) is a classic example. The SSEC topped back in 2007 at 6,124. Today it sits at 2,866 down 53% from that high seen 13 years ago. Yes, there have been some funds flow out of Asian markets into U.S. markets. But if China were doing so well, why is their stock market doing so poorly? It has never really recovered from the 2008 financial crash. And this despite the billions of yuan that PBOC has pumped into markets to help maintain China’s GDP and, by extension, its markets. Thanks to Brahm for noting this divergence.
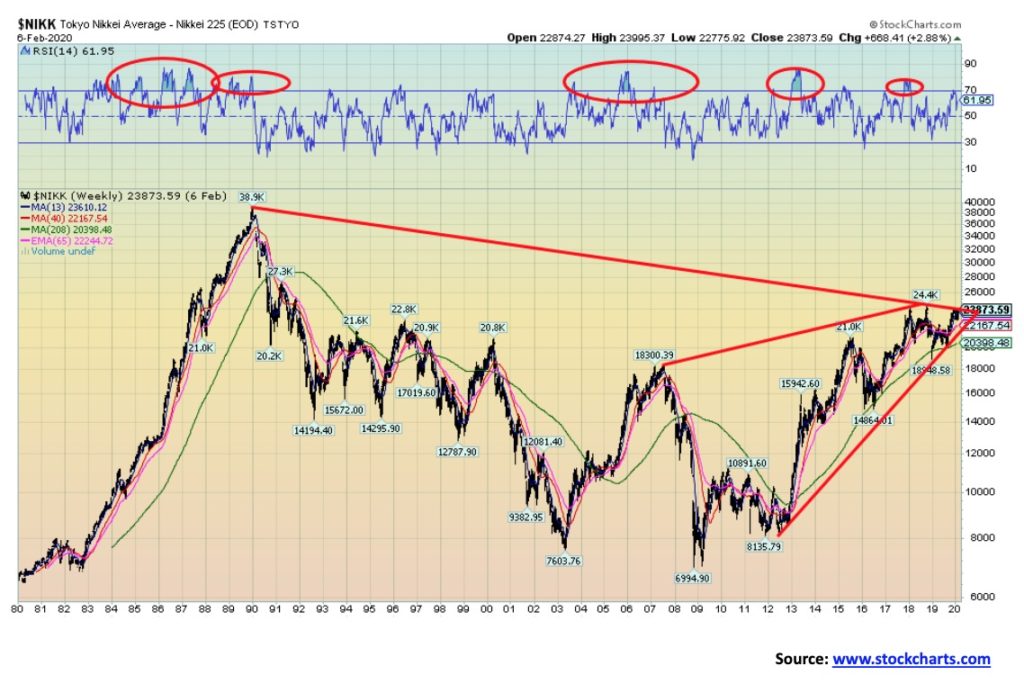
Asian stock market debacles, Part 2. The grand-daddy of all markets, never recovering to its former highs, is the Tokyo Nikkei Dow (TKN). At 23,874 the TKN remains down 38% from the bubble high of January 1990 which was 30 years ago. The TKN has exceeded the length of time it took the DJI to recover from the 1929 stock market crash and Great Depression. The DJI took 25 years. That could be an ascending wedge triangle forming. If that is the case, then the TKN could be preparing for another great tumble. Breaking firmly under the 4-year MA currently near 20,400 could send the TKN crashing back to 10,000.
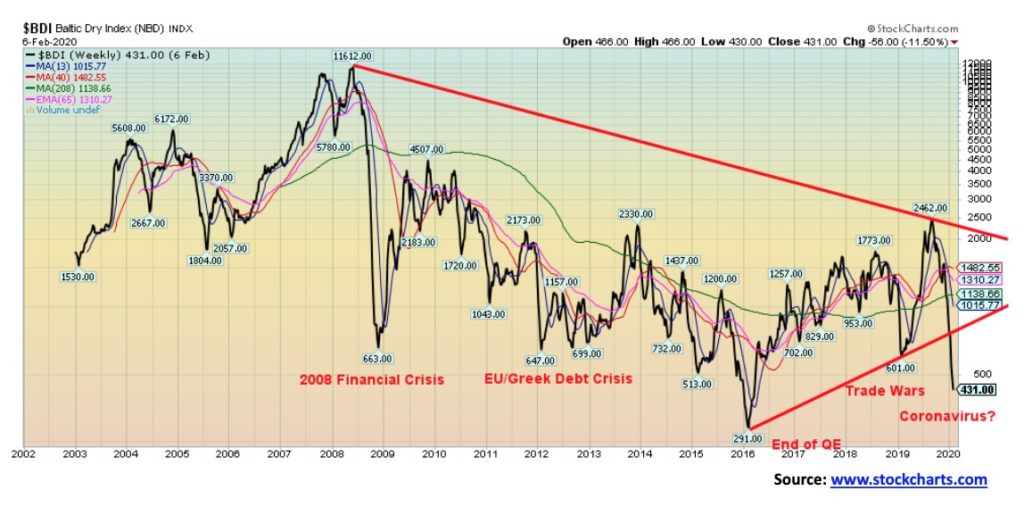
We have to be amazed at the collapse of the Baltic Dry Index (BDI). It is now down over 82% since peaking in August 2019. Forget about where it was in June 2008. It is down 96% from that lofty level. World trade is contracting at a remarkable rate, on par with the collapse during the 2008 financial crisis. And we don’t even have a financial crisis yet. Forget that the U.S. and China signed a Phase 1 trade deal. We have noted that the agreement could already be in trouble because of the coronavirus crisis. The Baltic Dry Index (BDI) is a proxy for dry bulk shipping stocks worldwide and acts as general shipping market bellwether. It is issued daily by the London based Baltic-Exchange.
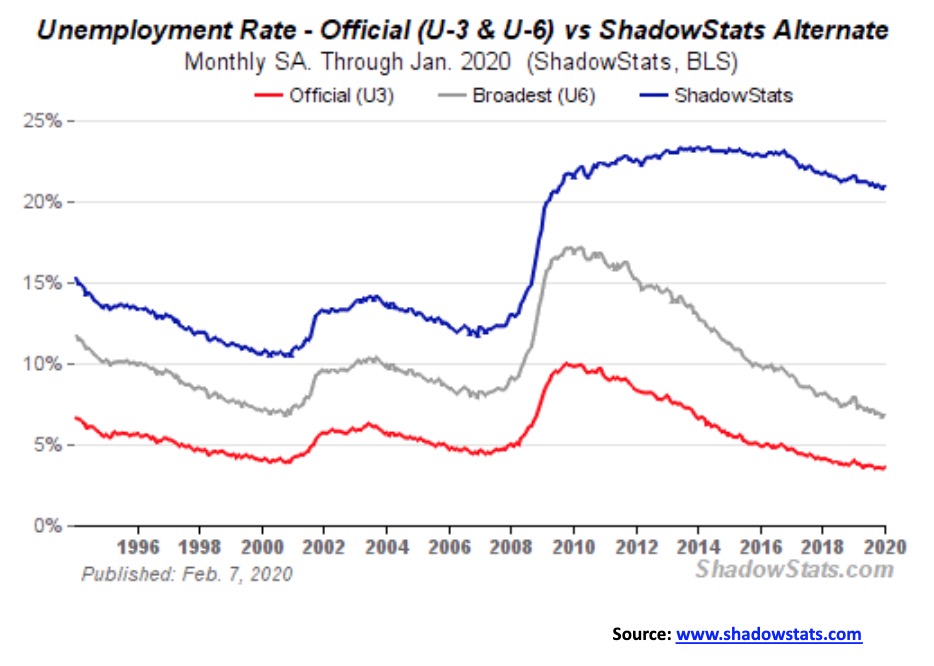
It’s that time of month and the U.S. employment numbers are out. The January non-farm payrolls surprised to the upside, reporting that 225,000 jobs were created. The market had expected only 160,000. According to the Bureau of Labour Statistics (BLS), the most notable job gains were seen in health care, construction, transportation, and warehousing. The gain compared with an average gain per month of 175,000 in 2019. The unemployment rate (U3), however, rose to 3.6% from 3.5%. This was largely due to more people looking for work as the BLS reported that the labor force participation rate jumped to 63.4% from 63.2%. Despite the gain, it remains down sharply from the 67.3% peak reported in 2000. The higher the participation rate, the higher the unemployment rate. The U6 unemployment rate, the BLS’s broadest measurement that includes short-term discouraged and other marginally attached workers, as well as those forced to work part-time because they can’t find full-time employment, rose to 6.9% from 6.7%. Shadow Stats unemployment rate that is U6 unemployment plus long-term discouraged workers defined out of official existence back in 1994 rose to 21.0% from 20.8%. Of the three measures of unemployment, the Shadow Stats numbers are the one that has fallen the least since the highs of the 2007–2009 Great Recession. It is really measuring chronic unemployment in the U.S. economy, even as the official numbers look great.
The number of people not in the labor force fell to 94,896 thousand from 95,625 thousand, a decline of 729 thousand. Of that total, 54,278 thousand are listed as retired and 9,925 thousand are listed as disabled. 36,556 thousand Americans are reported as living in poverty, some 11% of the population. In a separate release, the BLS released revisions to employment statistics for 2019. In its release they revised downward by 514,000 the nonfarm payrolls for 2019. We have noted in the past that the nonfarm payrolls can be revised months later and the usual is downward revisions. That’s equivalent to roughly 42,800/month. This revision has negative consequences for retail sales and GDP for 2019 as well. Expect downward revisions. Annual revisions have lowered Trump’s employment gains to 2.3 million in 2018 vs. the original 2.68 million reported. Gains in 2017 and 2019 were about 2.1 million in each year. In Obama’s final year the gain was 2.35 million.
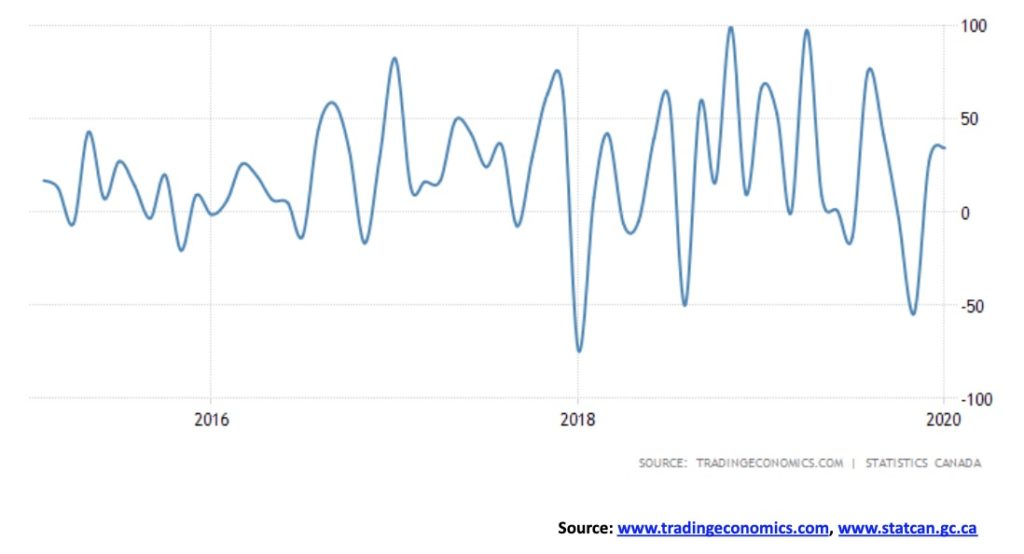
Canada added 34,500 jobs in January 2020 after creating 27,300 jobs in December 2019. The market had expected a gain of 15,000. Full-time work leaped 35,700 while part-time work fell 1,200. The gains were seen in construction, agriculture, and manufacturing. Declines were seen in health care and social assistance. The unemployment rate fell to 5.5% from 5.6%. The labor force participation rate fell to 65.4% from 65.5%, contributing to the fall in the unemployment rate. Quebec saw the largest gains in employment up 19,000 while Alberta lost 19,000. Ontario gained 15,900.
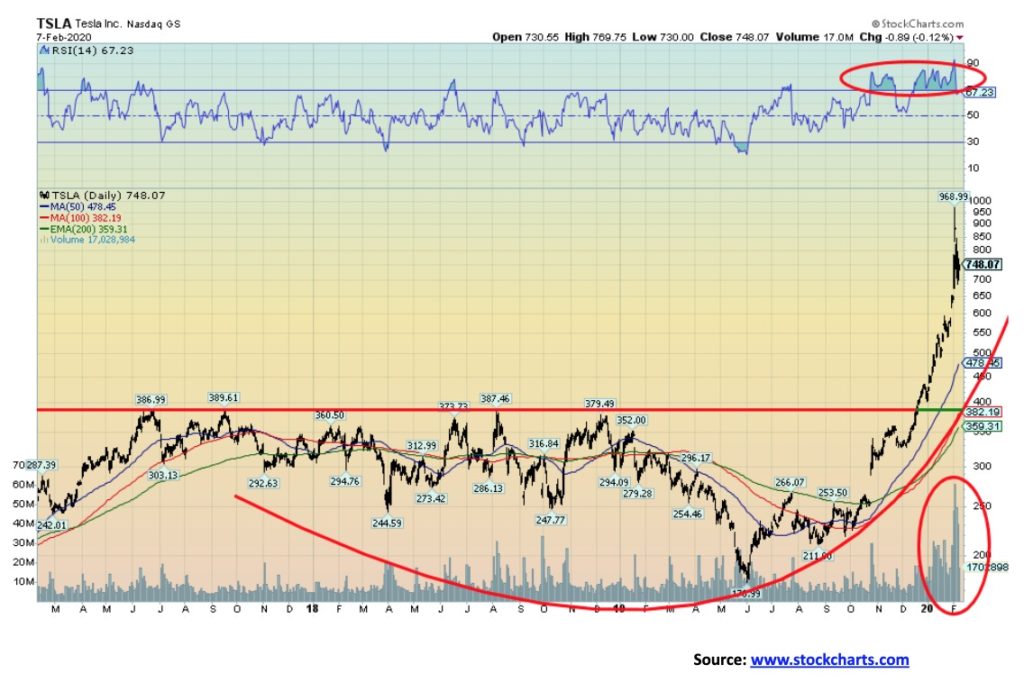
It’s a bird. It’s a plane. No, no it’s Tesla (TSLA). Since bottoming last May 2019 near $177 TSLA has been on a tear, rising at the peak an incredible 450%. It reminded us of the high-tech/dot.com bubble days of late 1999/early 2000. When something goes parabolic like this one, just has to remember if you have a profit take it and get off the train because an out-of-control train often ends in a wreck. TSLA didn’t hold and by week’s end it was down $220 from the high, or almost 23%. The peak was made on huge volume (no surprise) and massive euphoria. It is noteworthy that not even CEO Elon Musk could figure out why it rose so much. But it was a crazy ride. Sure, TSLA reported better than expected earnings but it didn’t justify this. No one, it seems, could explain this crazy ride. That’s a warning sign. A fall back to the 50-day MA near $478 wouldn’t surprise us. That would be a 50% haircut from the top. A lot of people are going to be left with tears. For others, hopefully, they got off the elevator, even if it wasn’t at the top floor.
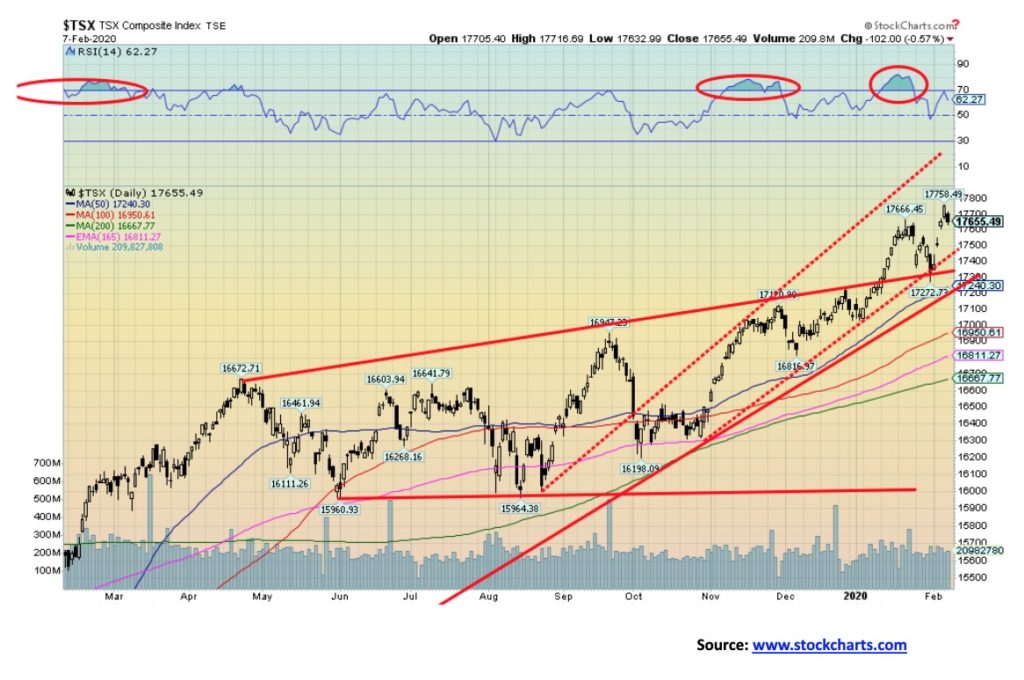
It was just another new all-time high for the TSX Composite this past week. The TSX joined U.S. indices in making new all-time highs once again. However, on Friday, despite the positive job numbers in both Canada and the U.S., markets sold off. We might say it was buy the rumour sell the news. Rumour—the economy is great; news—the job numbers were great. But yes, then what about the coronavirus crisis? Of the 14 TSX sub-indices, 10 were up on the week with 4 down. Leading the way to the downside was Health Care, off 4.2% and Golds, down 3.4%. Materials and Metals & Mining also lost. Of the 10 to the upside, 7 made new all-time highs. Leading the way was Information Technology, up 3.1%. Others making new all-time highs besides Info Tech were Income Trusts (+2.0%), Financials (+3.0%), Industrials (+2.7%), Real Estate (+2.3%), Telecommunications (+2.1%), and Utilities (+1.5%). Rounding out the winners were Consumer Discretionary (+1.6%), Consumer Staples (2.1%), and Energy (+0.2%). All in all, a great week for the TSX and the bulls were cheering. We are now seeing negative divergences between the price action and indicators across the dailies and the weeklies, although not yet on the monthlies. It’s a warning, not necessarily a sign of a top. The TSX breaks under 17,400 and again under 17,250. Major support is seen down to 16,600/16,700. Only new highs keeps this bull alive. This past week ended on a huge note of elation and euphoria. But will it last?
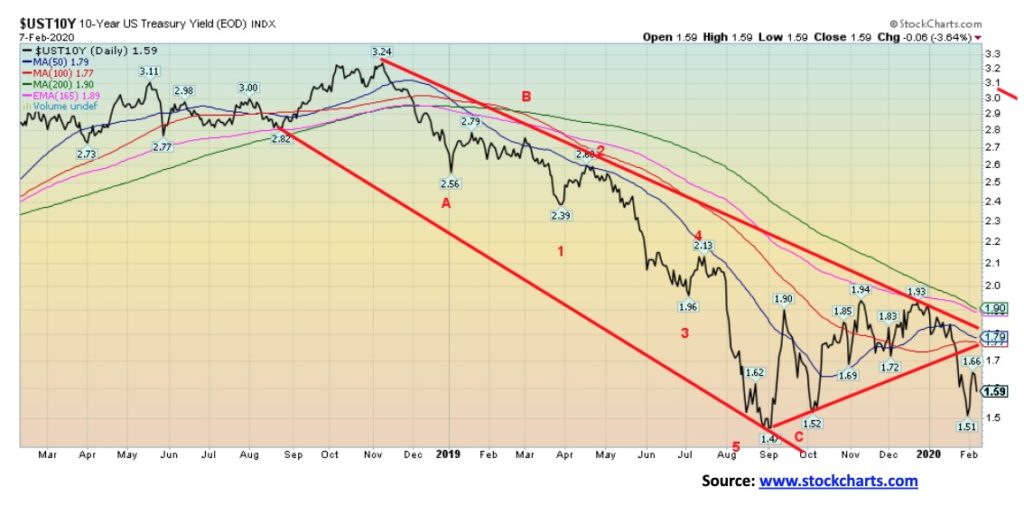
The U.S. 10-year treasury note rose in yield this past week to 1.59%, up from 1.51% the previous week. Stronger than expected economic numbers this past week helped hike rates. The stronger economic numbers came in droves this past week. The ISM manufacturing PMI for January was 50.9 vs. an expectation of 48.5 and up from Decembers 47.8. It was a surprise and suggested a revival in manufacturing. Anything above 50 shows expansion. But the NY manufacturing index came in at 45.8—still recessionary, but a big jump from the previous month. Factory orders jumped 1.8% vs. an expectation of 1.2% and up from the previous month’s 1.2% contraction. The ISM services PMI was 55.5 vs. 54.9 the previous month and an expectation of 55. ADP employment gains were a big surprise, up 291,000 vs. 199,000 for December and an expectation of 156,000. Finally, the non-farm payrolls (discussed above) came in a surprise 225,000 vs. an expectation of 160,000 and last month’s 147,000 gain. Put it all together and bond yields rose, while prices fell (prices move inversely to yields). The Fed continued its repo program, which shows little signs of abating. The 10-year needs to take out 1.80% and especially above 1.90% to suggest to us that a more serious rise in interest rates is underway. The Fed does not want to see rising interest rates, especially in an election year. Otherwise, we could still see a further test of the 1.47% low of August 2019. The coronavirus crisis and its possible economic fallout has not yet run its course.
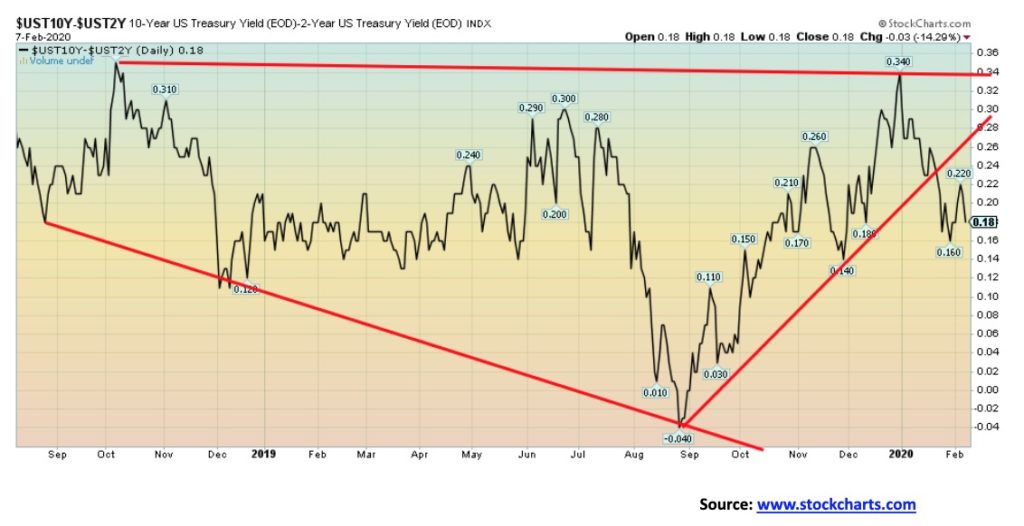
Our closely watched 2–10 spread (U.S. 2-year treasury notes less U.S. 10-year treasury note) was unchanged this past week. It slipped briefly to 16 bp before rebounding. Stronger economic numbers help widen the spread. The other spread we follow. the 3mt–10 spread (U.S. 3-month treasury bills less U.S. 10-year treasury note) rose to +3 bp after closing the previous week at minus 4 bp. Both spreads had at one time been quite negative with the 3 mth–10 spread hitting a low of minus 52 bp back in September 2019. A negative yield curve is often a precursor to a recession, but the recession probabilities didn’t firm up until the spreads turned positive again, which they have.
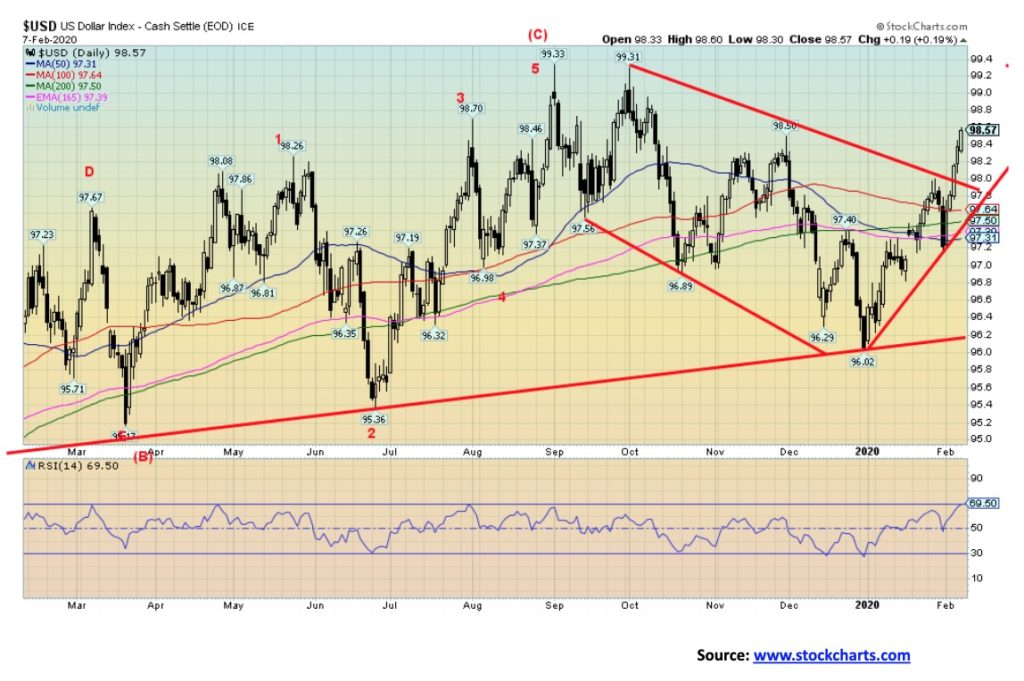
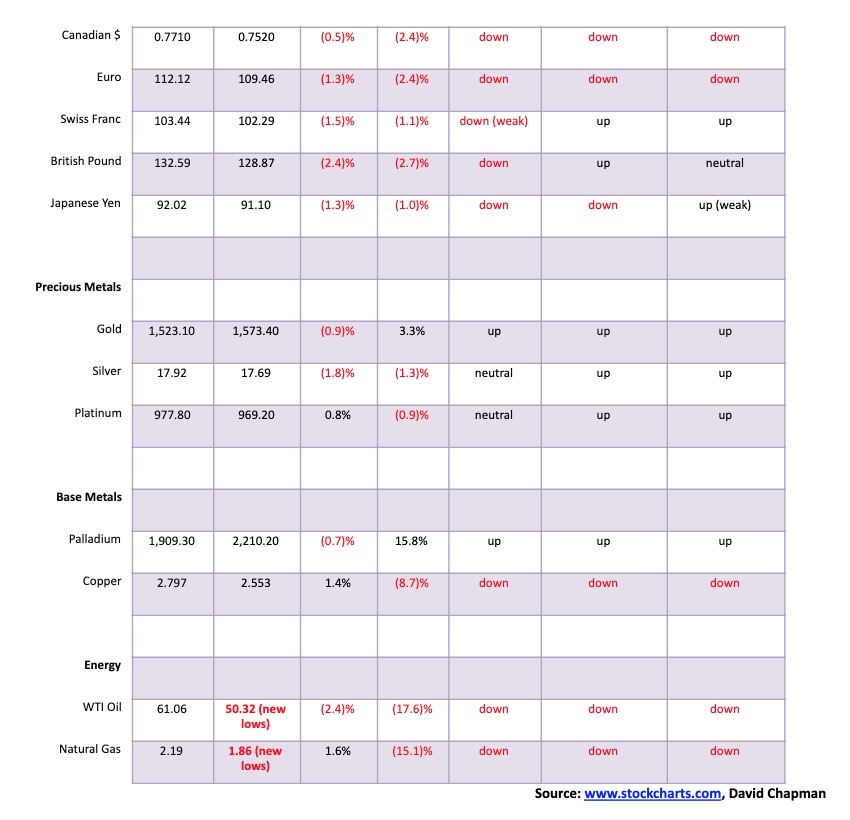
Stronger economic numbers, the coronavirus crisis coupled with capital outflows from China and elsewhere are helping to push the U.S. dollar to higher levels. The US$ Index rose to 98.57 this past week, breaking above the downtrend line from the 99.31 high. The coronavirus crisis is sparking some outflow of funds into U.S. securities, both equity and bonds. The stronger economic numbers continue as a surprise, particularly the strong job numbers seen on Friday. It was estimated that some $32.8 billion apparently flowed out of China in January, mostly into U.S. dollars. That was despite draconian controls put on by PBOC. Most of it came in the last 10 days. But that was far short of the apparent $110 billion that flowed out in 2015–2016 during the yuan currency crisis at the time. But China should have concern as there are billions outstanding in China of bonds denominated in U.S. dollars. With a rising U.S. dollar and the coronavirus crisis, many firms could soon be in serious trouble, especially since much of the debt matures in the next 12 months. The US$ Index is nearing overbought and there is considerable resistance up to 99 and 99.30. But now we need a break back under 97.50 to suggest the rebound is over. 96 remains major support and under that level a more serious decline could get underway.
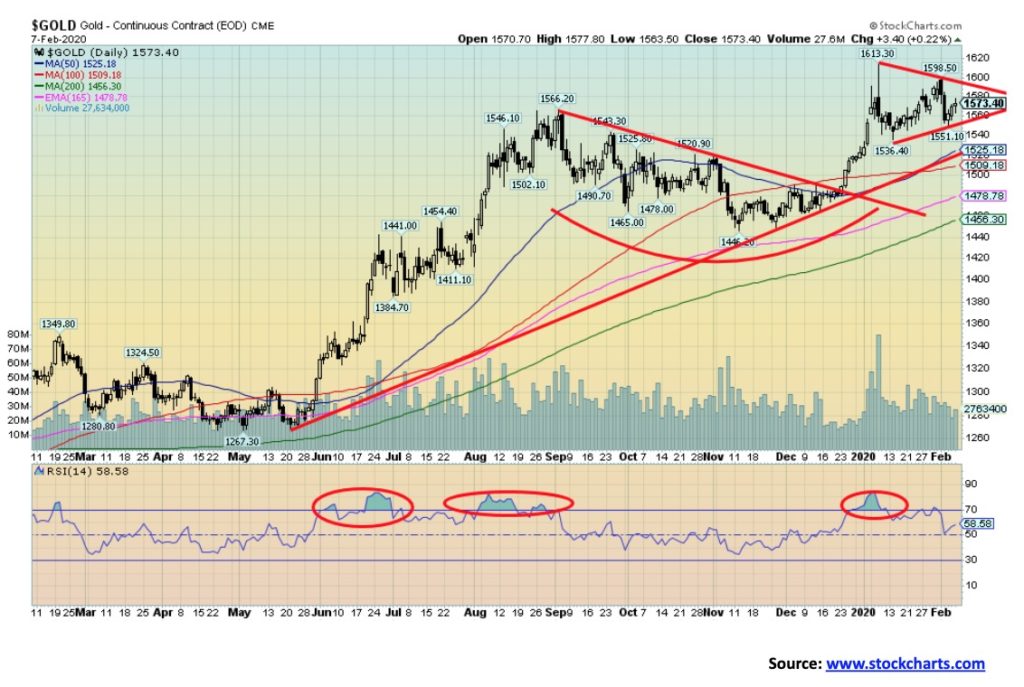
Gold had a decidedly mixed week. Gold fell 0.9% on the week, but does cling to a 3.3% gain for 2020. As well, the futures closed at $1,570 and we were hopeful that gold would hold the $1,570 level, even though gold dipped to $1,551 earlier in the week. Cash gold finished at $1,571. Nonetheless, we are not out of the woods. We need to see gold now regain above $1,600 to convince us that a correction is over and the uptrend should resume. We are concerned about the divergence between gold and silver (see chart below) as it acts as a non-confirmation for the recent move. A break now of $1,535 would be negative and potentially suggest a decline to $1,460 or for a minimum to $1,518. Note the 200-day MA is currently at $1,456. A test of the 200-day MA is not unusual. We are forming a small triangle that appears as a pennant formation. The breakout point is at $1,598 and projects up to $1,675. The breakdown point is at $1,550 and projects down to $1,475. This week could be key. The stronger than expected economic numbers are not helping gold nor is a rising U.S. dollar. But the fact that gold hasn’t smashed despite the stronger economic numbers and rising U.S. dollar is a positive.
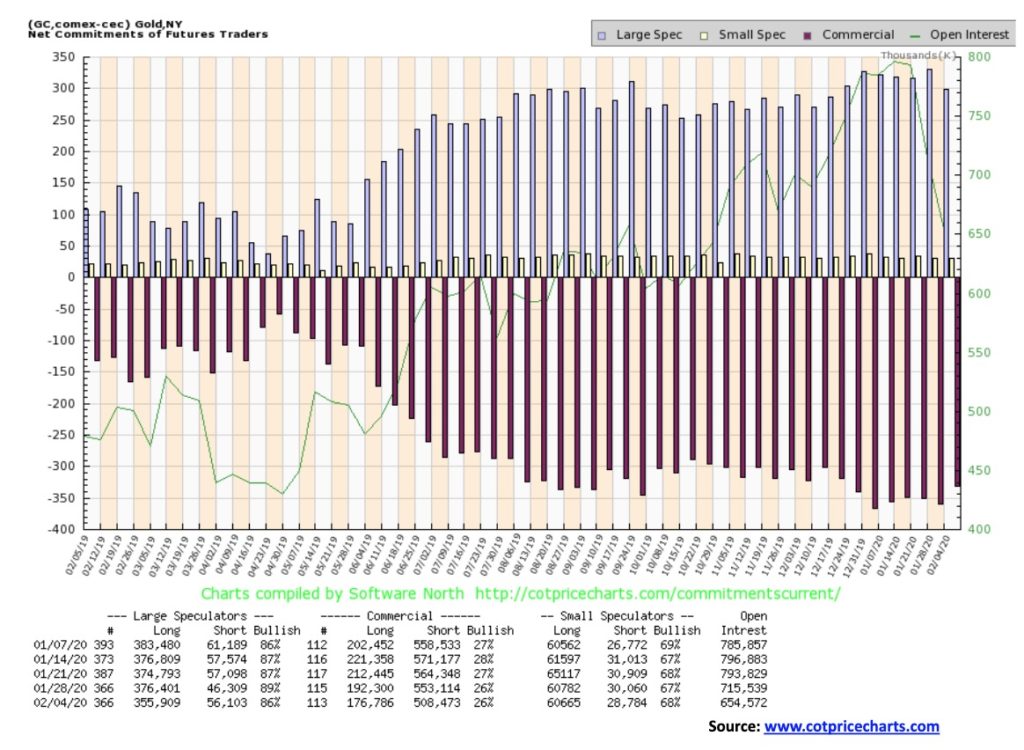
The gold commercial COT was unchanged this past week at 26%. Long open interest fell about 15,500 contracts while short open interest also fell down a roughly 44,600 contracts. Given the big drop in short open interest we can actually view this COT as being somewhat friendly, even if, overall, it remains bearish. The large speculators COT (hedge funds, managed futures, etc.) fell to 86% from 89% as long open interest dropped roughly 20,500 contracts and short open interest rose about 10,000 contracts. That is a helpful sign if you want to be a bull.
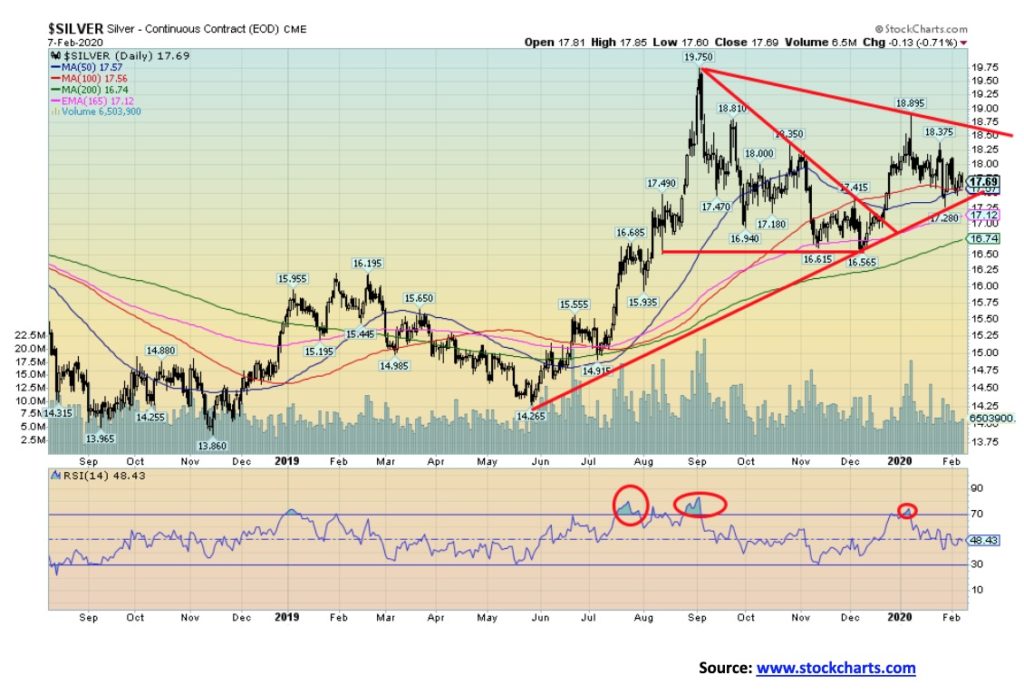
Silver did not have a good week, falling 1.8%, and is now down 1.3% on the year. Silver broke out of a triangle pattern back December 2019. Targets appeared to be up to around $20.50. However, silver appears to have run into a wall over the past few weeks after hitting a high of $18.90. That high was well short of the August 2019 high of $19.75. So far, we appear to be holding an uptrend line from the May 2019 low. But a break of $17.40 would be negative and suggest a fall towards the 200-day MA near $16.75. A breakdown under $16.60 could signal the start of a more serious bear market. On the other hand, silver could be just forming another triangle pattern. A break above $18.75 could suggest targets up to $21.90. The recent action might also be a bull flag or pennant. A break back above $18.00 could target up to $19.60. We are at a bit of a crossroads here with silver. We note that silver stocks in particular were hit on Friday’s decline in the gold and silver stocks. We’ll feel better if we can regain above $18, but would prefer a break back above $18.35 to confirm that we are going to rise again. Could be a key week.
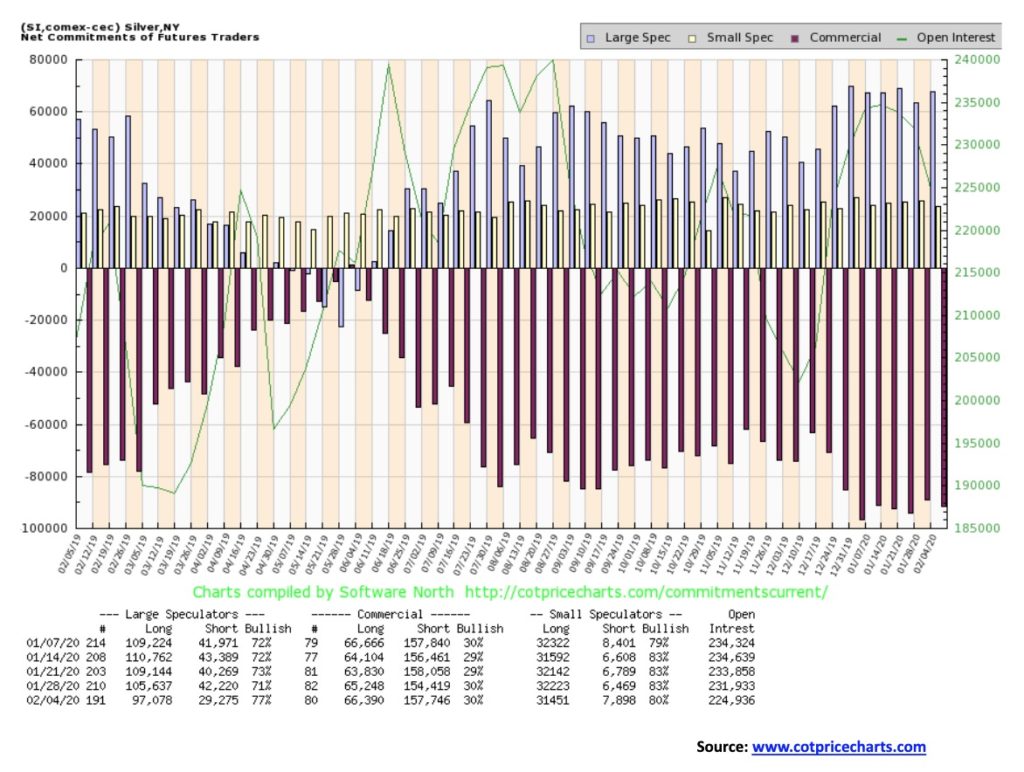
The silver commercial COT was unchanged this past week at 30%. There was little movement. Long open interest rose about 1,000 contracts and short open interest rose roughly 3,000 contracts. The large speculators COT had a big jump to 77% from 71% as they cut their short position by roughly 13,000 contracts but also cut their long open interest position by about 8,500 contracts. The silver commercial COT remains bearish for silver going forward even as we have pointed out many times that gold and silver prices can rise despite the negative commercial COT.
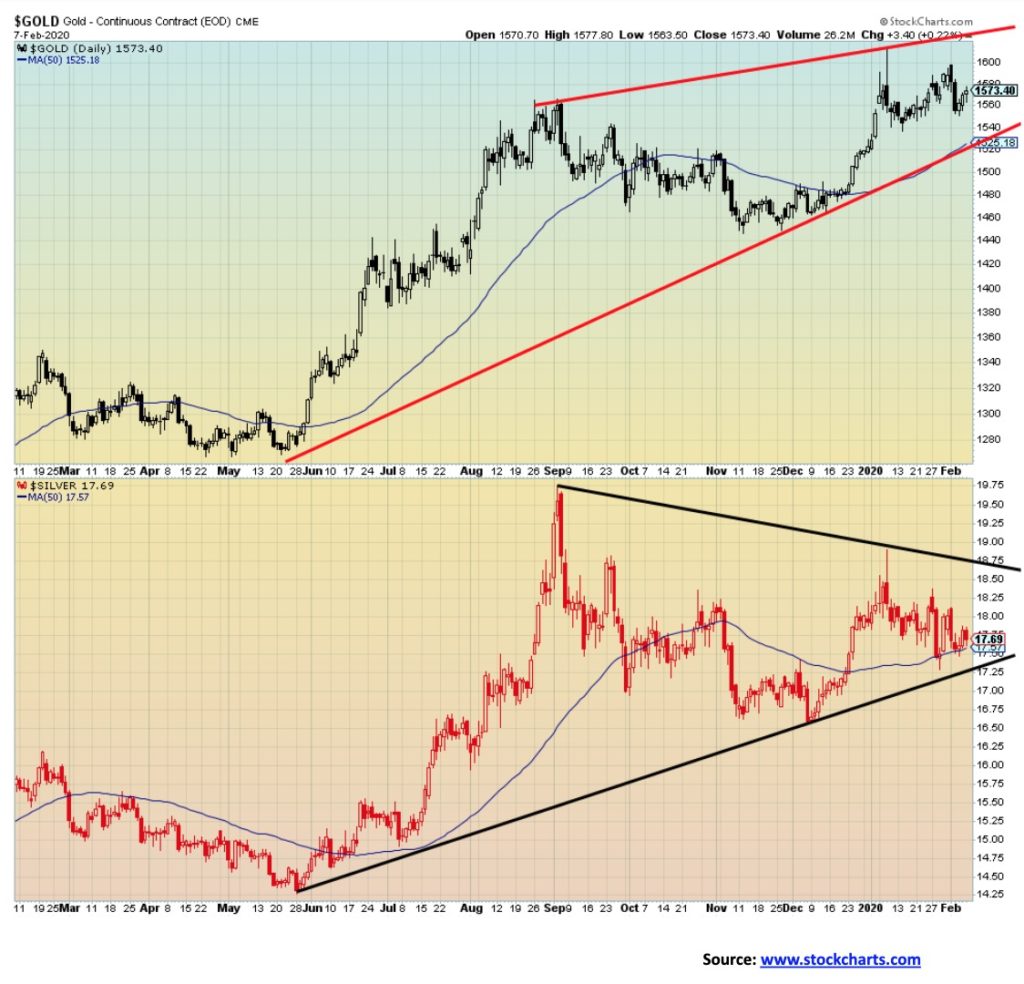
This is our worrisome chart. As we have often noted we adhere to Dow Theory that the averages must confirm each other. Only this is gold and silver and the two are not confirming each other. Gold made new highs, silver did not. That is a concern and something to note. Which is why we keep an eye on downside breaks noted earlier.
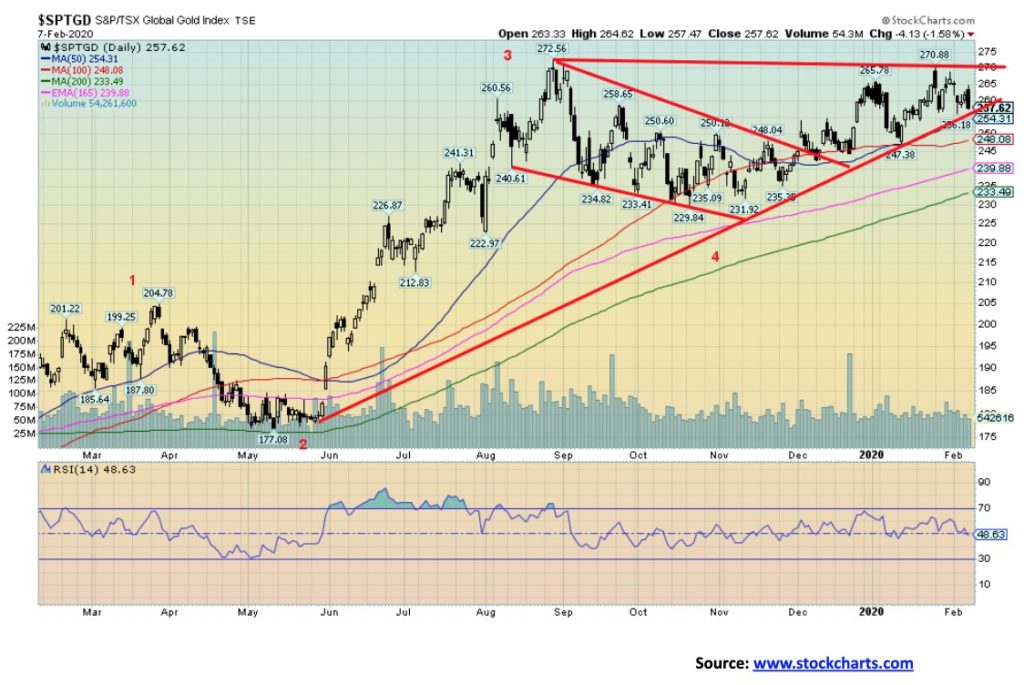
It was not a good week for the gold stocks. The TSX Gold Index (TGD) fell 3.4% while the Gold Bugs Index (HUI) was off 3.4% as well. The gold stocks were responding to the weakness seen in both gold and silver this past week. The good news at least for the TGD is it is holding, for the moment at least, the uptrend line from lows seen last May 2019. A break of 256 could, however, send the TGD down to stronger support between 230 and 250. A breakdown under 230 would be negative and could signal the onset of a bear market. A break of support at 245/247 would also be negative and the first sign of potentially deeper trouble. We need to regain 270 to suggest that higher prices are in order. All this could just be a prelude to higher levels as the gold stocks have a tendency to rise swiftly, then fade, correct, and rise again, etc. Since the lows back in November, we have been making higher highs and higher lows defining an uptrend. This coming week we need to see a rebound to the upside to keep the bull move alive.
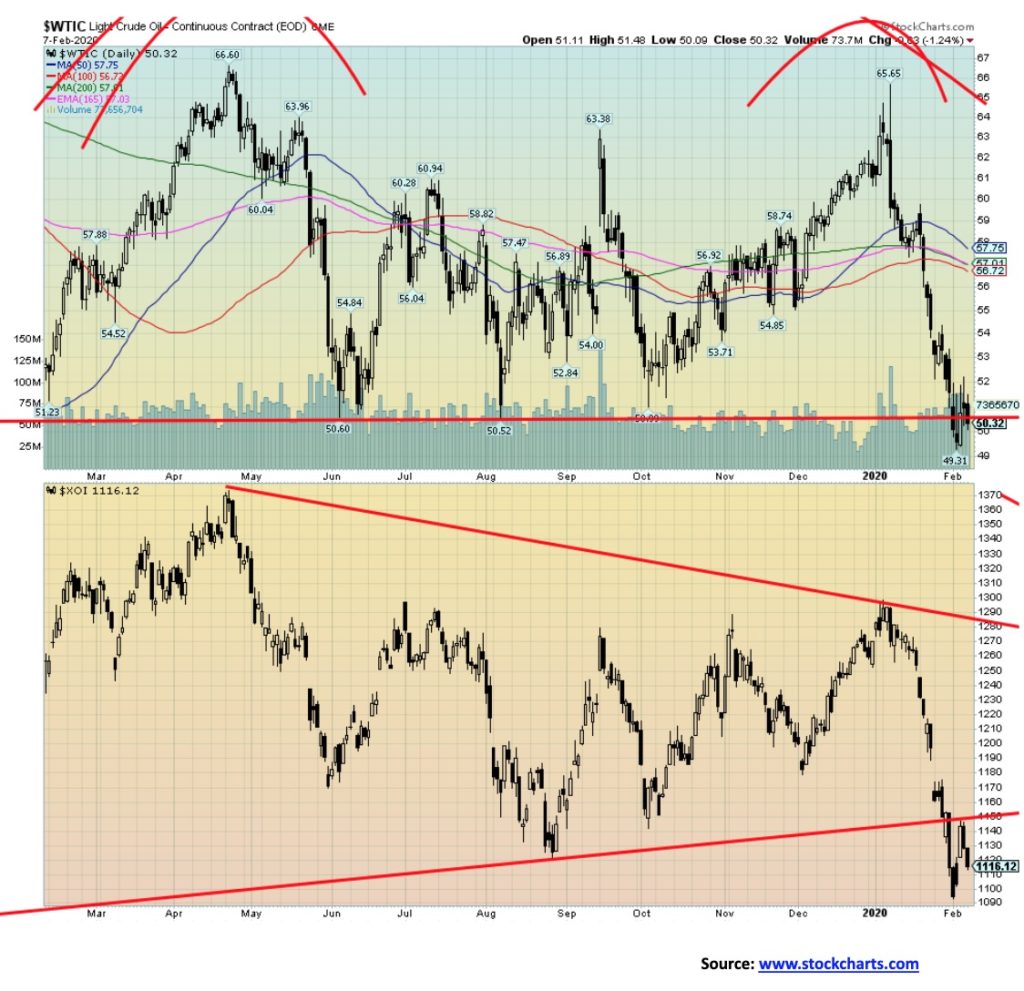
Just when it looked like oil prices were about to fall into the abyss they bounced back. It was short-lived. At the OPEC meetings, Russia was balking at the deep production cuts that were being bandied about. WTI oil broke the $50 support this past week but rebounded to close at $50.32. Will the $50 zone hold? Looks tenuous if Friday’s fall is a harbinger. WTI oil fell 2.4% on the week. It also posted new 52-week lows at $49.31. With the break of $50 we could argue in theory that WTI oil could have targets as low as $34.50. It would, of course, be good news/bad news. Good news for drivers, bad news for energy companies, many of which could go bankrupt, especially in Western Canada. Yes, the coronavirus crisis is having a deep impact on oil due to a sharp fall in demand, particularly in China. OPEC was recommending to cut 600,000 BPD.
Natural gas (NG) did not fare any better this past week and, despite the 1.6% gain on the week, NG also made fresh 52-week lows. The energy indices followed with the Arca Oil & Gas Index (XOI) flat on the week but also saw new 52-week lows. The TSX Energy Index (TEN) actually eked out a 0.2% gain on the week and did not see new 52-week lows. The TEN is actually up 9% from the lows of August 2019.
We don’t see any sign of a bottom forming for WTI oil, so more losses could follow this week. If Russia comes to an agreement on the cuts, we believe at best it will steady prices and prevent further declines. We are quite oversold here so a rebound relief rally might be in order. If we can regain $54 it would be positive. But the best we could probably hope for is a test of the key MAs at $56/$57.
—
(Featured image by PhotoMIX Ltd. from Pexels)
DISCLAIMER: This article was written by a third party contributor and does not reflect the opinion of Born2Invest, its management, staff or its associates. Please review our disclaimer for more information.
This article may include forward-looking statements. These forward-looking statements generally are identified by the words “believe,” “project,” “estimate,” “become,” “plan,” “will,” and similar expressions. These forward-looking statements involve known and unknown risks as well as uncertainties, including those discussed in the following cautionary statements and elsewhere in this article and on this site. Although the Company may believe that its expectations are based on reasonable assumptions, the actual results that the Company may achieve may differ materially from any forward-looking statements, which reflect the opinions of the management of the Company only as of the date hereof. Additionally, please make sure to read these important disclosures.


Youth Cannabis Use in Colorado Is Falling — But the Full Story Is More Complex
The 2026 Colorado survey shows teen cannabis use fell to 10 percent in 2025, down from 21 percent in 2015....


Morocco’s Growth Holds at 4.6% as Agriculture Offsets Economic Pressures
Morocco’s economy grew 4.6% in Q1 2026, driven by a strong agricultural rebound offsetting declines in industry. Services expanded moderately...


Abivax Shares Surge as New Trial Data Eases Safety Concerns Over Ulcerative Colitis Drug
Abivax shares surged nearly 36% after positive updated trial results for its ulcerative colitis drug obefazimod reassured investors following earlier...


El Dorado Raises $9M to Expand Cross-Border Fintech Platform
El Dorado, a Latin American fintech improving cross-border financial services, raised a $9 million Series A led by Paradigm with...


Bitcoin Stalls Near $60K as Strategy Moves, ETFs Outflow, and EU MiCA Rules Take Effect
Bitcoin hovers near $60,000 with ETF outflows, while Strategy boosts reserves, sells BTC, and raises dividends to reassure investors. Ethereum...
 |
|
 |  |
 |
|
-

 Impact Investing2 weeks ago
AI Adoption in Italian Retail Stalls Despite Strong Experimentation
-

 Cannabis1 day ago
Cannabis Dominates Global Drug Use: Trends, Risks, and Shifting Markets
-

 Impact Investing1 week ago
EU Weighs More Free Emission Permits in ETS Review to Boost Industry Competitiveness
-

 Crypto5 days ago
Bitcoin and Ethereum Slide as Market Pressure Builds Amid Strategy Concerns and Layer 2 Disruptions