Markets
How the stock market changed during presidential cycle periods
The Presidential cycle has historically had an impact on the stock markets and the economy.

Every Presidential cycle has had its effects on the stock market, the economy, GDP growth, debt growth, the debt to GDP ratio, gold, the US$ Dollar Index, and recessions.
With the failure to even vote on the “repeal and replace Obamacare,” coupled with the ongoing investigations into the White House “Russian” connections we thought it apropos to revisit the Presidential cycle. The Presidential cycle has historically had an impact on the stock markets and the economy. According to the Stock Trader’s Almanac (Jeffery A. Hirsch & Yale Hirsch) that is published annually, wars, recessions, and bear markets tend to occur in the first half of the four-year term while more prosperous times and bull markets tend to appear in the latter half. According to the Hirsches of the 45 administrations since 1833, the second-half stock market gains have been 729.1% vs. a gain of only 307.1% in the first half.
One might even argue that the most recent President, despite all the maligning, did quite well beating the odds in the usually weak post-election year and mid-term year but underperforming during the latter two years the pre-election year and the election year. His first two years saw the Dow Jones Industrials (DJI) gain 36.5% (2009-2010) and 36.0% (2013-2014). His latter two years produced gains of 13.1% (2011-2012) and 11.2% (2015-2016) respectively.
Given some signs of trouble early on in his Presidency, will President Trump do as well? His Republican predecessor George W. Bush is one of the few Presidents who actually saw the stock market lower when his term was over in 2008. From 2001 to 2008, the DJI lost 18.6%.
The cycle is not always perfect. The well-known four-year stock market cycle often sees its low occur during the Presidential cycle although they do not necessarily line up. Given we suspect the last four-year cycle low was seen in August 2015 the next one won’t be due (in theory) until 2018–2020 in the latter half of President Trump’s term of office. The question always is, “when does the top come in.” Tops can skew left, center, or right. In March 2017, the market is already 18 months up in the current bull cycle.
The following summarizes the stock market action since 1833.
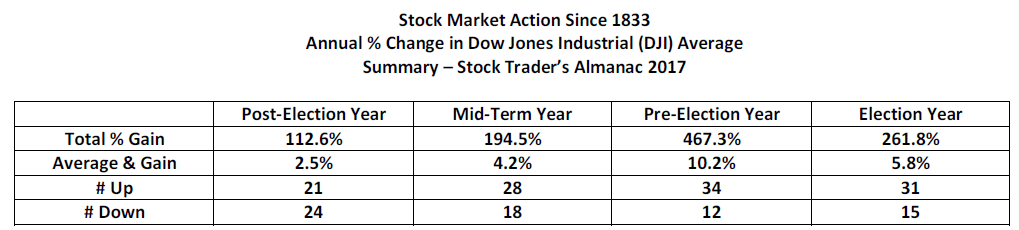
- (Source)
It is rare to see the stock market up four years in a row during one President’s term. It has occurred four times since 1833. They were Calvin Coolidge (Republican) 1925–1928, Franklin Roosevelt (Democrat) 1933–1936, Ronald Reagan (Republican) 1985–1988 and Bill Clinton (Democrat) 1993–1996. Only one President saw four consecutive losing years and that was Herbert Hoover (Republican) 1929–1932.
As to the biggest winner and biggest loser Woodrow Wilson (Democrat), 1913–1920 saw an 81.7% increase in the DJI in 1915, while Herbert Hoover (Republican) 1929–1932 saw the market collapse 52.7% in 1931. Since 1949, the President that saw the biggest gain during his term was Bill Clinton (Democrat) 1993–1996 with an incredible 109.9% gain in his first four-year term. The biggest loser was George W. Bush (Republican) 2005–2008 with a 21.4% loss during his second four-year term.
We went a few steps further with our study from 1949 and besides the stock market, we also looked at GDP growth, debt growth, the debt to GDP ratio, gold, the US$ Dollar Index, and recessions.
The GDP growth winner was Jimmy Carter (Democrat) 1977–1980 with a GDP growth gain of 52.5% during his term. The weakest GDP growth occurred under Barrack Obama (Democrat) 2009–2012 with a gain of 9.8% following the steepest recession on record (2007–2009) since the Great Depression. As to debt, the Great Communicator Ronald Reagan (Republican) 1981–1984 and 1985–1988 saw the largest percentage debt growth with gains of 73.2% and 65.5% respectively. While Barrack Obama (Democrat) 2009–2012 and 2013–2016 saw the national debt grow from $10.7 trillion at the end of 2008 to $19.9 trillion by the end of 2016 it was only a gain of 86%, less than Ronald Reagan’s gain of 189% during his two terms. As to the Presidents that contained debt growth the best, it is noteworthy that Presidents Truman (Democrat), Eisenhower (Republican), and Kennedy (Democrat) saw only low growth in the debt under 10%. Since then, only one President has accomplished that and that was Bill Clinton (Democrat) 1997–2000 that saw the national debt only grow by 8.6%.
The debt-to-GDP ratio fell steadily from Truman (Democrat) through Carter (Democrat) and did not start rising again until Ronald Reagan (Republican). Since then the debt-to-GDP ratio has climbed steadily with only Bill Clinton’s (Democrat) second term seeing a decline. Today, the US debt-to-GDP ratio is over 100 and that alone becomes a permanent drag on the economy.
Official recessions have occurred under almost every President since 1950. Some, however, managed to avoid any official recession. No official recession occurred under Johnson (Democrat) 1965–1968, Reagan (Republican) 1985–1988, Clinton (Democrat) in both 1993–1996 and 1997–2000, and under Obama (Democrat) also twice 2009–2012 and 2013–2016. The steepest recession occurred under George W. Bush (Republican) 2005–2008 with the official recession from October 2007 to June 2009 (overlapping into Obama’s first term) when the economy contracted 4.3%. That was also the longest official recession.
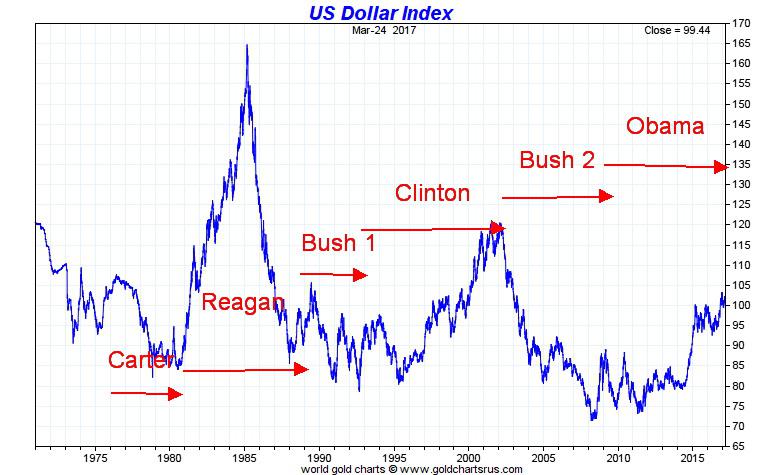
Gold was largely held at $35/ounce until Richard Nixon (Republican) ended the Bretton Woods agreement in August 1971, taking the world off the gold standard and setting gold to trade freely. Currencies were set to trade freely or float against the world’s reserve currency the US$ in 1973 following the Smithsonian Agreement. The history of the US$ Index begins then.
It probably comes as no surprise that gold’s biggest gains came during the term of Jimmy Carter (Democrat) 1977–1980. Gold gained 337% during that term. Nobody has been close since, although during George W. Bush’s (Republican) second term 2005–2008 gold gained 102.1%. The US$ Index tends to fall when gold rises and vice versa. The US$ Index has lost 8.3% of its value since it began in 1973. Its biggest decline during a Presidential term was under Ronald Reagan’s (Republican) second term 1985–1988 when it fell 26.8%. Ronald Reagan (Republican) 1981–1984 also saw the biggest gain for the US$ Index as it jumped 35.2% during his first term.
So what can we conclude out of all of this? And how will it potentially impact President Trump’s term? Given that there has been no official recession since the Great Recession of 2007–2009, the odds would seem to favor a recession occurring in the next four years. There is no record of three successive Presidential terms with no recessions. Stock markets tend to perform better under Democrat presidents (average 47.2% gain/term for Democrats vs. average 27.1% gain/term for Republicans). With stellar gains in the past two Presidential terms, could bumps be coming to the stock market?
GDP growth is a bit of a wash with no one party seeming to have an advantage. Under Democratic Presidents since 1949, GDP growth has averaged 28.3% per term while under Republican Presidents it has averaged 28.9% per Presidential term. With debt, however, the Republicans are the biggest debt creators. Under Democratic Presidents, debt growth has averaged 23.6% per Presidential term while under Republican Presidents the debt has grown 37.7% per Presidential term. Gold has seen its strongest gains under Democratic Presidents with an average gain per term of 49.9% vs. 34.2% gains under Republican Presidents. The US$, however, tends to fall under Republican Presidents losing 1.6% on average during their terms vs. a gain of 5.5% under Democrat Presidents per term.
We included a column of US involvement in war. Of its 241 years of existence, the US has been at war or involved in a war in 224 of those years or 93% of the time. Since 1949, the US has been involved in or at war almost continually.
If we were to make a prediction based on the history of the Presidential cycle for President Trump, we would say that the stock markets should underperform while GDP growth should bump along. However, odds favor a recession during the next four years, debt should grow considerably, the US$ Index should fall, and gold should rise. And, the US will be at war somewhere with someone.
(Source)
—
DISCLAIMER: This article expresses my own ideas and opinions. Any information I have shared are from sources that I believe to be reliable and accurate. I did not receive any financial compensation in writing this post, nor do I own any shares in any company I’ve mentioned. I encourage any reader to do their own diligent research first before making any investment decisions.


Youth Cannabis Use in Colorado Is Falling — But the Full Story Is More Complex
The 2026 Colorado survey shows teen cannabis use fell to 10 percent in 2025, down from 21 percent in 2015....


Morocco’s Growth Holds at 4.6% as Agriculture Offsets Economic Pressures
Morocco’s economy grew 4.6% in Q1 2026, driven by a strong agricultural rebound offsetting declines in industry. Services expanded moderately...


Abivax Shares Surge as New Trial Data Eases Safety Concerns Over Ulcerative Colitis Drug
Abivax shares surged nearly 36% after positive updated trial results for its ulcerative colitis drug obefazimod reassured investors following earlier...


El Dorado Raises $9M to Expand Cross-Border Fintech Platform
El Dorado, a Latin American fintech improving cross-border financial services, raised a $9 million Series A led by Paradigm with...


Bitcoin Stalls Near $60K as Strategy Moves, ETFs Outflow, and EU MiCA Rules Take Effect
Bitcoin hovers near $60,000 with ETF outflows, while Strategy boosts reserves, sells BTC, and raises dividends to reassure investors. Ethereum...
 |
|
 |  |
 |
|
-

 Biotech2 weeks ago
Bavarian Biotech Sector Expands with Record Funding and Startup Growth in 2025
-

 Africa2 days ago
BOAD Approves Major Funding Boost to Drive West African Development
-

 Business1 week ago
Markets Diverge as Oil Falls, Rates Hold, and Inflation Persists
-

 Impact Investing6 days ago
Coastal Cities Lead as Heat Strains Italy’s Urban Livability
You must be logged in to post a comment Login