Markets
How the U.S. tomahawk missile attack on Syria affected the stock market
Outside of the tomahawk fireworks, it was a quiet week with little movement overall in the markets. All of this tension could be shaky for stock markets and positive for gold and bonds.

Last week U.S. launched tomahawk missile attack on Syria. Markets responded to the attack with stocks selling off, gold rising, bonds rallying, and oil rallying. However, by day’s end stocks had rebounded, gold sold off and briefly went negative (silver closed down on the day), and bond prices pulled back while oil appeared to hold its gains. The big winner appeared to be Raytheon (RTN-NYSE) the maker of the tomahawk missiles whose stock jumped 1.5% on the day although it too came off its highs of the day.
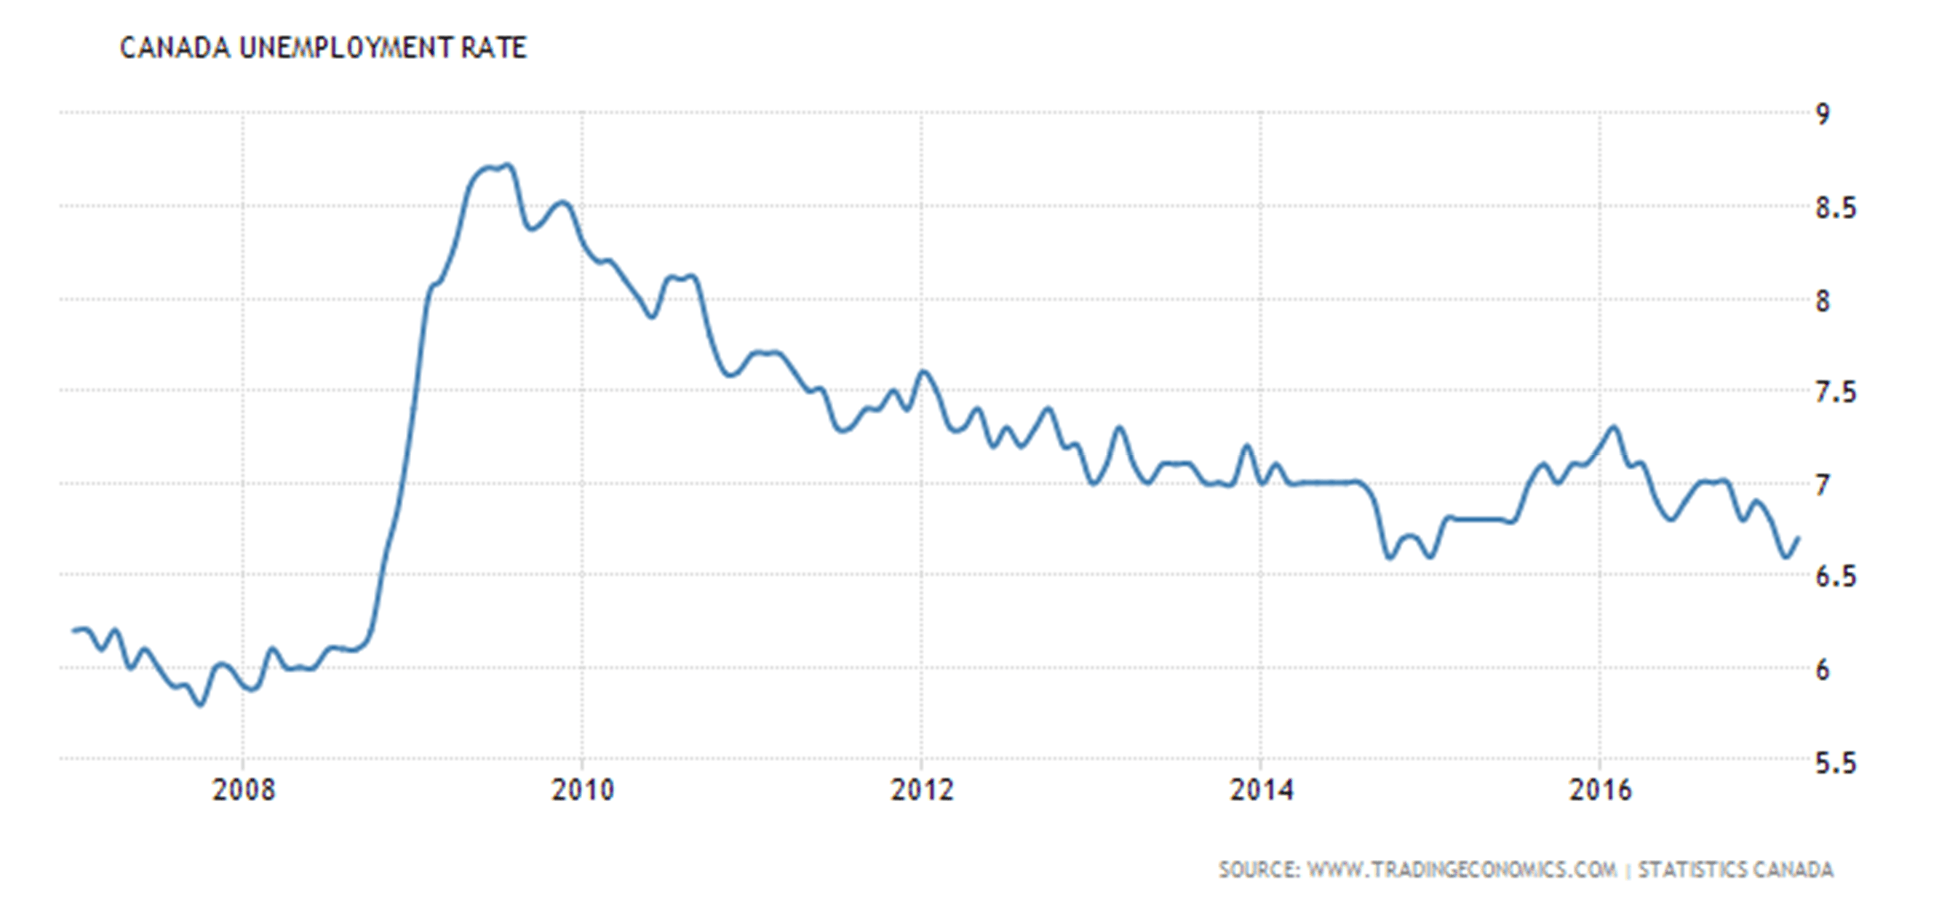
Outside of the tomahawk fireworks, it was a quiet week with little movement overall in the markets. Not even the lower than expected nonfarm payrolls released on Friday had much of an impact largely because it was offset by a drop in the unemployment rate. Most other numbers released during the week continued to show an improving US economy. Even the Canadian economy is looking better as more people were looking for work and that helped push up the unemployment rate.
All of this tension could be shaky for stock markets and positive for gold and bonds. As we will show in our review of markets stocks appeared poised to fall, gold appears poised to rally further while bonds look like they have more to rally regardless of the global tensions. The global tensions are the trigger. We live in interesting (but tension-ridden) times.
Model Portfolio
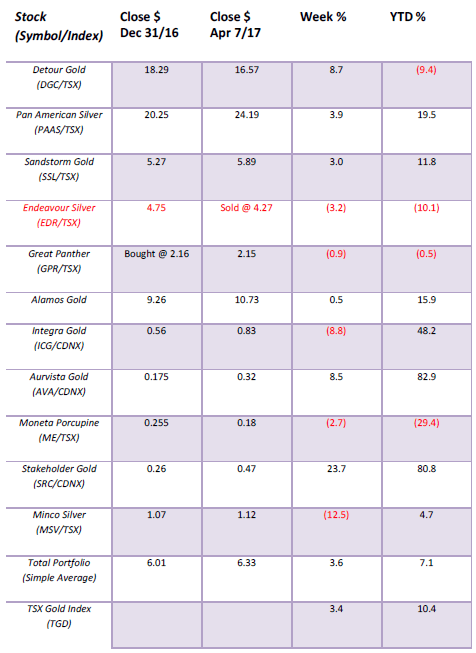
Despite the relatively flat week for gold including today’s reversal, the gold stocks managed gains overall of 3% +. The star of the week was Stakeholder Gold (SRC/V) up 23.7% while Minco Silver (MSV/T) suffered a 12.5% decline. Detour Gold (DGC/T) had a nice bounce back week.
©David Chapman
MARKETS AND TRENDS
©David Chapman
Note: For an explanation of the trends, see the glossary at the end of this article.
New highs refer to new 52-week highs.
Key Economic Numbers Week April 3 – April 7, 2017
(Source)
(Source: www.shadowstats.com, www.data.bls.gov, www.statcan.gc.ca, www.tdeconomics.com)
Note: % M/M unless otherwise noted
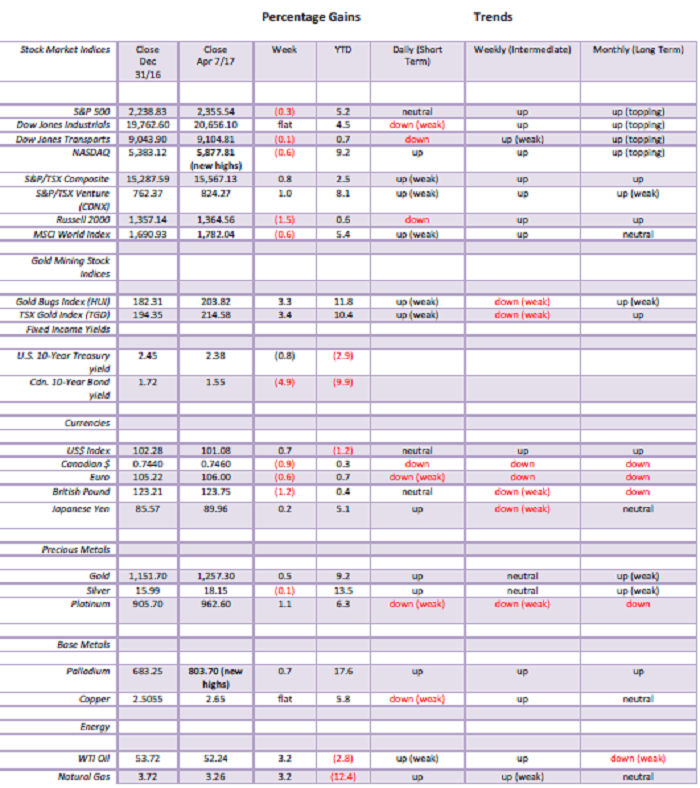
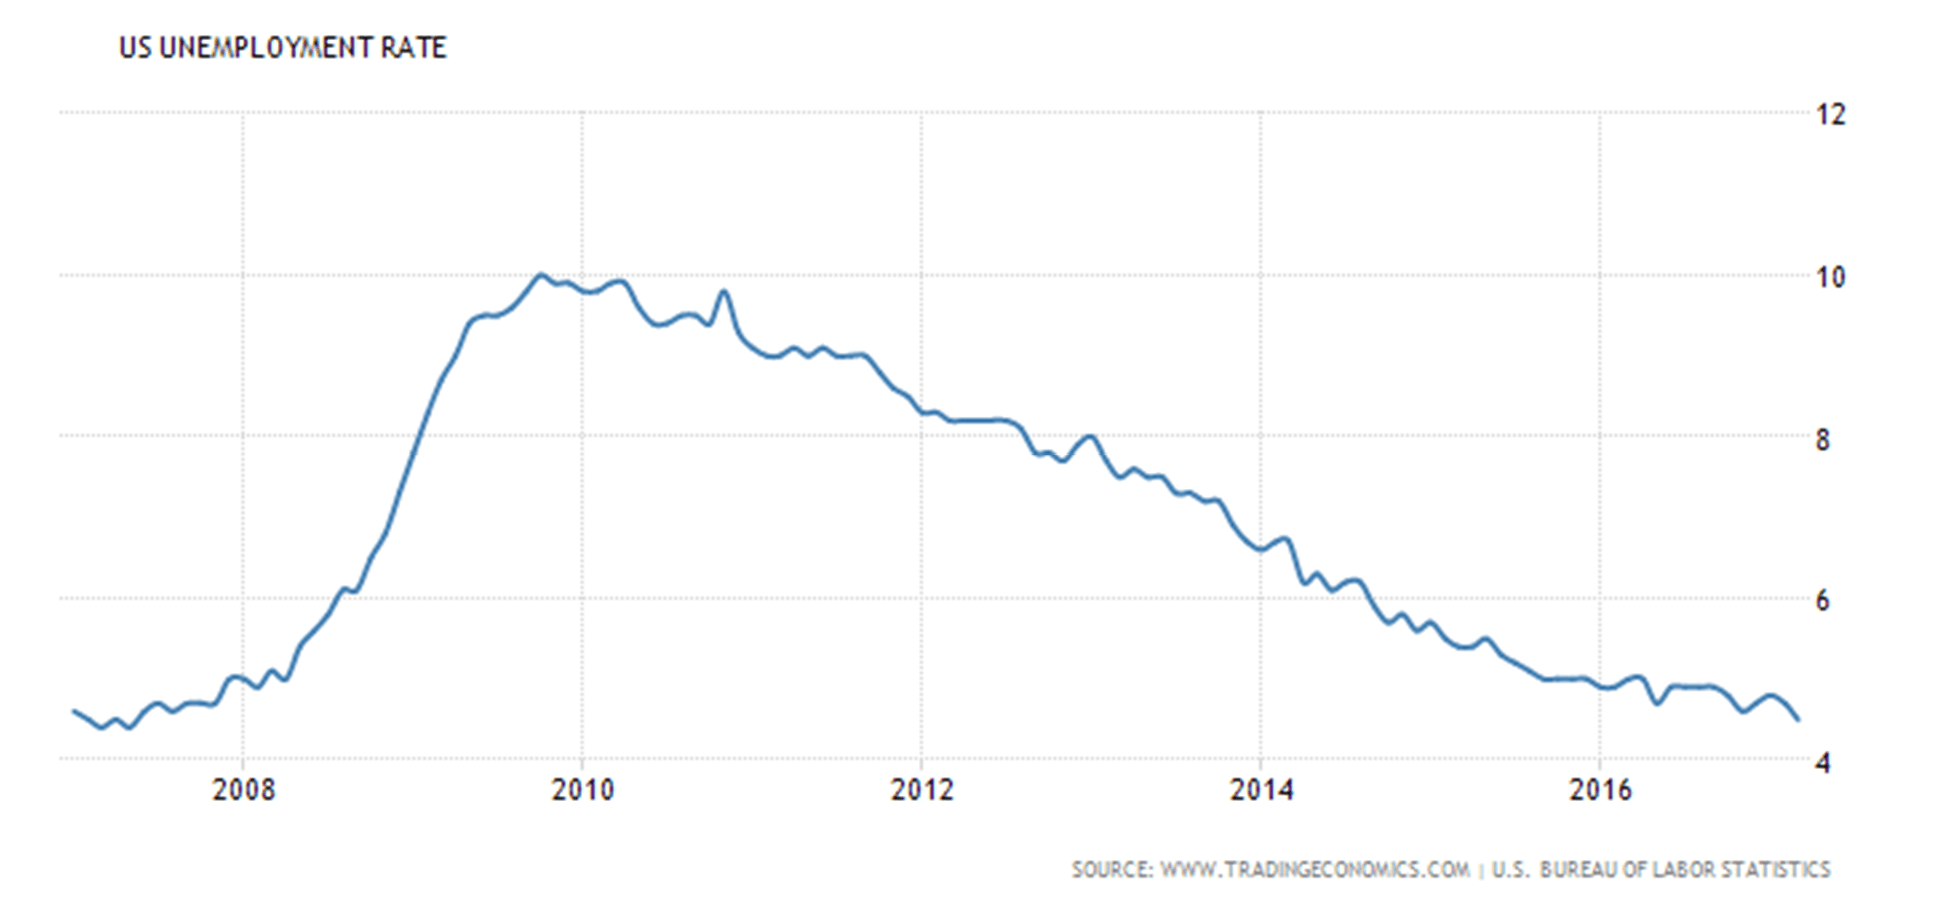
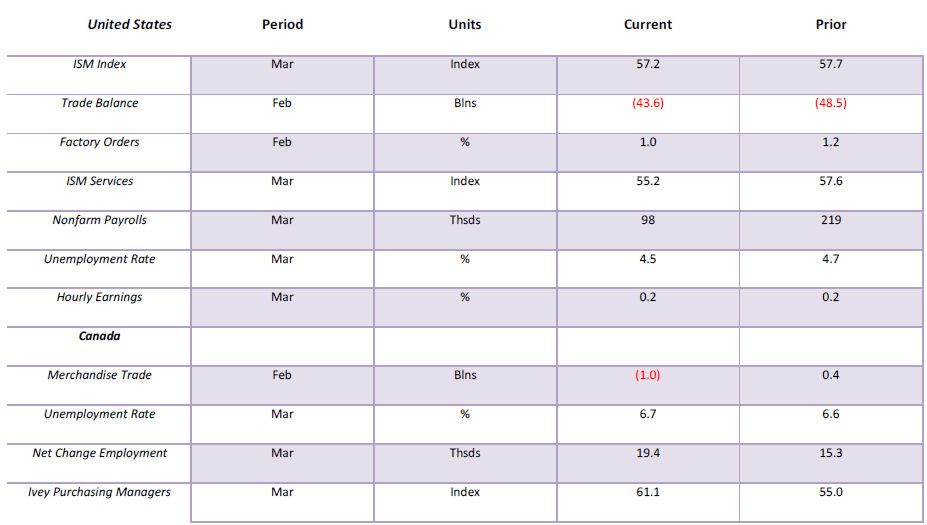
The US unemployment rate continued to fall, dropping to its lowest level in almost ten years. This came as a surprise considering the weak nonfarm payroll numbers of only 98,000 jobs in March, well below the consensus figures of at least 180,000. It seems the retail sector shed a lot of jobs last month, and not exactly good-paying jobs. The economy needs at least 75,000 to 100,000 jobs monthly just to keep up with population growth. Surprisingly, the labor force participation rate was unchanged at 63. When we first saw the 4.5% we thought surely the labor force participation rate fell. That is usually the reason for a drop. If there are fewer people participating then the unemployment rate falls. Now the focus is on the health of the economy and economists were lowering their forecasts to 1% growth for Q1. Not exactly what the President ordered. Nonetheless, most pundits saw little in the report that might give the Fed pause when it comes to hiking interest rates at its June FOMC. Rising oil prices helped some manufacturing jobs. And, surprisingly, the number of government employees rose 9,000 last month despite a supposed freeze on hiring. Overall, this was a weak number and there is little to get excited about. For the record, besides the official or headline unemployment rate (U3) falling to 4.5%, the U6 unemployment rate fell to 8.9% from 9.2% and the Shadow Stats unemployment rate slipped to 22.5% from 22.7%.
(Source)
Unlike the US, Canada’s unemployment went the opposite direction rising to 6.7% from 6.6% in March. The rise in the unemployment rate is attributable to a rise in the labor force participation rate that rose from 65.8% to 65.9%. Job growth surprised to the upside with 19,400 new jobs in March when all the market was expecting was 5,000 jobs. Better still, the jobs were full-time or at least 18,400 of them. With more people joining the labor force that is arguably a good sign as more people looking suggests things are looking up a bit in Canada. Nonetheless, don’t expect the BofC to hike rates anytime soon.
(Source)
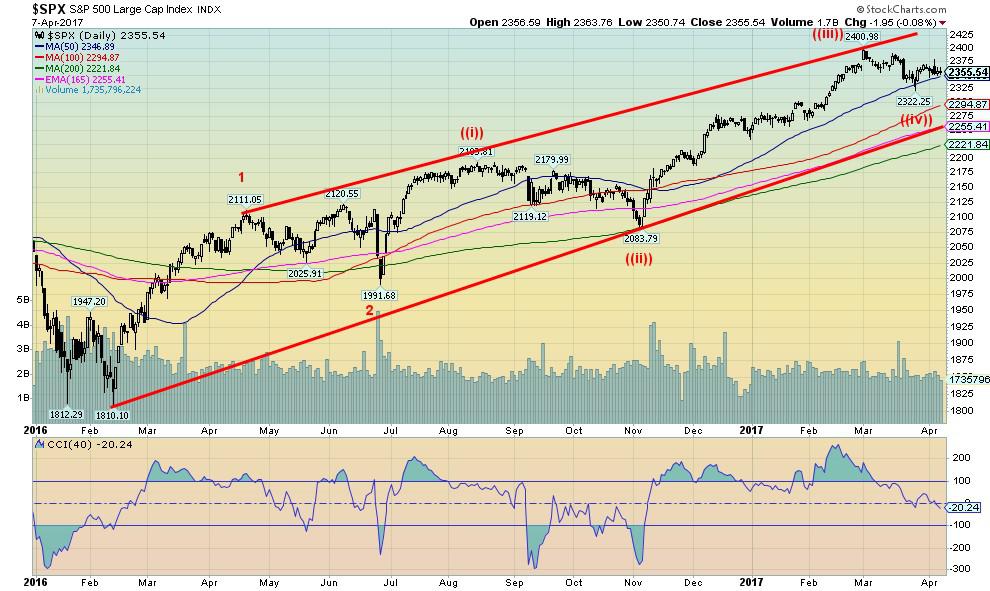
On Wednesday, April 5, 2017, the S&P 500 spiked (as did other US indices), then reversed and closed lower on the day. It appeared to be the start of a potential decline, except there was no real follow-through. On the week the S&P 500 lost only a small 0.3%, the Dow Jones Industrials (DJI) was essentially flat, the Dow Jones Transportations (DJT) fell 0.1% while the NASDAQ got hit the hardest—if one wants to call a 0.6% decline being hard hit. Could the small cap Russell 2000 be leading as it fell 1.5%?
Not even the weaker than expected nonfarm payrolls and the missile attack on Syria could shake the market to the downside. The stock market started out weaker, but the end of the day the S&P 500 was off only 0.1% despite reaching back into positive territory at one point. Overall, the markets have been trading in a pretty narrow range of late but it has been over a month now since they made their all-time highs. We continue to believe this current action is just a correction, a probable wave 4 of a minor degree before the market moves to new highs once again.
The big question is how to read the recent missile attack on Syria. The suspicion is there will be a lot of sound and fury, but the reality is we don’t believe Russia and the US would risk a clash. And since the Russians have suspended air agreements and haven’t ruled out the potential for clashes between the two nuclear powers, odds would seem to favor that this attack is one and done but that the next few weeks might bring considerable noise. To attempt to take out the Assad regime would be to challenge Russian air defense systems and raise the potential for a clash between the two nuclear powers.
All of the noise might be sufficient to allow a correction here and for the S&P 500 that could involve a test of the uptrend line currently near 2,255. Currently, a drop under 2,320 and especially under 2,300 could set up that test. That is really not that far away. We’d have to be breaking down under 2,200 to suggest that something deeper was afoot. We don’t think that is going to happen this time around but it can’t be ruled out.
What we have labeled as wave ((iii)) Elliot wave international has labeled as wave ((v)). They may be correct in which case the fourth wave correction is underway but it would still be followed by a move to new highs or the classic double top for wave 5 sometime this summer.
No matter how we view it, this market does have some time left, and we could see new all-time highs once again but we are late in the game.
(Source)
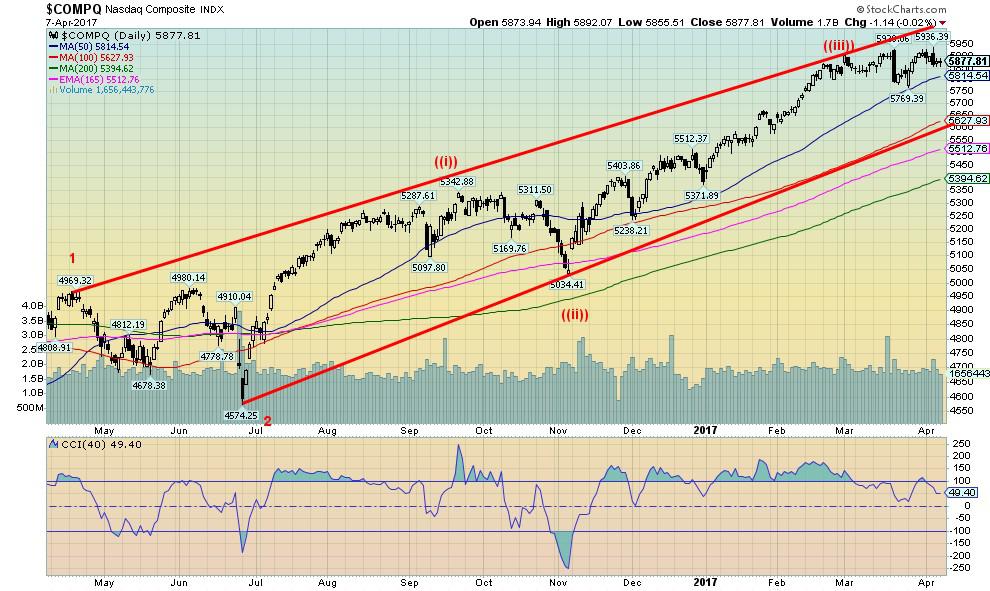
Here is the NASDAQ and why we think the recent top was only the top of minor wave ((iii)). The subsequent pullback was too little and even though we actually made new all-time highs on April 5, 2017 none of that seemed to indicate that was 5th wave up. We could be wrong, but our expectation here is there is at least another minor coming soon before the market makes a steeper correction for the 4th wave. It would still put the timing the same for a final top sometime this summer, probably late summer.
(Source)
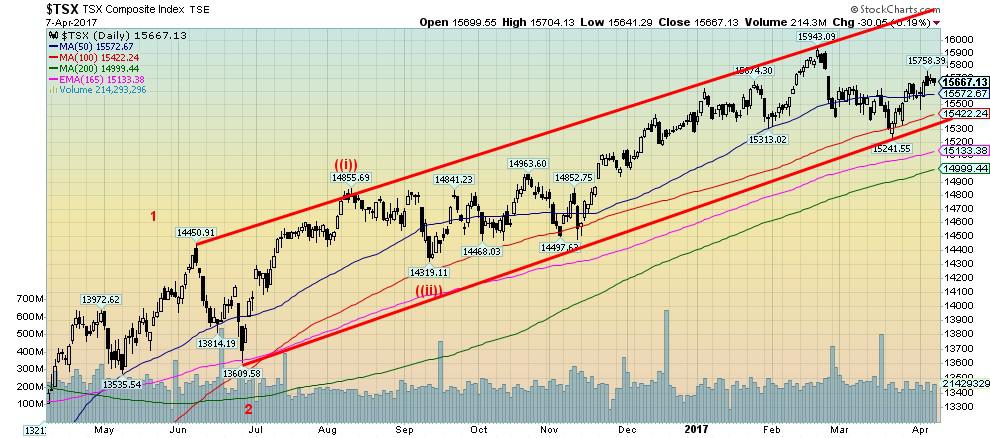
Here is the TSX Composite and the story and wave count appears to be the same. Wave ((iii)) is complete and we appear to be working on wave ((iv)) to help complete wave 3. The TSX Composite generally follows the US market especially given its dominance with banks, but unlike the US markets, the TSX is heavily weighted with resource stocks in gold & precious metals, metals & mining, and oil & gas. The conclusion is the same—a move to new highs should come this summer with the final top in late summer.
(Source)
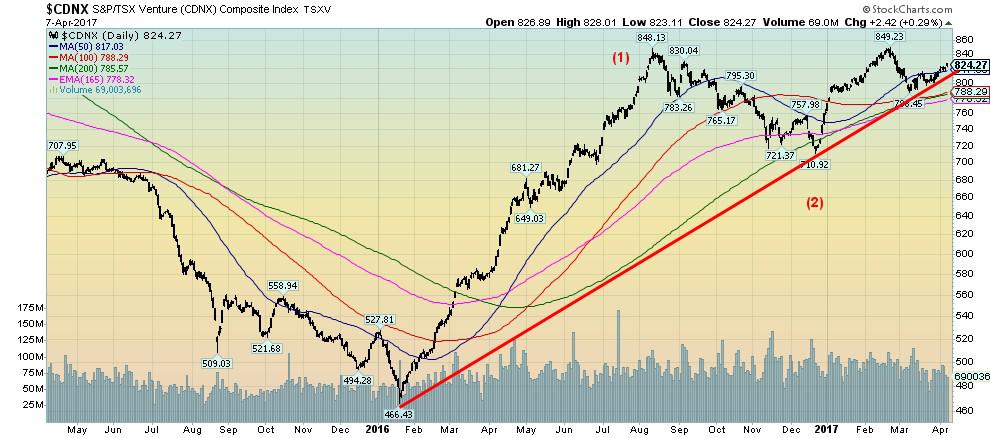
The TSX Venture Exchange (CDNX) lives in a completely different world to the rest of the market. It is clear now the huge low at 466 seen back in January 2016 was very significant and most likely a multi- year low. We believe we have completed intermediate waves one and two and we are now in wave 3. usually the most powerful wave to the upside. The first wave up took the CDNX over 80%. Wave 3 could take the CDNX up well over 100% from the lows at 710 seen back in December 2016. If you feel comfortable investing in highly speculative penny mining stocks, this may be the place to be. A rise to 1,400 or even 1,500 should not be dismissed as fantasy. The index was over 3,000 back in 2011.
(Source)
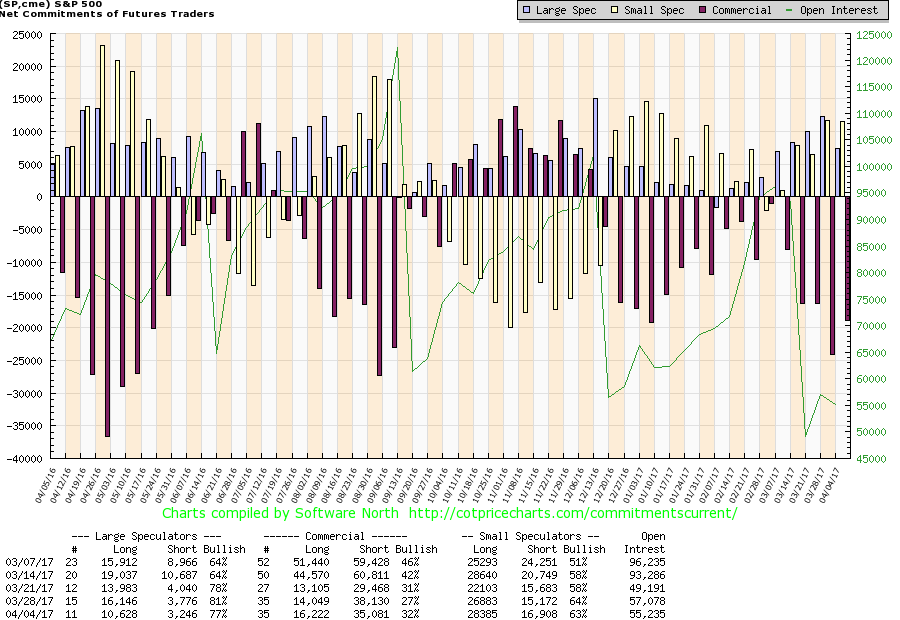
The S&P commercial traders appear to have cut their short position as it rose from 27% to 32% this past week. It was a combination of a roughly 2,000 contract rise in long open interest and a roughly 3,000 contract decline in short open interest. If the stock market starts rising again we may know why. We think it has to get up over 40% to really get a rise going. So keep an eye on this.
(Source)
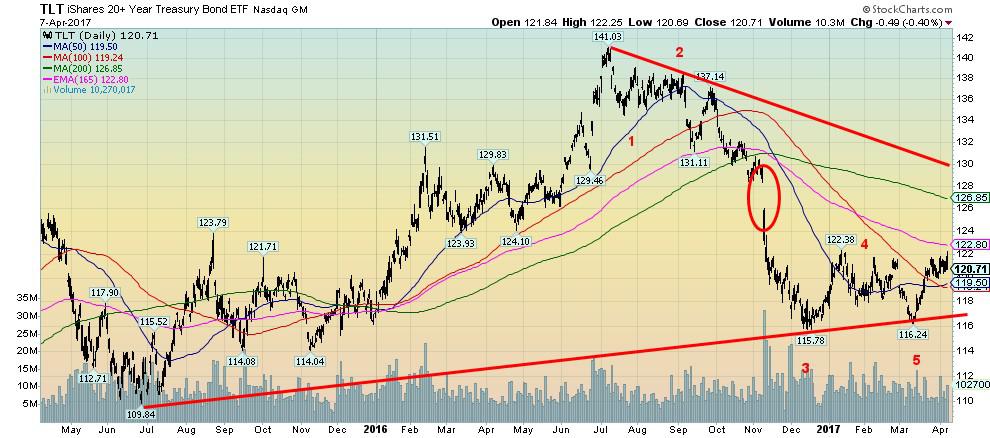
US Treasury bonds—as represented here by the iShares 20+ year Treasury Bond ETF (TLT)—surged on Friday to a new high at 122.25, just shy of the high seen on January 12, 2017 at 122.38. Bonds then reversed and closed lower on the day, suggesting we may have made at least a temporary top. We expect bonds to possibly make a pullback here to at least good support near 119. After that, we suspect that higher bond prices should unfold (lower yields as yields move inversely to prices). The breakout occurs above 122.80 and possible targets are up to 127 and even 130. We view this move as countertrend only and once the rally is complete, another downward move in bond prices should occur. There is a good chance we have seen the high for what has been a long upward cycle for bond prices that got underway back in 1981. The top in July 2016 at 141.03 should not be seen again for years to come. Bond prices have a long history of moving in long waves up and down and this last up wave has been one of the longest ever seen.
(Source)
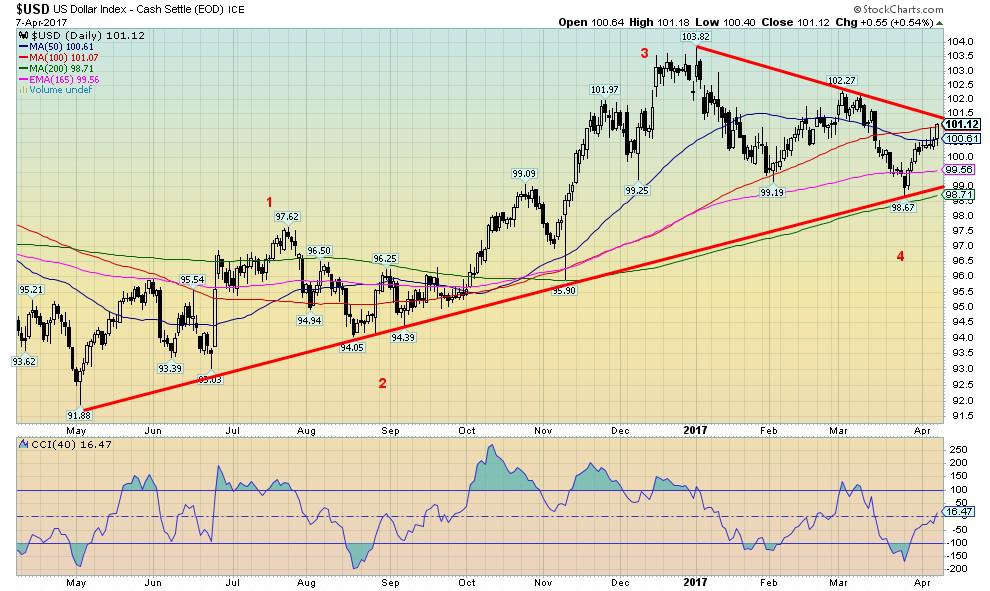
We continue to believe that the US$ Index could well be embarking on its fifth and final wave to the upside that could still take us to long held targets near 106-108. The action this past week in Syria had funds flow out of Europe into the US and US$. This flow should help bonds in particular and possibly US stocks as well. While most currencies fell against the US$ this past week the Japanese Yen has so far bucked the trend. The breakout point is just above at 101.50 and does project up to between 106/107. Regardless of what one thinks of the attack against Syria, it could well spark some inflow into US$ as a safe haven.
The thought that the US$ could go higher here again seems counterintuitive but we also believe it is a temporary phenomenon. The US is, despite what many think, in better economic shape than most others including the EU and Japan. If things are bad in the US they are worse elsewhere. This attracts foreign capital. The EU and Japan are still into their monetary easing while the US has been tightening. There remain questions about the solvency of the European banking system particularly Italy. Italy has announced bailouts. The EU is also being bashed by anti-EU parties from the alt-right that are not only anti-EU but anti-immigration. Greece is just trying to survive. The EU has also been battered by terrorist attacks, something that hasn’t really hit the US—at least not yet, but going forward, who knows.
One of the biggest problems with a strong US$ is that it is against the wishes of the President who believes it is other countries currency manipulating. It also punishes borrowers in foreign countries who borrowed US$ when the US$ was a lot lower and now they owe a lot more US$. But this is not a recognition of strength but a recognition that amongst bad currencies the US$ looks the best right now. All of this will eventually be positive for gold but we have to work through this US$ strength first.
(Source)
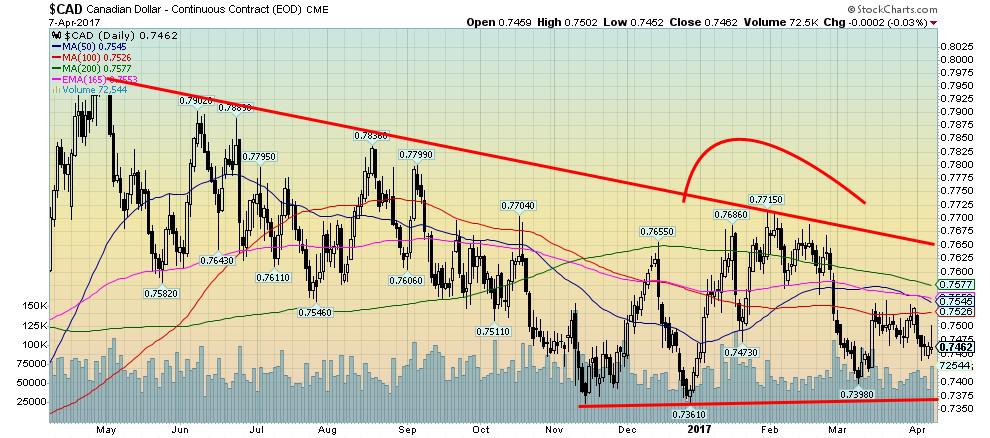
A stronger US$ could well mean a weaker Canadian $. For the past several months the Canadian $ has failed to go anywhere, largely trading between 73.60 and 77. The failure to really break out over 77 left the Canadian $ with probably no place to go but eventually to the downside once again. Major support is seen down 73.75 but below that, a retest of the lows of January 2016 at 68 is highly probable. The Canadian $ did make it back up to 80 briefly following the January low but has failed to hold the level. Since then it has been a long downward drift which usually ends in a plunge. In technical terms, it is called a descending triangle and suggests that the Canadian $ could fall to as low as 67 which is slightly below the January 2016 low.
(Source)
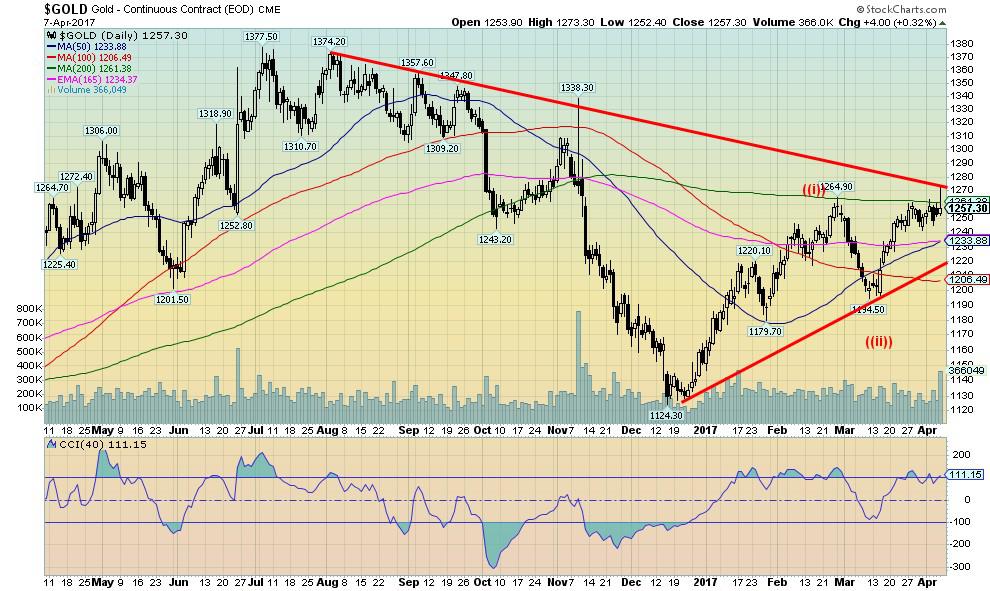
Gold spiked on Friday following the attack on Syria topping out at $1,273.30 then promptly reversed and closed well off the highs. It appears that at least a temporary high may be in place. With the US$ moving higher it was probably logical that gold prices should pull back. Gold did manage to stay positive on Friday, unlike silver which turned negative. We believe all this is temporary, but we could see gold pull back to that uptrend line currently near $1,220. A breakdown under $1,200, however, would suggest a deeper drop is underway and then we would have to watch carefully the low of March 10, 2017 at $1,194. We are only about $100 above the lows of December 2016. Gold ran into the 200 day MA and it proved to be too much at least this first time around and pulled back. Watch the Japanese Yen that held up this past week but if it weakens gold would most likely weaken as well.
(Source)
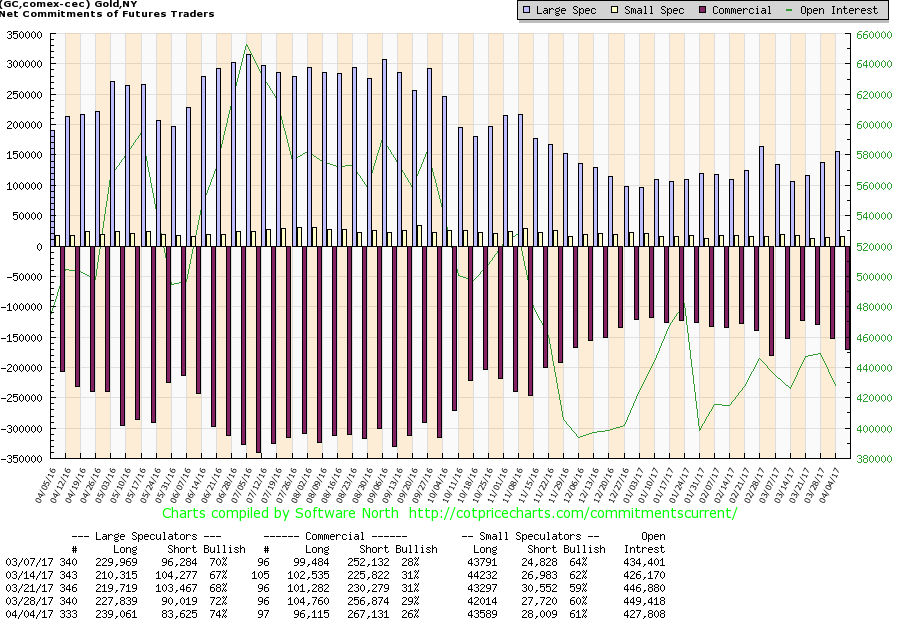
It is probably no surprise that the commercial COT fell this past week to 26% after reaching as high as 31% only a couple of weeks ago. Long open interest fell roughly 9,000 contracts while short open interest was up about 10,000 contracts. Our guess on Friday was that it was commercials selling that helped push down the price of gold as the US$ rose. Remember in the big financial institutions they see flow and if they see funds rushing into US$ then in all likelihood they lean across the desk and say sell gold. Big institutions see big international flows and the foreign exchange markets are huge in relation to any other market. It is estimated that $5.3 trillion of foreign exchange trades every day. Global equity markets on the other hand only trade a pittance at about $190 billion. The NYSE daily volume is roughly $28 billion. Futures markets, which include gold, trade just under $500 billion a day. Nobody comes close to the size of the foreign exchange market. And big financial institutions are the first to see these flows and act accordingly in their own interests. Even bond markets are bigger than the equity markets. To the public, however, the equity markets are the most visible. We think this pullback for gold is temporary and there is no reason gold can’t rise when the US$ rises. It has happened before. The key is that $1,220 holds and we don’t go under $1,200. Then we would need to reassess.
(Source)
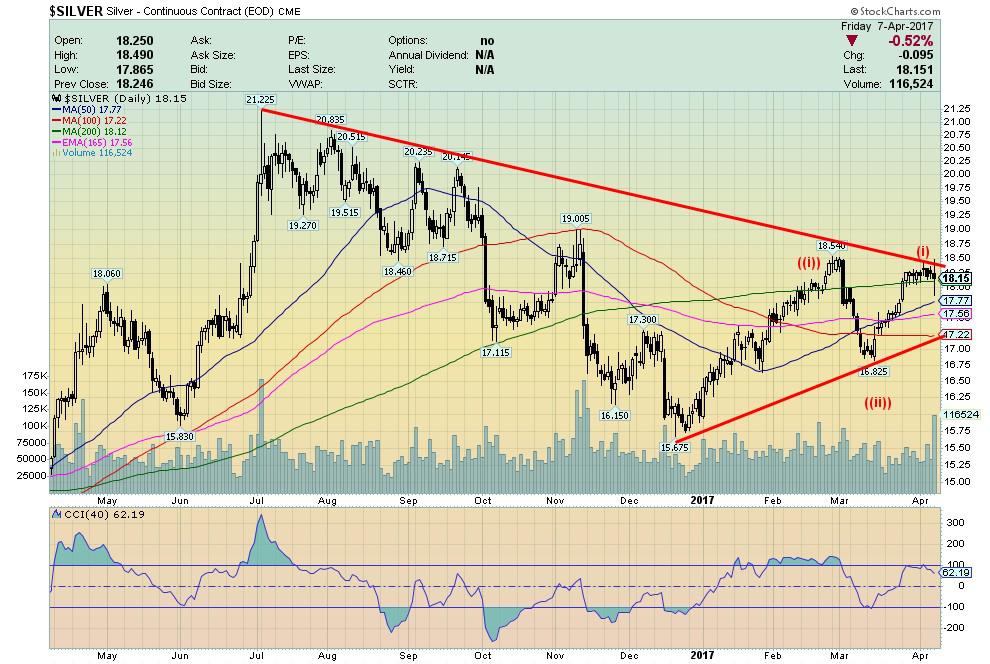
It is the same story with silver. Silver spiked on Friday following the tomahawk attack, then reversed and actually closed lower on the day. While silver has wiggled above the 200 day MA it has had difficulty holding it. Silver has considerable support down to $17.20/$17.25 but a breakdown under that level would spell trouble and a probable break of $16.80. It could then set up a test of the December 2016 low near $15.68. We think this pullback is going to be shallow but we can’t be complacent. A break above $18.50 would suggest another rally is underway.
(Source)
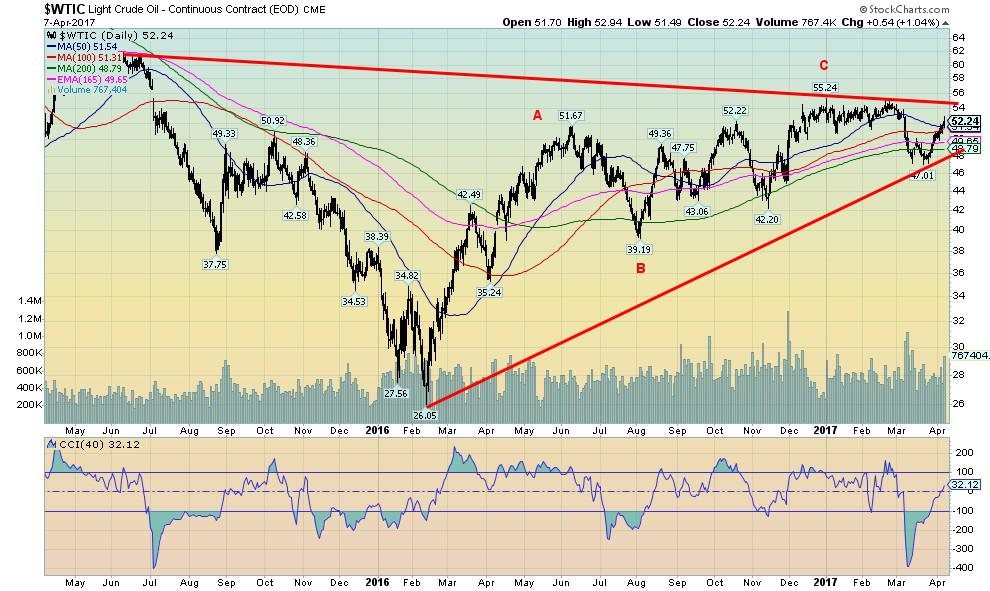
Following the attack on Syria, oil prices rallied and unlike the other markets, they actually held their gains. There are two interesting things with oil prices. One is bearish in that the action from the $26.05 low back in February 2016 appears, on one hand, to be corrective in nature. On the other hand, the high volume that accompanied the rise to $55.24 in January 2017 might indicate something bigger afoot. The pattern is rising as if an ascending triangle with higher highs and higher lows, the classic definition of an ascending triangle. If it is, then oil prices should burst out to the upside above $54/$55 and potentially rise to at least $70. The fireworks in Syria might well be the catalyst. The most recent low was seen at $47 so if the ascending triangle is correct then we should not take out that point. We would like to see more volume come into the upside to confirm that an upside breakout is possible.
GLOSSARY
Trends
Daily – Short-term trend (For swing traders)
Weekly – Intermediate-term trend (For long-term trend followers)
Monthly – Long-term secular trend (For long-term trend followers)
Up – The trend is up.
Down – The trend is down
Neutral – Indicators are mostly neutral. A trend change might be in the offing.
Weak – The trend is still up or down but it is weakening. It is also a sign that the trend might change.
Topping – Indicators are suggesting that while the trend remains up there are considerable signs that suggest that the market is topping.
Bottoming – Indicators are suggesting that while the trend is down there are considerable signs that suggest that the market is bottoming.
—
DISCLAIMER: This article expresses my own ideas and opinions. Any information I have shared are from sources that I believe to be reliable and accurate. I did not receive any financial compensation in writing this post, nor do I own any shares in any company I’ve mentioned. I encourage any reader to do their own diligent research first before making any investment decisions.


Morocco’s Growth Holds at 4.6% as Agriculture Offsets Economic Pressures
Morocco’s economy grew 4.6% in Q1 2026, driven by a strong agricultural rebound offsetting declines in industry. Services expanded moderately...


Abivax Shares Surge as New Trial Data Eases Safety Concerns Over Ulcerative Colitis Drug
Abivax shares surged nearly 36% after positive updated trial results for its ulcerative colitis drug obefazimod reassured investors following earlier...


El Dorado Raises $9M to Expand Cross-Border Fintech Platform
El Dorado, a Latin American fintech improving cross-border financial services, raised a $9 million Series A led by Paradigm with...


Bitcoin Stalls Near $60K as Strategy Moves, ETFs Outflow, and EU MiCA Rules Take Effect
Bitcoin hovers near $60,000 with ETF outflows, while Strategy boosts reserves, sells BTC, and raises dividends to reassure investors. Ethereum...


Cannabis Dominates Global Drug Use: Trends, Risks, and Shifting Markets
Cannabis remains the world’s most widely used illicit drug, with 256 million users in 2024, surpassing all others combined. Growth...
 |
|
 |  |
 |
|
-

 Crypto1 week ago
Bitcoin Holds Steady as Microtransactions Surge and ETF Inflows Continue
-

 Biotech2 weeks ago
AseBio 2025 Report Highlights Growth and Future Potential of Spanish Biotechnology
-
 Cannabis5 days ago
Tilray (TLRY) Falls as Bearish Momentum Persists Despite Marketing Push
-

 Biotech1 week ago
New Gene Therapies Transform Rare Disease Care, but Gaps Remain
You must be logged in to post a comment Login