Featured
Indicators suggest a sharp stock market decline ahead
The average of seven bubble crashes in the last 100 years is 42 percent in the first 2.6 months. If the pattern continues, the next stock market crash may have already started.

I’ve warned for years, and with increasing frequency of late, that the first crash when a major stock bubble of this magnitude finally tops is 42 percent in the first 2.6 months.
That’s the average of seven bubble crashes in the last century.
The 1929 crash started off with a 49 percent crash in just over two months—the most extreme.
Look at this correction thus far, compared to 1929 for the Dow…
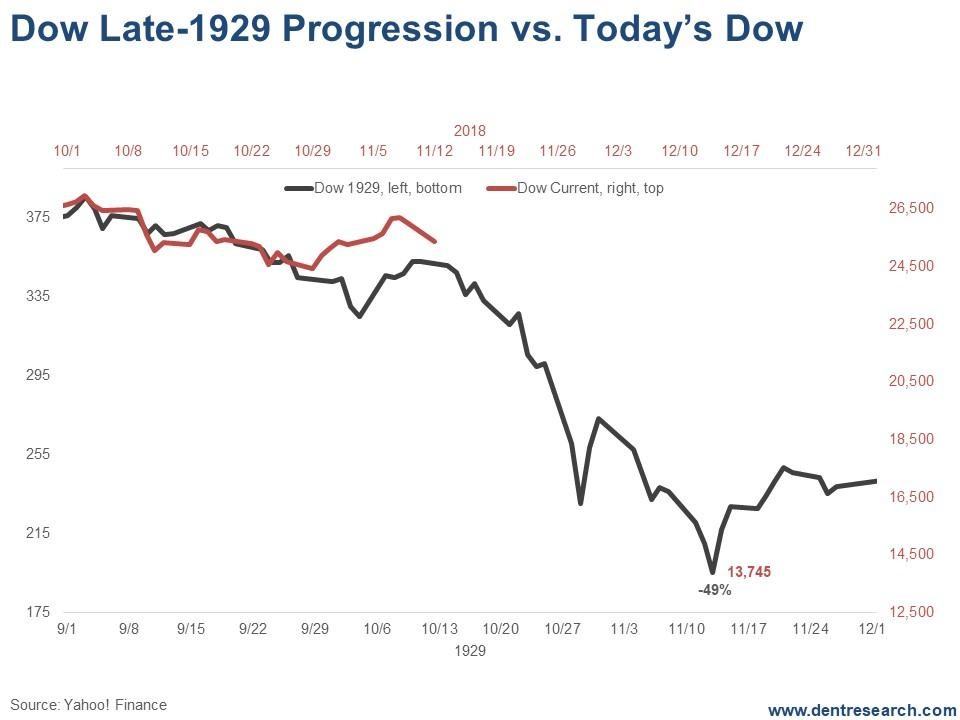
© Harry Dent
If it continues to follow the dramatic crash pattern of early September to early November 1929 then the most violent wave down could be starting now… and this first overall crash could be over by early December or as late as early January.
The target in that scenario would be at February’s crash low of around 15,500 on the Dow, down 42.5 percent from the late September top.
But here’s a scarier chart than that…
This one suggests that the smart money hasn’t been buying into the rally from February through September 2018 and could be leading the selling here, which would be ominous and increase the likelihood of such a 40 percent or so crash just ahead.
Look at this…
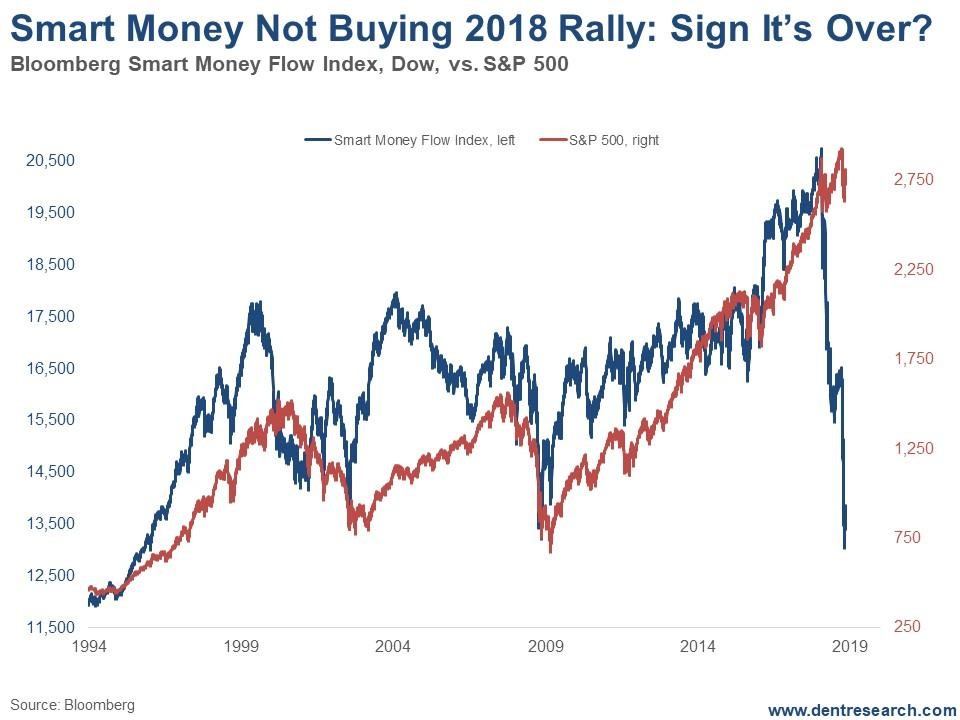
© Harry Dent
This index measures the buying into the close (calculated smart money) versus the buying right after the open (dumb money reactions).
This is both the sharpest and deepest crash in this indicator.
The drop in this index was 20 percent just before and into the early part of the 2000 tech crash. It was down 24 percent just prior and into the 2007-08 crash.
This decline is 38 percent and straight down!
If that is a correct measure of the smart money sentiment, then they not only didn’t buy into the rally that peaked in September while the dumb money was piling in the most, but they would be selling and shorting into this decline and on any bounces.
All of this is to warn you that the next two or three weeks is a dangerous period.
Looking ahead…
If late September was a major top, then we should see a sharper deeper wave down any day and it may already have started. This continues to be a good time to hedge through options near term, as Rodney proposed in the November issue of Boom & Bust.
If we don’t see such a sharp crash by early December, it isn’t likely to happen. That would be the time to exit such option strategies as December is otherwise a good month.
Even if this imminent crash doesn’t happen, your hedging options could have some profits if the markets just go down more modestly. But you’d have to be willing to lose your premium if the markets head back up strongly instead.
(Featured image by DepositPhotos)
—
DISCLAIMER: This article expresses my own ideas and opinions. Any information I have shared are from sources that I believe to be reliable and accurate. I did not receive any financial compensation for writing this post, nor do I own any shares in any company I’ve mentioned. I encourage any reader to do their own diligent research first before making any investment decisions.


Youth Cannabis Use in Colorado Is Falling — But the Full Story Is More Complex
The 2026 Colorado survey shows teen cannabis use fell to 10 percent in 2025, down from 21 percent in 2015....


Morocco’s Growth Holds at 4.6% as Agriculture Offsets Economic Pressures
Morocco’s economy grew 4.6% in Q1 2026, driven by a strong agricultural rebound offsetting declines in industry. Services expanded moderately...


Abivax Shares Surge as New Trial Data Eases Safety Concerns Over Ulcerative Colitis Drug
Abivax shares surged nearly 36% after positive updated trial results for its ulcerative colitis drug obefazimod reassured investors following earlier...


El Dorado Raises $9M to Expand Cross-Border Fintech Platform
El Dorado, a Latin American fintech improving cross-border financial services, raised a $9 million Series A led by Paradigm with...


Bitcoin Stalls Near $60K as Strategy Moves, ETFs Outflow, and EU MiCA Rules Take Effect
Bitcoin hovers near $60,000 with ETF outflows, while Strategy boosts reserves, sells BTC, and raises dividends to reassure investors. Ethereum...
 |
|
 |  |
 |
|
-

 Markets6 days ago
Commodity Markets Pause as Oil Falls, Metals Correct, and Grains Show Mixed Signals
-

 Africa2 weeks ago
Egypt’s Net Foreign Assets Rise as External Position Continues Gradual Strengthening
-

 Markets2 days ago
Oil Surges on U.S.–Iran Tensions as Global Markets Show Diverging Trends and Rising Risk Fears
-

 Markets1 week ago
Cocoa Market Faces Mixed Trends Amid Rising Supply and Weak Demand
You must be logged in to post a comment Login