Markets
Powell Says Interest Rates Could Stay Higher for Longer
An interesting week as stocks rose again following last week’s big jump. Or did they? Ok some did but a survey of the week shows that once again the big winners were the S&P 500 and the NASDAQ led by the FAANGs. But the S&P 500 Equal Weight Index and the smaller S&P 400 and S&P 600 indices fell. A divergence. The Dow Jones Industrials went up but the Dow Jones Transportations went down. A divergence.

Everything is looking rosy again. The stock market has bounced back. Bond yields have been falling. Oil and gold have been falling. The US index has been rising. Whatever thoughts there are of wars, geopolitical problems, dysfunctional government, high-interest rates, massive debt, rising bankruptcies, and sliding employment numbers, the market appears to have suddenly pushed it all into the background. It is “so yesterday.”
Except nothing has really changed much. Maybe it’s premised on a week being a long time in the markets. A week ago, stock markets took off to the upside. They followed through this past week. Risk on. At least for the stock market. Ok, at least for part of the stock market. But it was risk-off for gold and oil, both of which stumbled a bit last week, then succumbed to the downside this past week. Risk off. Gold a safe haven? Try bonds instead.
As interest rates remain high, having gone up at one of the fastest paces ever, cries of pain are beginning to rise. Here in Canada, we saw headlines that people are walking away from home purchases and leaving their deposits behind. Suddenly, that affordable house (even with a huge mortgage) doesn’t look so attractive anymore with the bank demanding a higher downpayment and the mortgage rate a lot higher. We’re seeing vacancy rates rise in commercial buildings. Of course, that’s not being helped with the bankruptcy of WeWork (was WE (NYSE), now it’s WEWKQ (Pink Sheets)) as they vacate space. A $47 billion market cap to $69 million (and falling). Ouch!
Rising interest rates are causing pain. It’s almost as if everyone thought that interest rates would never rise. That is, until they did. Then the cries came that it was too much too fast. In March 2020, because of the pandemic, central banks globally pumped trillions into their economies with quantitative easing (QE), coupled with billions in support payments to prevent a complete meltdown as the unemployment rate soared everywhere. They also lowered interest rates to zero and, in some cases, below zero (EU, Japan). The Fed rate (U.S.) fell to 0–0.25%; now it’s 5.5%. The ECB (EU) lowered its rate to 0% and now it’s 4.5%. The BOJ (Japan) lowered its rate to negative 0.1% and, well, it’s still negative 0.1%. Canada is down to 0.25% and it’s now 5.0%.
Yes, it has worked as inflation has come down from its peak and the unemployment rates in Canada and the U.S. hit record lows. But inflation is sticky and now the Fed is saying that interest rates could stay higher for longer and hinting that they may not be finished hiking rates. There are signs that the economy is slowing as the EU slides into recession, albeit a shallow one, Canada is verging on a recession, while Japan is constantly experiencing low growth. Only the U.S. has maintained rapid growth, although given the most recent employment numbers, they too may be slowing.
Global debt hit $307 trillion in the first half of 2023. Debt related to derivatives but not included is estimated at least another $50–$65 trillion. The U.S., according to the U.S. Debt Clock (www.usdebtclock.org), has $103.1 trillion, a third of global debt. Is it a ticking time bomb? Is it any surprise then, that the total debt to real GDP ratio in the U.S. is now at 432%? In 2000, that ratio was 268%. Our chart shows how much all sectors debt, real GDP, and all sectors debt/real GDP have grown since 2000. Percentage gains are since 2000. All debt (government, corporate financial, and non-financial/consumer) is up $76.3 trillion since 2000, while real GDP is up only $8.7 trillion. In 2000 at this time, the U.S. ran a budget surplus of $248.6 billion. Today, the deficit is $1,869.6 billion. The budget deficit turned negative in 2002 and has been negative ever since. In 2020, the year of the pandemic, it hit a record $3.1 trillion.
U.S. All Sectors Debt, Real GDP, All Sectors Debt/Real GDP 2000–2023 ($billions)
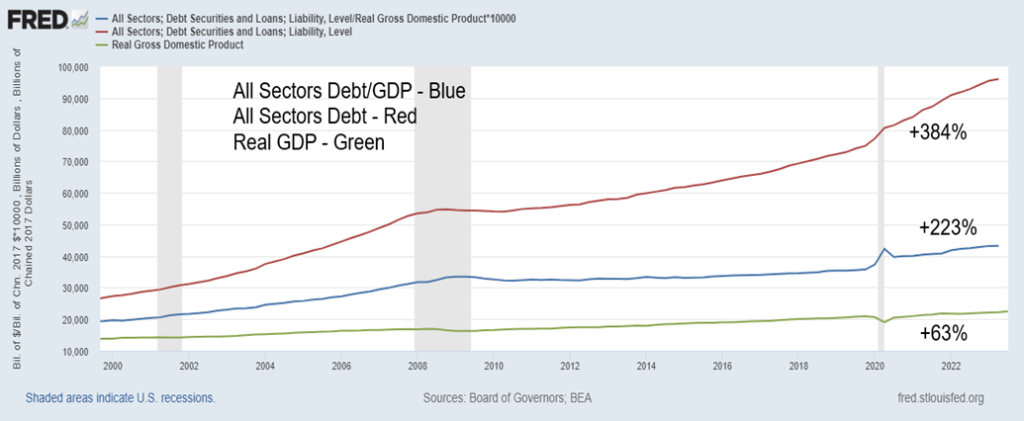
Note: All Sectors Debt/Real GDP has been multiplied by 10,000 to reflect at the same scale as the debt.
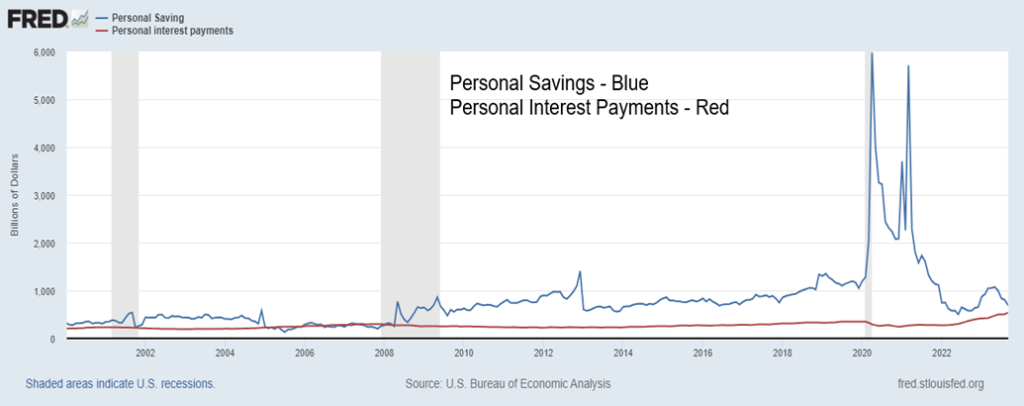
The consumer has problems. He’s been spending all that money that was saved up as a result of support payments during the pandemic. The consumer has also been taking on more debt. Total personal debt (includes student loans, mortgages, credit cards, lines of credit (LOC), etc.) has jumped $7.7 trillion since this time in 2020. Canadians have some of the highest consumer debt in the world. Mortgages need to be rolled over at much higher rates.
Students are having trouble paying back their student debt. Attempts to forgive that debt failed. Delinquencies and defaults are rising but have not as yet reached crisis proportions. We can’t help but notice that personal savings, which soared during the pandemic, are now falling, even as the consumer also took on more debt. As a result, interest payments on that debt have been rising. What this tells us is that the consumer has been holding up the economy with spending. That could soon hit a wall as personal savings fall and the interest on all the debt taken on rises.
Personal Savings and Personal Interest Payments 2000–2002 ($billions)
The same thing is happening with the federal government. With rising interest rates, the interest on the federal debt is rising. In the U.S., interest on the debt is now approaching $1 trillion dollars. That’s more than what the U.S. spends on defense (at least, the official defense numbers). Interest on the debt as a percentage of total government expenditures is also rising. What is interesting is that, while the ratio is rising, it remains below levels seen during the 1980s as expenditures grew sharply during the Reagan/Bush years and high interest rates from the 1970s impacted the federal debt.
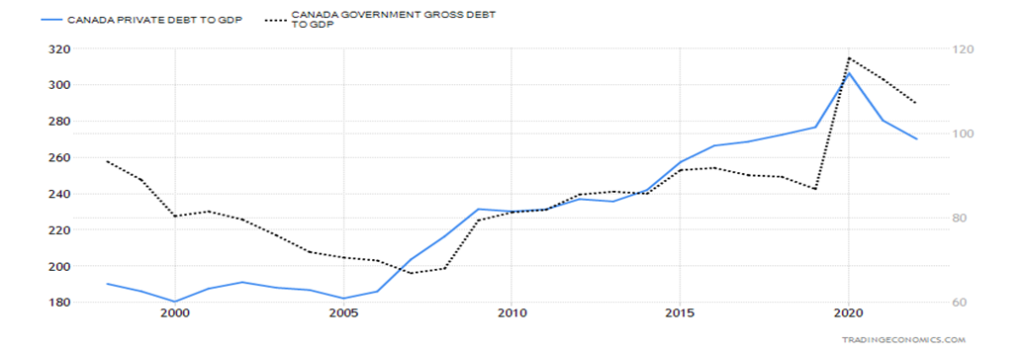
While Canada’s federal debt has gone up sharply since the pandemic, its federal debt to GDP ratio today stands at only 56.7% vs. the U.S.’s federal debt to GDP at 124.4%. Canada has the lowest federal debt to GDP in the G7. When one adds in provincial and municipal debt, the ratio rises to 107%, whereas the U.S. with state debt and municipal debt only goes up to 138%.
But the worrisome part for Canada is the consumer debt which stands at 103% of GDP, the third highest in the world. Corporate debt is also a problem in Canada. Private debt to GDP stands at 270% of GDP, but strip out the consumer’s share and it implies that corporate debt (financial and non-financial) in Canada to GDP is 100%.
Our chart shows both Canada’s government debt to GDP (federal, provincial, municipal debt) and private debt (households, corporations financial and non-financial) debt to GDP. As with the U.S., rising interest rates are raising the amount spent on debt service (interest payments). And, as noted, we are seeing an uptick in delinquencies and defaults. Power of sale for houses has been rising.
Translate this globally with rising interest rates negatively impacting in the EU and Japan as well. China has fiscal room to stimulate the economy even as its real estate sector is in serious trouble, they have the wherewithal to weather the storm.
Federal Government Interest Payments
Federal Government Interest Payments as a Percentage of Total Government Expenditures
1974–2023
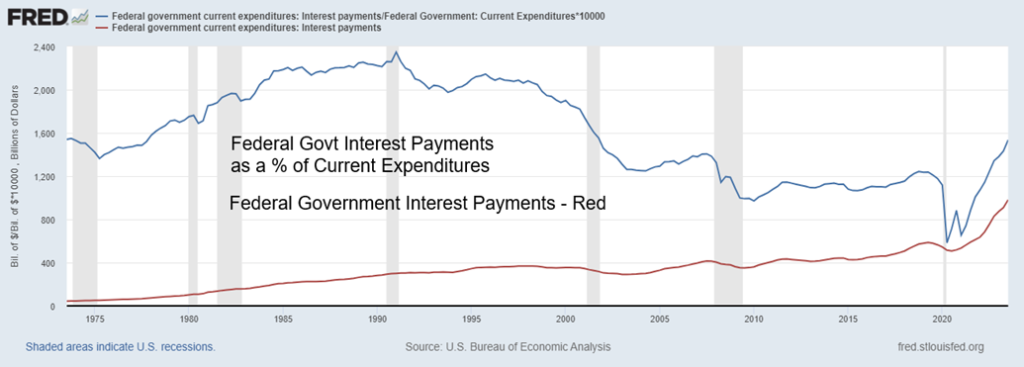
Note: Federal Government Interest payments as a % of Government expenditures has been multiplied by 10,000 to reflect the same scale as the debt.
Canada Private Debt (households, corporations financial and non-financial) and Government Debt (Federal plus Provincial) to GDP 1998–2023
While things have turned favorable for markets in the past couple of weeks, we suspect it is not destined to last. Trouble is brewing on numerous fronts and the wars could still spread. Governments talk a good game, but they can’t mask the rot underneath, which has become entrenched. We include a table on returns since the market bottom in March 2009 and since 2020, which includes the pandemic. What is interesting is the stock market has gone through a bull market that lasted from 2009 to the top in 2022. The poorest performers have been gold stocks. Although gold and silver haven’t been gangbusters compared to the stock market, they are up during the period. Note the huge rise in interest rates.
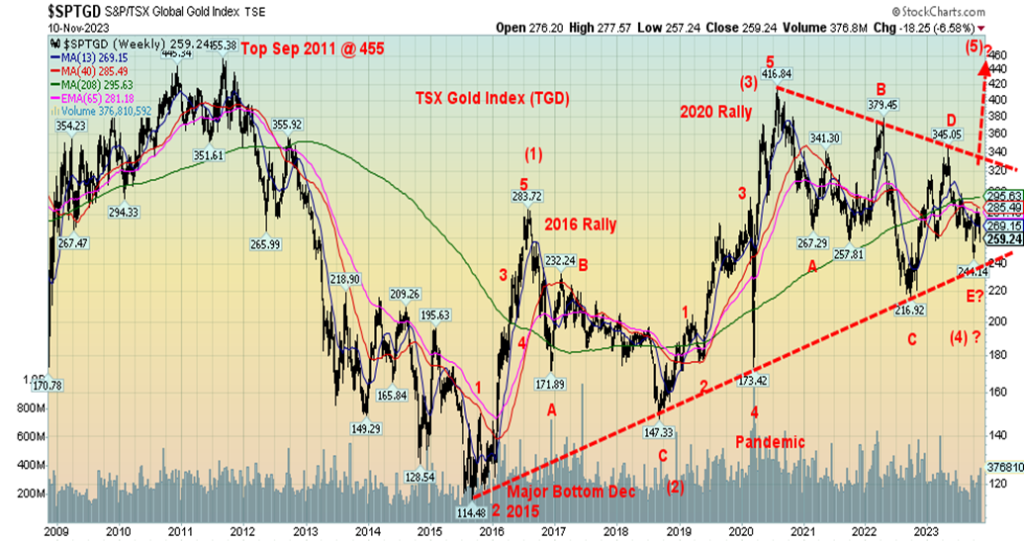
Gold and gold stocks have been in a 12-year bear market. Yes, there have been two good periods in 2016 and 2020, but they were bear market rallies. As we have noted numerous times, the gold stock indices, Gold Bugs Index (HUI) and TSX Gold Index (TGD) remain well down from their 2011 highs, down 67% and 42% respectively. The TSX Venture Exchange (CDNX), which is dominated by junior gold mining and mining stocks, is down 85% from its 2007 high, a 16-year bear with two decent rebounds in 2010/2011 and again in 2020/2021. Are they overdue?
Stock markets in a 13-year bull market (2009–2022) and gold stocks in a 12-year bear market (2011–2023). Are they about to switch places? Our weekly chart of the TSX Gold Index (TGD) appears to suggest just that. Since the peak in August 2020, the TGD appears to be forming an ABCDE-type of corrective symmetrical triangle pattern. If that’s correct, then a firm breakout over 340 could suggest a move to around 540. Got gold?
TSX Gold Index 2009-2023 (weekly)
Selected Returns 2009–2023
| Gain (Loss) Since March 1, 2009 % | Gain (Loss) Since January 1, 2020 % | |
| Indices | ||
| S&P 500 | 496.2 | 35.7 |
| S&P 500 Equal Weight | 526.7 | 21.4 |
| Dow Jones Industrials | 383.0 | 19.5 |
| NASDAQ | 890.7 | 52.1 |
| Russell 2000 | 432.0 | 7.7 |
| NY FANG Index | 285.2 * | 152.4 |
| TSX | 140.4 | 14.5 |
| TSX Venture (CDNX) | (40.3) | (11.0) |
| Tokyo Nikkei Dow (TKN) | 325.0 | 36.0 |
| Shanghai Index (SSEC) | 46.6 | Flat |
| Gold & Oil Indices | ||
| Gold Bugs Index (HUI) | (26.7) | (12.1) |
| TSX Gold Index (TGD) | (15.1) | 0.34 |
| ARCA Oil & Gas (XOI) | 117.9 | 41.6 |
| TSX Energy Index (TEN) | 28.4 | 73.0 |
| Interest Rates | ||
| Fed Rate | 2,861.1 | 243.9 |
| Bank of Canada Rate | 2,000.0 | 285.7 |
| U.S. 10-year | 48.7 | 133.9 |
| Cdn 10-year (CGB) | 23.2 | 118.2 |
| Currencies | ||
| US$ Index | 19.8 | 9.8 |
| Cdn$ | (8.0) | (6.0) |
| Euro | (15.5) | (4.5) |
| Commodities | ||
| Gold | 107.7 | 28.5 |
| Silver | 73.4 | 26.8 |
| WTI Oil | 68.3 | 23.4 |
| Natural Gas | (26.0) | 41.9 |
| Economy ** | ||
| U.S. GDP | 192.2 | 20.0 |
| U.S. Federal National Debt | 309.0 | 24.4 |
| U.S. Budget Deficit | 380.0 | (24.0) |
| U.S. Total Debt | 203.0 | 27.0 |
| Canada GDP | 133.0 | 3.6 |
| Canada Federal Debt | 240.0 | 27.8 |
* NY FANG Index returns since October 2017 when it started
** Dated from November 2009 and November 2020
Chart of the Week
Poor man’s gold—silver. We don’t seem to pay as much attention to silver. But silver is a key component in many things: electrical switches, solar panels, chemical-producing catalysts. Almost every computer, mobile phone, automobile, and appliance contains silver. Some even eat it or drink it. Silver is used for jewelry, tableware, mirrors, and even by your dentist. It’s used in medicine and photography. While its use in coins has fallen, at one-time silver coins dominated. The Roman denarius was the reserve currency at the time. Many items that we use daily contain silver.
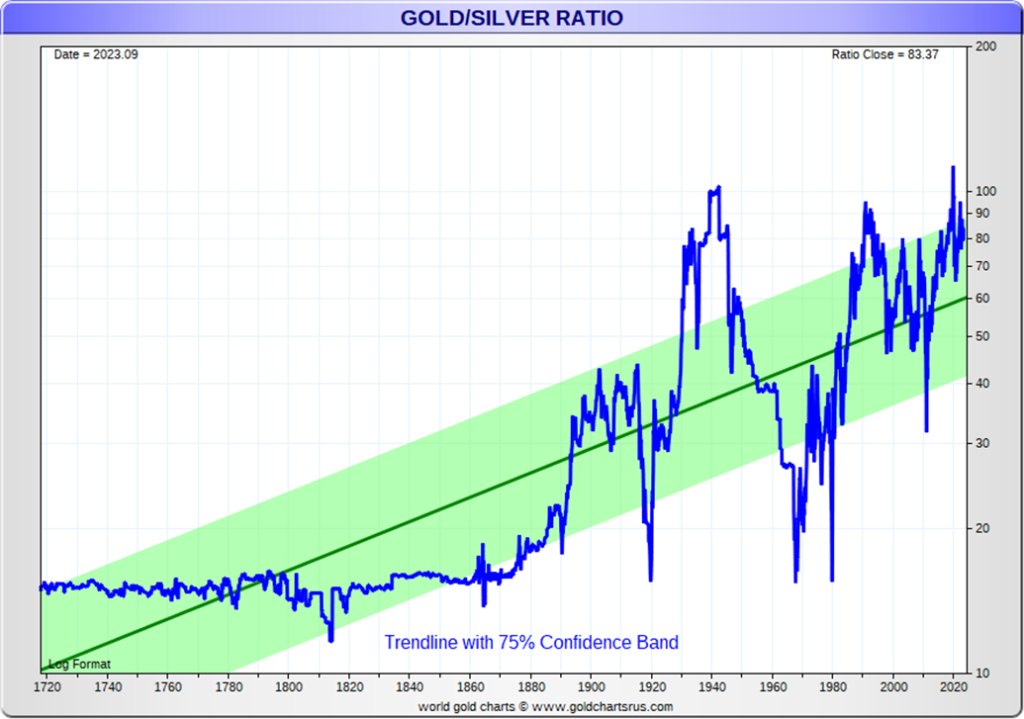
However, on a day-to-day basis, we hear more about gold than we do about silver. The historical ratio of silver to gold is 15:1, but the reality in nature is that it is about 19:1. That often begs the question as to why today’s ratio is 86:1. Historically, it was averaged for years up until the late 19th century between 15:1 to 16:1. The Romans set it at 12:1. The Venetians, when they were renowned bankers during the 14th century, set it 14.2:1. The U.S. Coinage Act of 1792 set it at 15:1.
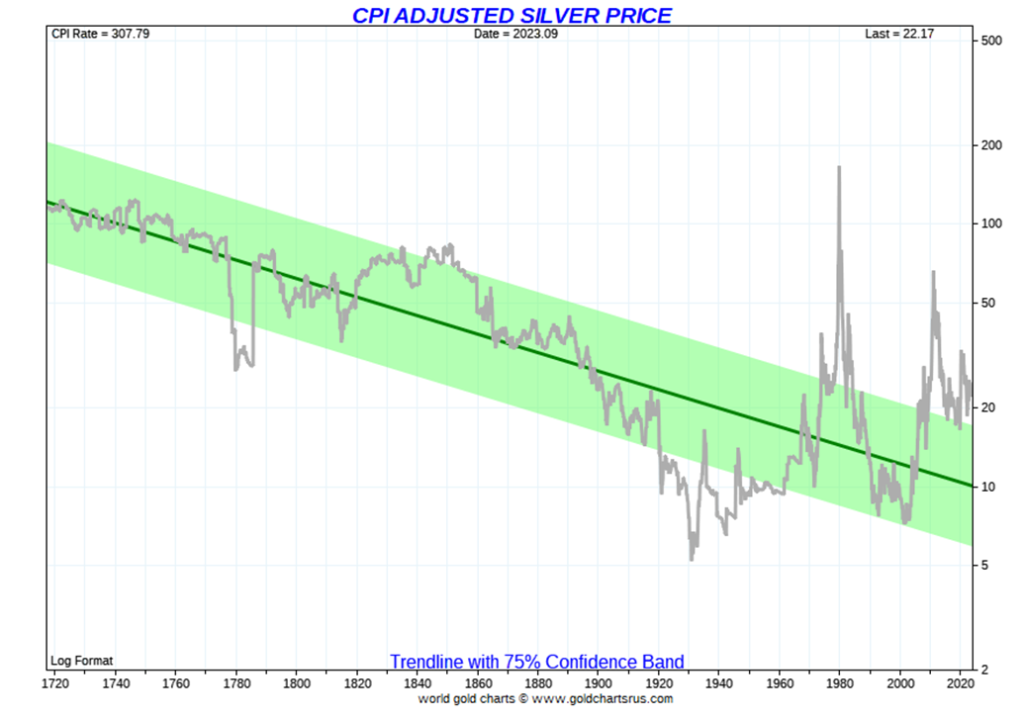
It wasn’t until the late 19th century that the ratio began to rise. What changed it was the massive discovery of silver found in the Americas, beginning with the Spanish conquests. That and government manipulation. Recall that when President Roosevelt revalued the U.S. dollar to $35/ounce for gold, the silver price was not changed. The result was that by 1939 the gold/silver ratio climbed to 98:1. After the abandonment of the gold standard in 1971, the ratio fluctuated again and by 1991 stood at 97.5:1. In 2020, the ratio peaked at 127:1. Dreams of 16:1 were just that—dreams. However, at the major top in 2011 the ratio had fallen to 30.7:1. The dreams stay alive.
It’s the same with price predictions. We’ve seen forecasts that silver would soar to $300. Far-fetched? On an inflation-adjusted basis, as our chart shows, it hit a price of around $165 at the 1980 peak.
Silver demand has been growing, primarily for industrial use, especially in green energy. Yet production of silver has declined over the past decade and warehouse reserves of silver have been falling. Production has actually been falling. The annual deficit between production and demand is roughly 13,000 metric tonnes, the difference being made up through recycling silver. The world’s largest producer of silver is Mexico, followed by China. The largest reserves are held in Peru and again followed by China. No surprise that the world’s largest consumer of silver is the U.S.
Demand up, production lagging is a recipe for higher prices. Is that why the official price of silver is low, yet coins regularly command premiums up to 25%, whereas gold’s premium is only about 5.5% (note: for a 1 oz Silver Maple and 1 oz Gold Maple)? Maybe the motto should be “Got silver”?
Markets & Trends
| % Gains (Losses) Trends | ||||||||
| Close Dec 31/22 | Close Nov 10, 2023 | Week | YTD | Daily (Short Term) | Weekly (Intermediate) | Monthly (Long Term) | ||
| Stock Market Indices | ||||||||
| S&P 500 | 3,839.50 | 4,415.24 | 1.3% | 15.0% | up | up | up | |
| Dow Jones Industrials | 33,147.25 | 34,283.10 | 0.7% | 2.8% | up | up (weak) | up (weak) | |
| Dow Jones Transport | 13,391.91 | 14,426.49 | (0.6)% | 7.7% | down (weak) | down | neutral | |
| NASDAQ | 10,466.48 | 13,798.11 | 2.4% | 31.8% | up | up | up (weak) | |
| S&P/TSX Composite | 19,384.92 | 19,654.47 | (0.9)% | 1.4% | neutral | down | neutral | |
| S&P/TSX Venture (CDNX) | 570.27 | 510.28 | (2.9)% | (10.5)% | down | down | down | |
| S&P 600 (small) | 1,157.53 | 1,114.51 | (3.0)% | (3.7)% | down (weak) | down | down | |
| MSCI World | 1,977.74 | 2,051.15 | 1.4% | 3.7% | up (weak) | down | down | |
| Bitcoin | 16,531.31 | 37,252.21 | 7.5% | 125.3% | up | up | up (weak) | |
| Gold Mining Stock Indices | ||||||||
| Gold Bugs Index (HUI) | 229.75 | 209.75 | (7.8)% | (8.7)% | down | down | down | |
| TSX Gold Index (TGD) | 277.68 | 258.97 | (6.7)% | (6.7)% | down | down | down | |
| % | ||||||||
| U.S. 10-Year Treasury Bond yield | 3.88% | 4.62% | 1.1% | 19.1% | ||||
| Cdn. 10-Year Bond CGB yield | 3.29% | 3.84% | 2.7% | 16.7% | ||||
| Recession Watch Spreads | ||||||||
| U.S. 2-year 10-year Treasury spread | (0.55)% | (0.43)% | (59.3)% | (21.8)% | ||||
| Cdn 2-year 10-year CGB spread | (0.76)% | (0.74)% | (13.9)% | (2.63)% | ||||
| Currencies | ||||||||
| US$ Index | 103.27 | 105.82 | 0.8% | 2.5% | neutral | up | up | |
| Canadian $ | 73.92 | 72.45 | (1.1)% | (2.0)% | down | down | down | |
| Euro | 107.04 | 106.86 | (0.4)% | (0.2)% | up | down | down | |
| Swiss Franc | 108.15 | 11.85 | (0.4)% | 2.5% | neutral | neutral | up | |
| British Pound | 120.96 | 122.24 | (1.2)% | 1.1% | neutral | down | neutral | |
| Japanese Yen | 76.27 | 66.00 | (1.4)% | (13.5)% | down | down | down | |
| Precious Metals | ||||||||
| Gold | 1,826.20 | 1,937.70 | (3.1)% | 6.1% | neutral | up | up | |
| Silver | 24.04 | 22.28% | (4.3)% | (7.3)% | down (weak) | down (weak) | down (weak) | |
| Platinum | 1,082.90 | 845.60 (new lows) | (10.5)% | (21.9)% | down | down | down | |
| Base Metals | ||||||||
| Palladium | 1,798.00 | 978.80 (new lows) | (13.3)% | (45.6)% | down | down | down | |
| Copper | 3.81 | 3.59 | (2.5)% | (5.9)% | down | down | down | |
| Energy | ||||||||
| WTI Oil | 80.26 | 77.17 | (4.2)% | (3.9)% | down | neutral | neutral | |
| Nat Gas | 4.48 | 3.03 | (13.8)% | (32.3)% | down (weak) | up | down (weak) | |
New highs/lows refer to new 52-week highs/lows and, in some cases, all-time highs.
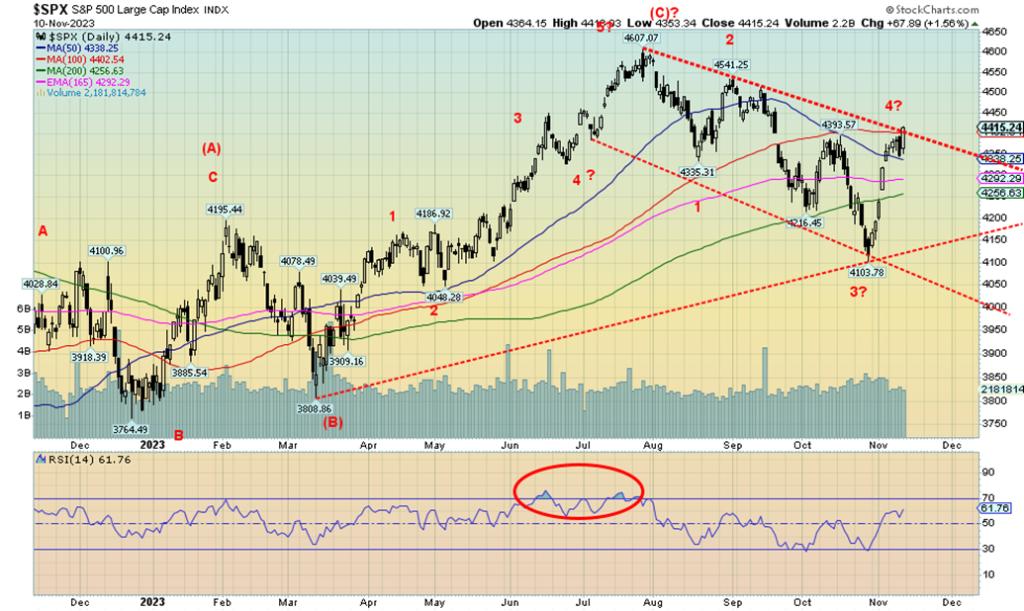
Is the S&P 500 (SPX) poised to break out? It appears that way as we penetrated that downtrend line from the July top this week. The NASDAQ did break over the same line. But it was not a universal march to the upside. And that is a warning sign that this rebound rally may not have much left in the way of legs. The SPX gained 1.3% this past week, after the previous week’s 5%+ gain.
The Dow Jones Industrials (DJI) was up 0.7%, but the Dow Jones Transportations (DJT) diverged, losing 0.6%. The NASDAQ was up 2.4%, thanks to the strong performance of the FAANGs. That also helped the SPX. But when we look over at the S&P 500 Equal Weight Index (SPXEW), we note it was down 0.6%, a negative divergence with SPX. Seems it was only the FAANG stocks holding things up.
The NY FANG Index was up 4.6%. When we looked over at the other indices, things were not so good. The S&P 400 (Mid) lost 1.6% and the S&P 600 (Small) dropped 3.0%. More divergences. If they are not going to participate, the SPX is not going to go too much further unless, of course, the FAANGs keep going up, even if nobody else is.
In Canada, the TSX lost 0.9%, while the TSX Venture Exchange (CDNX) was worse, down 2.9%. In the EU, the London FTSE fell 1.2%, the EuroNext was off a small 0.1%, France’s CAC 40 was flat, while the German DAX gained a small 0.3%. The world MSCI Index was up 1.4%. In Asia, China’s Shanghai Index (SSEC) gained 0.3%, Tokyo’s Nikkei Dow (TKN) gained 2.9%, but Hong Kong’s Hang Seng (HSI) fell 2.6%. Another divergence? The big star of the week was Bitcoin, up another 7.5% and up 125% in 2023. Bitcoin the star? It hit $38,000 this past week. But the market is small and very speculative. The entire crypto market is only $1.4 trillion. Apple alone has a market cap of $2.9 trillion.
SPX is at the downtrend line and the 100-day MA. SPX has to break through this week if it’s to continue higher. A move over 4,500 would be convincing and set up the potential for new highs over the July high of 4,607. SPX ignored the hawkish Fed and the backup in bond yields. With the CPI out this coming week, it’ll have to be good to help push the SPX higher. As well, it helps if things stay good in the Middle East war.
The war spreading would not be good. The markets are not impacted by the humanitarian crisis in Gaza. A breakdown under 4,300 would be negative, but we’d have to get below 4,250 and the 200-day MA to send us back into the bear. Under 4,100 we are definitely back in the bear and headed lower. Volume was not impressive on this rise. This past week, with only the SPX and NASDAQ up with any vigour, is a significant divergence with the rest of the market. We may be in the best six months, but we have negative memories of 2007–2008 and 2018 where the best six months died.
University of Michigan Consumer Sentiment 1998–2023
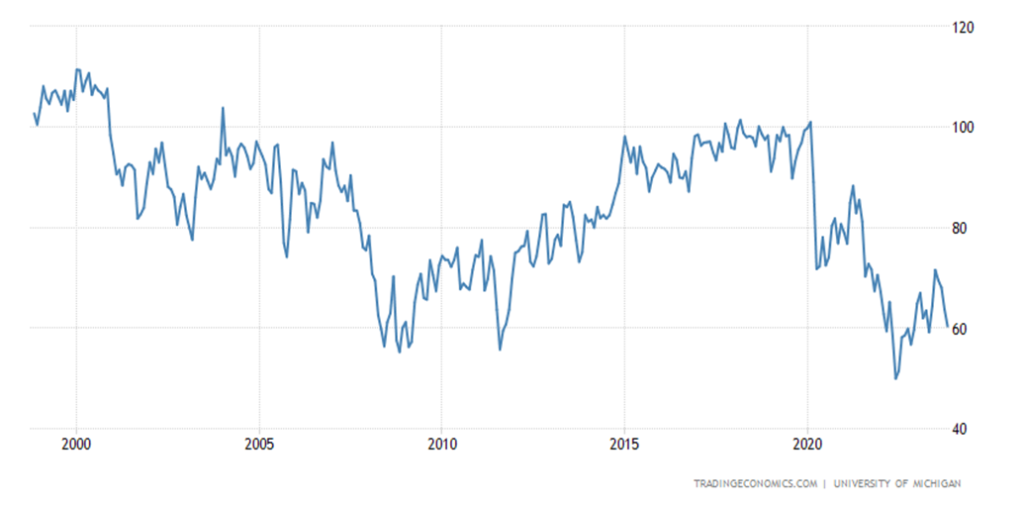
The University of Michigan Consumer Sentiment Index fell to 60.4 from 63.8 in October. The market had expected 63.7. Didn’t seem to do much as stocks rose and gold fell. Maybe it’s because inflation expectations rose to 4.4% vs. last month’s 4.2%. These are all preliminary as the final doesn’t come until the last week of the month. But the key sentiment indicator is not going in the right direction, especially with the important retail Christmas season coming.
Quite a number of places are just hanging on and depend on Christmas sales to put them over the top. But here we are back where we were during the 2007–2009 Great Recession and, going back even further, during the early 1980s recession. Yet we are not as yet in a recession. That suggests trouble ahead when a recession actually arrives, because if they are that gloomy now what will it be like when a recession does come? We are, however, hanging above the lows of the 2020 pandemic recession. That actually didn’t bottom until June 2022 at 50. That stands as the record low.
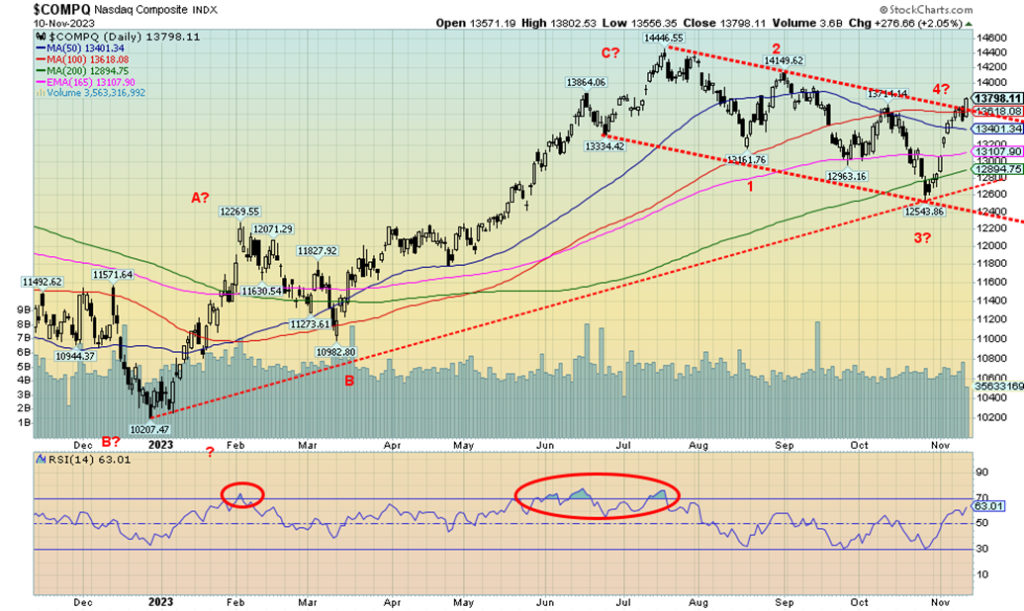
The NASDAQ was the best performer of the week of the major indices, gaining 2.4%. The rise was thanks to the FAANG stocks as the NY FANG Index jumped 4.6%. Microsoft made new all-time highs but actually only gained 1.9% on the week. The big winner was the former big leader of the AI stocks Nvidia, which was up 7.4%. Snowflake gained 7.0%, Apple was up 6.6%, Advanced Micro Devices (AMD) gained 5.7%, while Meta (Facebook) was up 4.5%. Any losers? Yes, Tesla fell 2.4%, Baidu was down 3.4%, and Alibaba was off 3.0%. Setting aside Tesla, it seems that the Chinese stocks were spurned.
The NASDAQ appears to be breaking the downtrend line from the July top. The S&P 500 is testing the same line, but others are not. All this points to the rally being narrow, just as it was when it rose to the July 2023 top. A narrow rally led by just a few FAANG stocks is not sustainable. Looking over at the Russell 2000 which is the small-cap index, we note it fell 3.1% on the week. The NASDAQ next has resistance at 14,000 to 14,200, but above 14,200 we could test or even surpass the July high of 14,446. There is considerable support for the NASDAQ down to 12,800, with interim support seen at 13,400 and 12,900/13,000. Finally, volume is lagging on this rebound, all suggesting this is a corrective rally only and should ultimately fail.
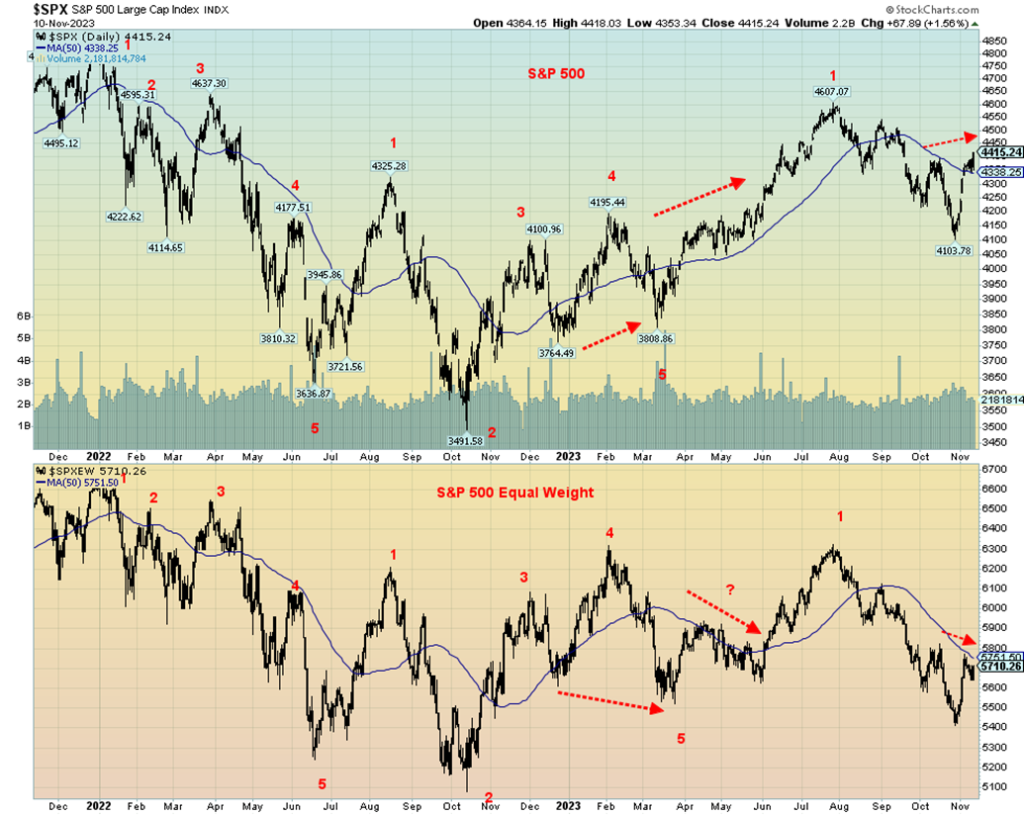
Last week we noted the potential growing divergence between the DJI and the DJT. This week we note the potential divergence between the S&P 500 (SPX) and the S&P 500 Equal Weight (SPXEW). We already noted that this past week the SPX was up while the SPXEW actually fell. The SPX was being driven higher by a limited number of stocks—the FAANGs. In other words, roughly 7 to 12 stocks (see our comments under the NASDAQ chart).
But, on an equal weight basis, the SPX suddenly doesn’t look so good. The SPXEW is fading away from its 200-day MA while the SPX is not only taking out its 200-day MA but, instead, it is making new highs over the October high. No, none of this suggests that the market has topped out. That is confirmed only when both make new lows. But the divergence does highlight that this rebound rally is just that—a rebound and most likely not the start of a sustained bull market. If that were the case, then we’d need both SPX and SPXEW making new highs and rising together. They are not.
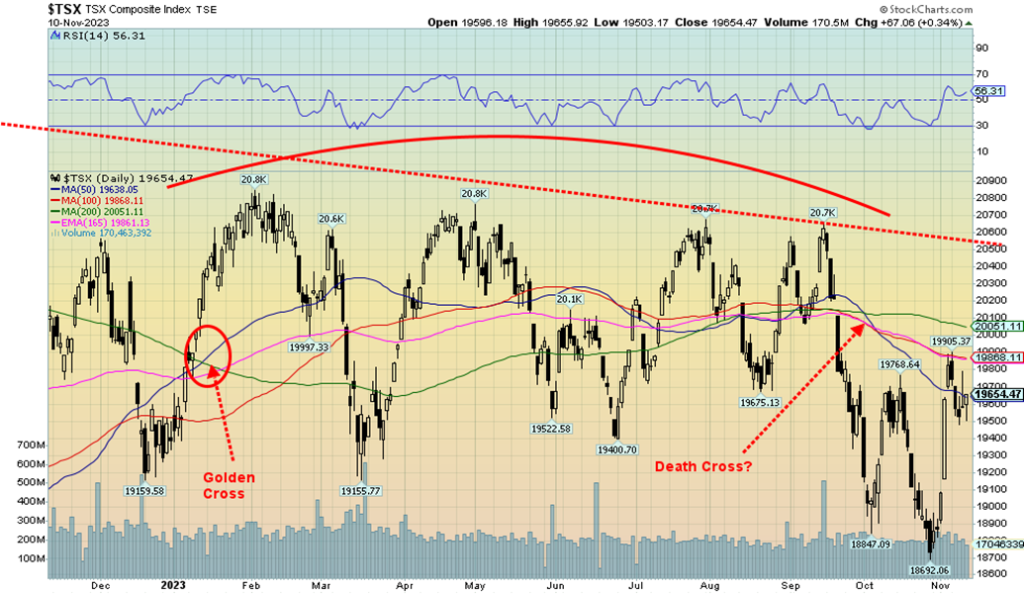
The TSX did not join the party this past week. Rather than rise, the TSX fell, losing 0.9% this past week. The TSX Venture Exchange (CDNX) was even worse, losing 2.9%. The CDNX is quite depressed. There was an interesting article in The Globe and Mail this weekend titled “No Way to Grow” (The Globe and Mail, Report on Business, November 11, 2023). We’ll take a harder look at points in the article and the CDNX next week. That market has been in a depression.
Only four of the 14 sub-indices were up this past week. Financials (TFS), the largest component, gained only 0.2%. The best was Information Technology (TKK) up 2.5%. Leading the way down was Golds (TGD), off 6.7%, followed by Health Care (THC), down 6.4%, and Materials (TMT), down 4.7%. The interest-sensitive sub-indices that fared well a week earlier were mostly down, with Income Trusts (TCM) down 4.2%, Real Estate (TRE) off 3.9%, and Utilities (TUT) down 2.1%. Metals & Mining (TGM) lost 3.8%. A miserable week for the material sector.
The chart of the TSX doesn’t look particularly good. We closed under the 200-day MA and the 50-day MA. The 200-day MA is up around 20,000, so we’d need to get over that if we have any hope of moving higher. We don’t break out until over 20,500. Instead, the pattern suggests we should move lower, but at the recent low of 18,962 we were a bit oversold. Follow-through on that big up day the previous week was feeble, suggesting it was much ado about nothing. A drop under 19,400 should send us lower. Only new highs above 20,000 will help keep the rebound alive.
U.S. 10-year Treasury Bond/Canadian 10-year Government Bond (CGB)
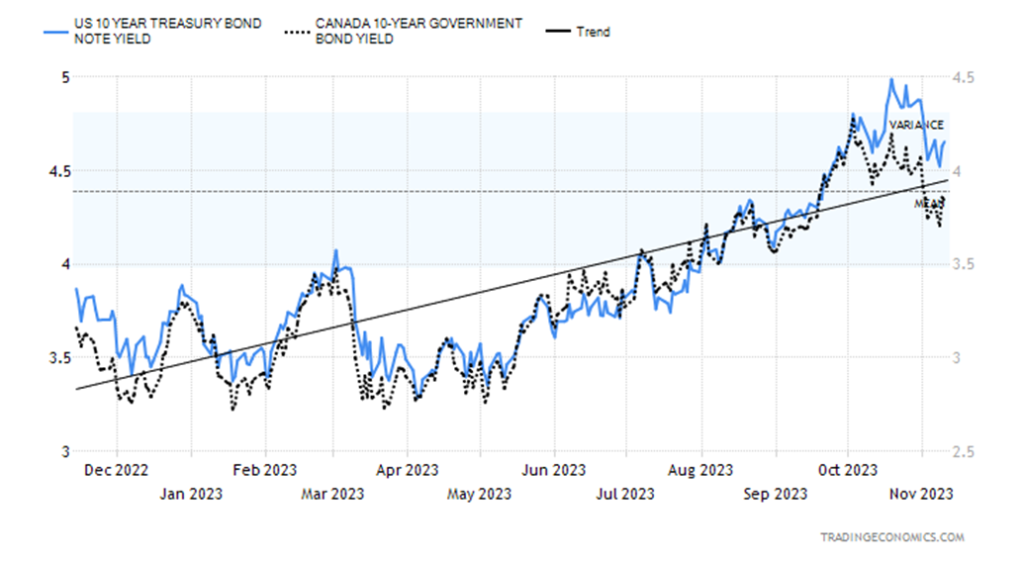
An article in MarketWatch noted that bonds are the safest investment, but the reality is the U.S. 10-year has performed worse than gold over the past five years. Gold is up 46.6% since 2018, while the 10-year U.S. treasury bond has fallen 23% on a price basis, or on a yield basis it is up 86%. When you translate that using inflation-adjusted prices, the U.S. 10-year has lost half its value. That’s super bear territory. A bond crash. Yet, we are still awaiting a major bond blow-up. A MarketWatch article noted that bonds have made nothing since 2003. Yet bonds are considered safe. Gold is considered risky. It’s been the same in Canada.
This past week the 10-year yield backed up to 4.62% from 4.57% the previous week. The Canadian 10-year Government of Canada bond (CGB) rose to 3.84% from 3.74%. The 2–10 spreads also widened out again with the U.S. 2–10 out to negative 43 bp from negative 27 bp while Canada’s 2–10 widened to negative 74 bp from negative 65 bp. The inverted yield curve spreads are still pointing to a recession that probably won’t get underway until 2024.
There wasn’t much in the way of numbers this past week. The University of Michigan Sentiment Index should have helped bonds but didn’t. Fed Chair Jerome Powell indicated the Fed is still concerned about inflation and his talk was hawkish—not friendly for bonds or gold. The CPI is due out on Tuesday and is expected to be up 0.1% in October and 3.3% year over year (y-o-y). Last month’s number was up 0.4% monthly and up 3.7% y-o-y. The core inflation rate (ex-food and energy) is expected to be up 0.3% and y-o-y up 4.1% vs. +0.3% in
September and up 4.1% y-o-y. PPI is also out as is October’s retail sales that are expected to be flat. If that’s correct, that doesn’t bode well for Christmas. The Philly Fed and the NY Empire State Index is also out and both are expected to be negative. All that might help bond yields fall. But the bond auctions are not going particularly well. We note that China’s holdings of treasury securities kept on falling down another $16.4 billion in August, the latest data available. Other central banks have picked up the slack.
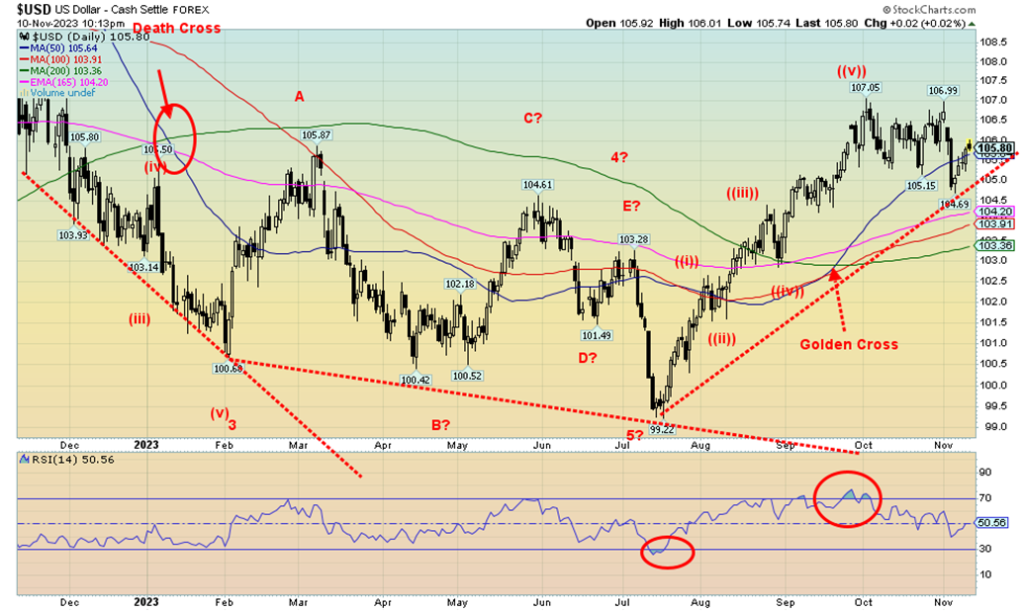
Has the US$ Index topped or are we poised to make new highs? The US$ Index rose this past week, up 0.8%. Other currencies fell with the Canadian dollar down 1.1%, the euro off 0.4%, the Swiss franc down 0.4%, the pound sterling dropping 1.2%, and the Japanese yen dropping 1.4% but managing to hold above (so far) its recent 52-week lows. The U.S. has the highest interest rates and the best economy in the G7. The U.S. dollar is a safe haven against war. Fund flows have come from the EU, Russia, the Middle East, Japan, and China, tending to park their funds in treasury bills.
The question now is, will the US$ Index make new highs over 107? Friday’s action saw the US$ Index rise, but it came back down barely up on the day. Support down to 104.70 has held, but a break now of 105 could send the US$ Index down. The rising US$ Index had a negative impact on gold this past week. So far, this looks like a bounce-back and we should fail new highs over 107. But we are at a level that does suggest we could make new highs over 107. Over 106.50, the odds are very high we’ll make new highs. Major support is down to 103, but under that level we could start a new bear.
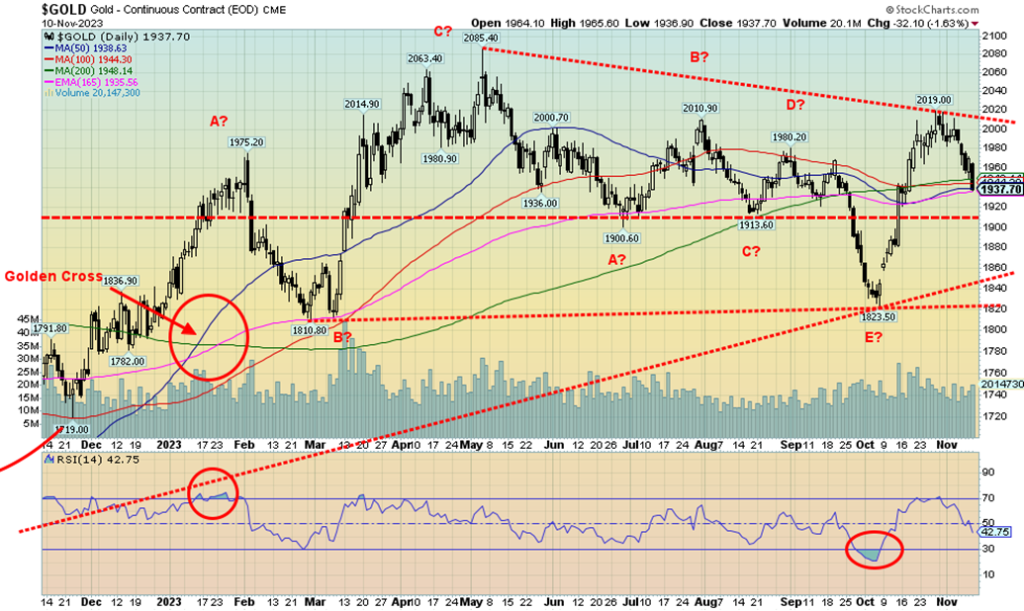
The gold bugs must hate Jerome Powell. Or maybe it’s that Jerome Powell hates gold. Whatever. Hawkish comments from Fed Chair Powell helped sink gold this past week, especially on Friday when gold fell $32.10 and closed under $1,940, a level we would have preferred to see hold. Now we have to be looking at $1,880–$1,900 as possible next targets. The stock market was up this past week, seeming to ignore Powell’s hawkishness and bond yields ticked back up, but gold and the precious metals fell.
Gold lost 3.1% while silver fell even more, down 4.3%. But platinum was slaughtered, losing 10.5% and falling to fresh 52-week lows. The near precious metals were also down, with palladium falling 13.3%, also to fresh 52-week lows as a result of lower demand as other metals are more in demand for autos. Palladium was used in traditional cars, but as the market shifts to electric, it does not need as much palladium. The price of palladium is at its lowest since 2018 and has fallen over $1,000. Copper also fell this past week, down 2.5%.
Not helping gold was the easing of concerns over the war in the Middle East spreading. As well, while Israel has not won the war, the odds are shifting in its favor, even as it takes worldwide condemnation for the humanitarian crisis that has arisen. While fears of a spreading war have fallen, there remain clashes with Lebanon’s Hezbollah and the U.S. is experiencing attacks on its bases in Syria and Iraq. If that changes, that could ignite gold prices once again. The Russia/Ukraine conflict remains a concern but appears to have settled into a stalemate, which also eases gold prices as the risks of the war spreading appear to evaporate.
We note a couple of things that could change the narrative. The U.S. is marching towards a possible shutdown unless they come up with an agreement or an extension to avert it. As well, Moody’s Investor’s Service has lowered the U.S. credit rating from stable to negative. Moody’s is the last of the rating agencies not to have cut the U.S. credit rating. Moody’s has affirmed its Aaa rating. S&P is AA+ and DBRS is Aaa and Fitch is AA+. A further credit cut by Moody’s could negatively impact bonds and the U.S. dollar, and in turn be positive for gold.
The close under $1,940 has us looking at $1,880/$1,900 as the next target. There is some support at $1,915. Under $1,870, new lows are possibly below $1,823, the October low. Gold has fallen some 4% from the October high of $2,019. Gold has outperformed all the other metals and gold in a number of currencies has made new all-time highs, most notably in the Japanese yen, but we also note new all-time highs recently in Canadian dollars, euros, and pound sterling. Once gold is making new highs in all currencies, we’ll be firmly heading higher.
We have constantly been concerned about the other metals sharply lagging gold. While gold has made new all-time highs back in 2020 (not surpassed since), silver, platinum, and gold stocks are nowhere near their all-time highs. A significant divergence. We continue to firmly believe that gold is preparing to break out to new all-time highs of over $2,100. As to timing, we had often looked at December as a potential period for our trough. So far, we appear to be on schedule. And it will be a higher trough. That’s potentially quite positive.
Because of Remembrance Day, the CFTC did not release a COT report this week. Numbers may come out on Monday.
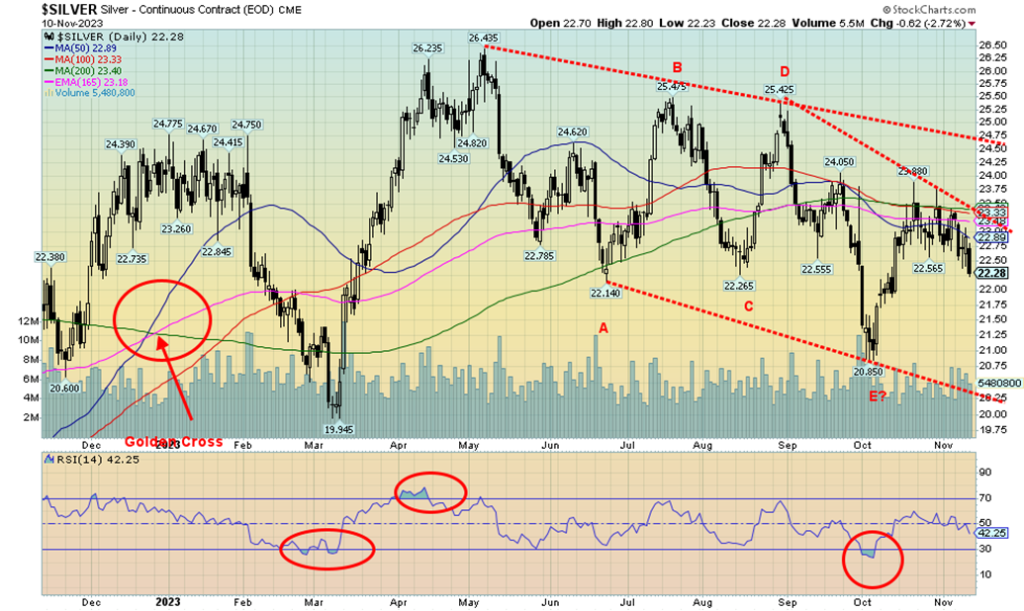
Silver fell 4.3% this past week, outpacing the fall in gold prices. Silver tends to lead in both uptrends and downtrends. We prefer in the downtrend that silver lags, as that suggests that the market could shift up. The 200-day MA, currently at $23.40, proved to be resistance, although the actual high was at $23.88. We couldn’t hold the level. Silver has fallen over 7% from that high, but remains up about 7% from the early October low. So far, this pullback looks like a correction of the move from $20.85 to $23.88.
After peaking at $26.44 back in May, silver fell in what appears to us as a large ABCDE-type corrective pattern. The correction was very steep, correcting over 86% of the gain from March to May. It had suggested new lows below the March low of $19.95 but it never happened. Nonetheless, silver needs to regain above $23 and especially take out $24 to convince us we are about to move higher. The major breakout is now at $24.75, but we’d use $25 to suggest that our low is in. Above $25.25 would suggest that new highs above $26.44 are possible. As with gold, there was no COT this past week.
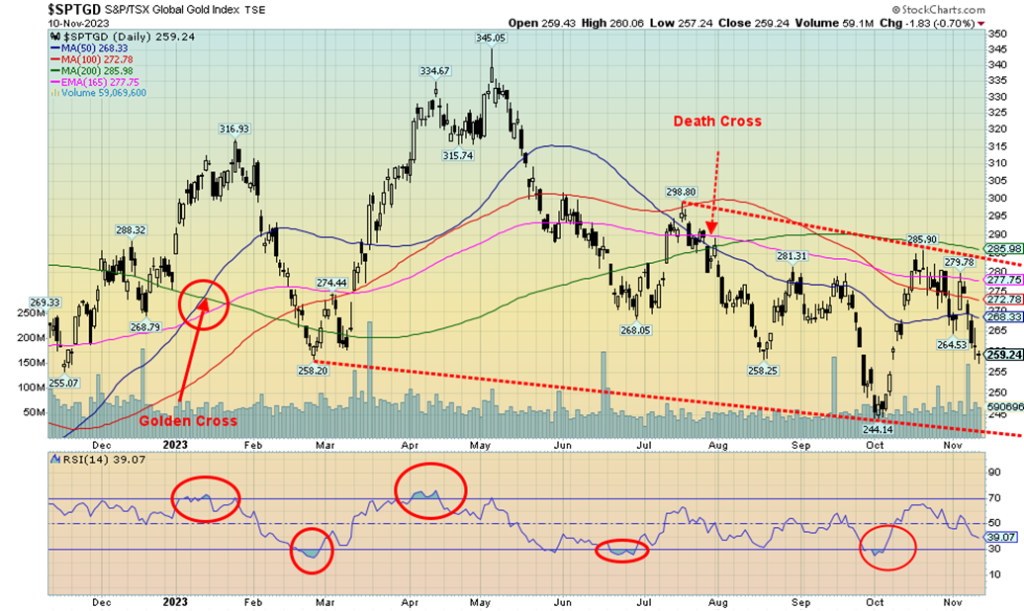
Misery is the gold stocks. After rising almost 17% from that low in early October to a high later in the month, the TSX Gold Index (TGD) has now fallen over 9%. This past week the TGD lost 6.7% while the Gold Bugs Index (HUI) fell 7.8%. We’ll treat this as a retracement of the upmove. But we remain down 25% from that May 2023 high. And twelve years later, we are still down 43% from the 2011 high. However, we suppose the good news is we are up 227% from that September 2015 low. Things could be worse. It was a swift drop this week as gold and silver both fell, even as the stock market rose. So much for safe haven status.
The gold stocks get no love. If we fall much further below 254, then the odds increase that we could see new lows for the TGD below that October low of 244. Note how we failed at/near the 200-day MA, currently at 286. We have stated we need to break over 300 to convince us we are poised to move higher. There is not much support here between Friday’s close and October low of 244. There is trendline support just below that, currently near 240. The February 2023 low was at 258 and we have penetrated that level, closing just above it this past week. Volume picked up on the sharp down day Wednesday.
The only good news is that the pattern left on Friday’s chart suggests at least a pause for the TGD. With an RSI of 39, we are not yet at oversold levels. The daily, weekly, and monthly trends are all pointed down. No joy. Owning gold stocks right now is a sure way to lose money. But we can see a few positives. The pattern down from the high of 345 appears to us as an ABCDE-type pattern. If that is correct, then the early October low of 244 should hold. Still, we have to be concerned if we break under 254 as that would suggest new lows. As we noted with gold, the seasonals turn positive into December.
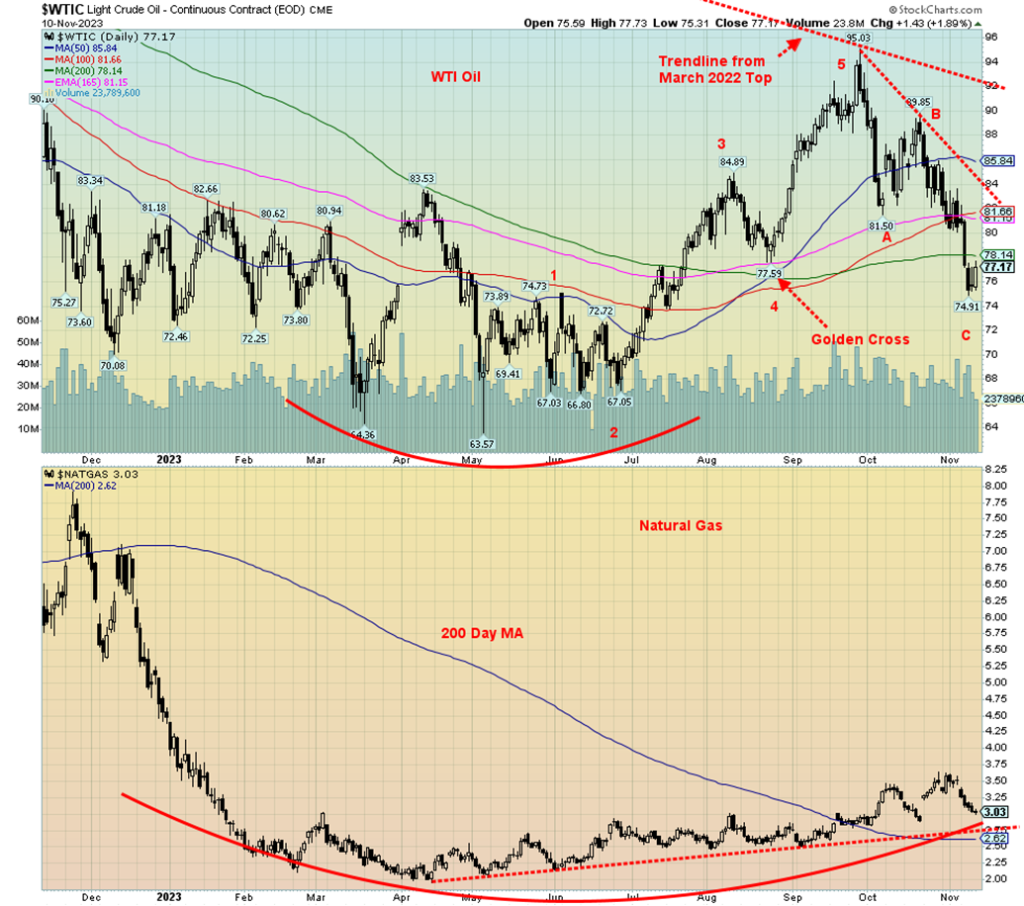
It was not a pleasant week for the energy market. Oil prices fell sharply. Natural gas (NG) also fell. What? We don’t need oil and gas anymore? Hardly. WTI oil dropped 4.2%, Brent crude was down 4.8%, natural gas at the Henry Hub fell 13.8%, natural gas at the Dutch Hub was a star, losing only 3.0%, and finally the energy indices succumbed to selling as well. The ARCA Oil & Index (XOI) fell 3.3% and the TSX Energy Index (TEN) was off 3.6%.
So, what caused all the chaos? Inventory build-ups, weak economic numbers out of China, slowing demand, rising shipping, and freight costs were among the reasons cited. OPEC meets at the end of the month and, if there is one thing we know about OPEC, is that they do not like low prices. OPEC, which includes key oil-producing states such as Saudi Arabia, Iran, Iraq, Kuwait, and the UAE, produces 36% of the world’s oil and its reserves represent 73% of the world’s reserves. Russia, while not an official member of OPEC, works closely with them as part of a group known as OPEC +. That group also includes Mexico. The bulk of the reserves, 34%, are held by Venezuela and Saudi Arabia. Between Russia and Iran, they hold 41% of the world’s reserves of NG.
NG fell because of high output, coupled with lower demand, as there were expectations of warmer weather ahead. In the EU, the story is largely the same. Full tanks, warmer weather. WTI oil hit a low of $74.91. Only under $71 do we have to think about the possibility of new lows below the May low of $63.57. Drivers may like the low price, but oil prices remain at the whim of the war in the Middle East and the probability of it not spreading far. The wild card is Iran. They are accused of backing and promoting militias that attack U.S. bases in the Middle East, and of backing Lebanon’s Hezbollah, Yemen’s Houthis. and Gaza’s Hamas. We keep hearing rumours that either Israel or the U.S. might launch an attack on Iran. A direct attack on Iran could, according to analysts, send oil to $150 or higher. That in turn could crash the Western economies.
We’ve fallen under the 200-day MA. Daily (short-term) trends are negative. Longer term trends, intermediate and long, are neutral. Further declines could turn them down as well. WTI oil hit the 61.8% Fibonacci retracement level and that often is about it. First, we have to regain above $78, and then above $81. Only above $85 could we set the uptrend in place once again. The entire pattern appears to us as corrective to the upmove from May to October. Do the seasonals set to start in December? That would help both oil and gas. As long as NG stays above $2.60 it should be okay. But a drop under $3 can’t be ruled out.
__
(Featured image by RDNE Stock Project via Pexels)
DISCLAIMER: This article was written by a third party contributor and does not reflect the opinion of Born2Invest, its management, staff or its associates. Please review our disclaimer for more information.
This article may include forward-looking statements. These forward-looking statements generally are identified by the words “believe,” “project,” “estimate,” “become,” “plan,” “will,” and similar expressions. These forward-looking statements involve known and unknown risks as well as uncertainties, including those discussed in the following cautionary statements and elsewhere in this article and on this site. Although the Company may believe that its expectations are based on reasonable assumptions, the actual results that the Company may achieve may differ materially from any forward-looking statements, which reflect the opinions of the management of the Company only as of the date hereof. Additionally, please make sure to read these important disclosures.
Copyright David Chapman 2023
David Chapman is not a registered advisory service and is not an exempt market dealer (EMD) nor a licensed financial advisor. He does not and cannot give individualised market advice. David Chapman has worked in the financial industry for over 40 years including large financial corporations, banks, and investment dealers. The information in this newsletter is intended only for informational and educational purposes. It should not be construed as an offer, a solicitation of an offer or sale of any security. Every effort is made to provide accurate and complete information. However, we cannot guarantee that there will be no errors. We make no claims, promises or guarantees about the accuracy, completeness, or adequacy of the contents of this commentary and expressly disclaim liability for errors and omissions in the contents of this commentary. David Chapman will always use his best efforts to ensure the accuracy and timeliness of all information. The reader assumes all risk when trading in securities and David Chapman advises consulting a licensed professional financial advisor or portfolio manager such as Enriched Investing Incorporated before proceeding with any trade or idea presented in this newsletter. David Chapman may own shares in companies mentioned in this newsletter. Before making an investment, prospective investors should review each security’s offering documents which summarize the objectives, fees, expenses and associated risks. David Chapman shares his ideas and opinions for informational and educational purposes only and expects the reader to perform due diligence before considering a position in any security. That includes consulting with your own licensed professional financial advisor such as Enriched Investing Incorporated. Performance is not guaranteed, values change frequently, and past performance may not be repeated.


Ecobnb Turns Sustainable Tourism Into Measurable Impact
Ecobnb’s sustainable tourism platform generated significant environmental and social impact in 2025, avoiding 58,207 kg of CO₂ and adding 583...


Sugar Markets Balance Biofuel Demand and Global Supply
Sugar markets in New York and London were mostly unchanged as the Iran conflict renewed interest in biofuels. Drought concerns...


The $40 Trillion Trap: Disinflation Is Not Deliverance
U.S. debt has reached $40 trillion, with $24 billion weekly interest, while deficits accelerate. Despite disinflation in CPI, from cooling...


FinTech Matures as AI and Infrastructure Drive the Next Growth Phase
Fintech markets are entering a mature phase, shifting from rapid growth to consolidation, specialization, and sustainable business models. Zurich and...


Bitcoin, and Ethereum Rise, While Cardano Enters Transition
Bitcoin and Ethereum posted modest weekend gains, supported by ETF inflows. A new proposal may protect Bitcoin from quantum threats....
 |
|
 |  |
 |
|
-

 Cannabis1 week ago
Germany Tightens Cannabis Reimbursement Rules: Approved Medicines Must Come First
-

 Crowdfunding2 weeks ago
Lemonaid Offers Shares to Consumers for the First Time
-

 Crypto5 days ago
Bitcoin’s Price Drops as Investors Turn to Layer 2 Solutions
-

 Crowdfunding2 weeks ago
East Crema Coffee Launches €3.5M Crowdfunding Campaign