Featured
Late January market update
“Liquidity injected” into the financial system flows everywhere. There is no escaping the fact all too many companies trading in the stock market are over burdened by debt, as are our Federal and local governments, and the stores we shop at and their customers. This is not good news for people expecting a return from their many decades investment in pension funds and/or life insurance policies.

This week for the first time since November 16th’s all-time high (aka: BEV Zero) the Dow Jones closed more than 3% from a BEV Zero, closing the week down 3.87% from January 20th BEV Zero. It was bound to happen, especially after two and a half months. That is no reason to panic, but it is very noticeable in the Dow Jones BEV chart below.
Want a reason to panic? For the first time since November 9th the Dow Jones saw not one, but two of those dreaded Dow Jones 2% days, or days of extreme- market volatility; one on Wednesday (-2.05%) and on Friday (-2.03%). These days of extreme volatility aren’t really noticeable in the BEV chart above but standout in the chart below looking at the daily bars for the Dow Jones.
So, with not one but two Dow Jones 2% days this week (both negative), should we panic? I’m not suggesting my readers do anything drastic just yet, but there is a pattern major market declines for the Dow Jones likes to follow. Bull markets are low volatility markets; you can see the bulls take the Dow Jones up in tiny baby steps. Then Mr Bear arrives on the scene, with his days of extreme volatility, exactly like we see this week in the daily bars below.
Big bull market tops begin pretty much end the same way, terminated with the arrival of Mr Bear and his confounded 2% days. BUT THEN there are plenty of examples where the Dow Jones sees a bad week, or maybe two, as seen below, where the market then recovers.
I haven’t kept it a secret I don’t like this market, and I’m expecting something really bad to begin sometime in 2021. But at this week’s close, before I get really bearish I want to see more. I’d like to see a positive 2% day next week, something to get everyone at CNBC to cheer about. If so, I’d be tempted to purchase a few out-of-money puts expiring sometime in late summer on a major market index. The Russell 2000 would be my choice as it has been the hottest index from the March 23rd market bottom. Just thinking it over, I’d give these puts two weeks to become profitable before I closed them should nothing happen.
This of course assumes I’m taking my own advice and take the plunge, which I may not.
Here’s a chart plotting the Dow Jones’ daily bars from last April. Compare the daily volatility between bull and bear markets in the chart below. Everything was just find until it wasn’t anymore. And we see exactly when things stopped being fine; with the arrival of Mr Bear’s 2% days; those dreaded days-of-extreme market volatility.
Every major market event is unique, but it’s fair saying this was how the Great Depression and other big bear market declines began: everything was just find until it wasn’t anymore, as seen below. This is why I closely watch for Dow Jones days of extreme market volatility – 2% days, as they are an excellent gauge for when something important is starting.
If a reader of my commentary decides to take the plunge and speculate a bit with a put, don’t gamble with your rent money. This is only intended to be a side bet on the market to make things a little more interesting on an early-stage technical development that may not pan out.
Here’s the Bear’s Eye View values for the major market indexes I follow. The week started out with a few BEV Zeros, then on Wednesday we see “liquidity” flow out of the market as the week progressed. The Russell 2000 (#9) was down over 4% by weeks close. The Dow Jones Transports (#14) were down a whopping 7.71%. Do they sell puts on the Transports?
Before my greed glans become too excited and I embarrass myself in front of everyone, it’s best to wait to see if Mr Bear next week offers us some additional Dow Jones 2% days.
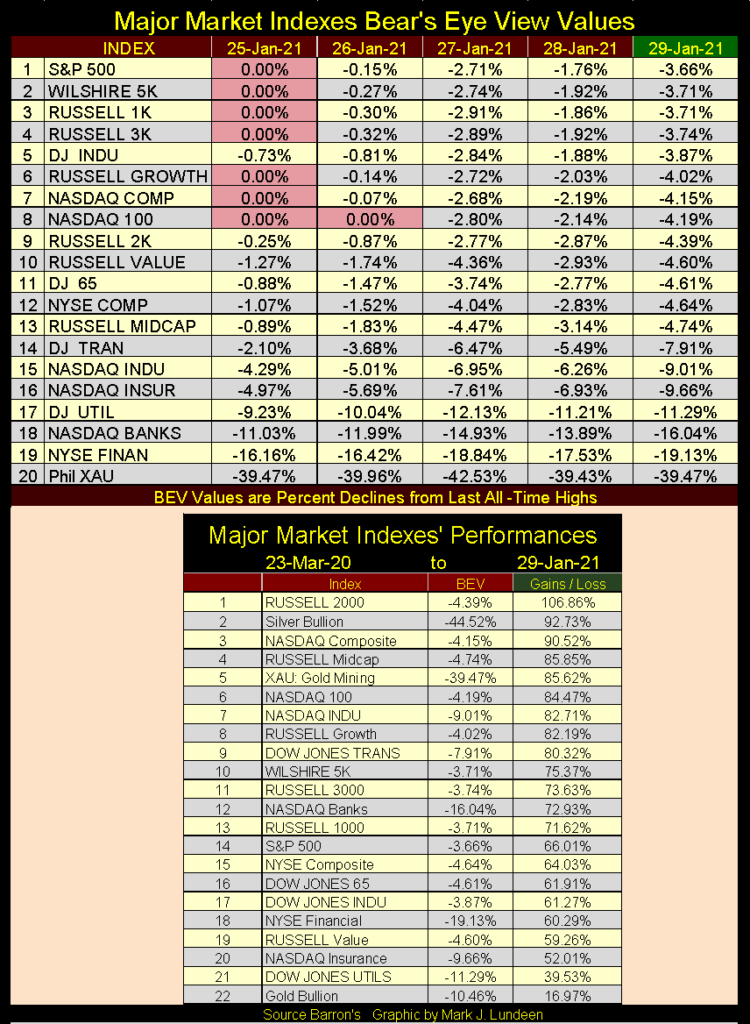
Look at silver at #2 above, while gold has been stuck at the bottom of the list at #22 for months. I look at why this may be at the end of this article.
Something interesting happened this week. I don’t know all of the details but it seems members of Reddit (?) were buying some deadbeat stocks hedge funds were shorting, forcing them (the hedge funds) to cover, taking significant losses as they did. This wolf pack of Reddit renegade investors’ broker then prohibited these rank amateurs from further purchases, placing a sell-only limitation on their accounts to bail out the hedge funds. Even members of Congress became involved; Senator Elizabeth Warren sent an open letter to the SEC demanding action to protect Wall-Street insiders from the public.
This sell-only limitation was reversed, and now the Reddit wolf pack is again on the prowl, looking for new prey.
Sounds like the silver market in January 1980. Which is interesting as in the following Epic Economist post, they believe this Reddit wolf pack’s next target is the silver market. I’ll leave it at that, and let my readers watch the 15 minute video linked below.

The XAU is still correcting in its BEV chart below. It topped out last summer just before gold did in early August, and since has oscillated between its BEV -45% and -30% lines. This week in my table for the major market indexes BEV values (above) the XAU held up the best, closing Friday exactly where it closed on Monday, as well as being in position #5 for market gains since the lows of March 23rd.
XAU’s current correction is a bit odd, and in a positive way for us bulls in the mining shares. How so? Look at it (chart below); since last summer the XAU may not have been advancing, but gold and silver miners are one of the most volatile market groups trading in the stock market. It strikes me as odd that so far in this six month correction the XAU has refused to deflate below its -45% BEV level.
Who knows what is coming in the market. Maybe those rank-market amateurs from Reddit will finally take out the big banks in the silver market before April, and send the XAU to new all-time highs by July. Stranger things have happened in the financial markets.
At King World News, Eric King has a great posting by Matthew Piepenburg from Matterhorn Asset Management. And what did Mr. Peipenburg cover? Here’s a quote from the article that nicely sums it all up.
“Specifically, Hume (David Hume: “A Treatise of Human Nature,”) looked at the problem of debt, using case studies from the Roman Empire to the far-flung corners of ancient Mesopotamia to make his point (and market secret) sink in.
And what was his market secret?
Very simple: Debt destroys.”
– January 26, 2021 (King World News) – Matthew Piepenburg at Matterhorn Asset Management
Here’s the link to the King World News’ article, an article that is well worth your time to read once, and maybe twice.
Has debt growth become a pernicious problem in our economy, markets and society? Long term readers of my articles know what I think – very much so. Debt generated by our banking system has become a huge problem, even for people who carry little to no debt themselves.
There was a time when everyone from wage earners to business owners saw the banking system as the place to earn a return on their savings, and decades ago everyone did save a portion of their income at a bank. Such savings were the basis for the banking system’s required reserves needed for creating credit for bank loans, and before August 1971 banks were largely absent from the consumer debt or even the mortgage markets.
It’s a different world today. Today bank reserves come from “injections of liquidity” from the FOMC, for business and consumer loans, student loans, and everything else. Today everyone, including consumers, sees banks more as institutions to borrow money from, not to deposit their savings into. Why save money at a bank when since the 2007-09 credit crisis money deposited at a bank typically yields less than 0.10%.
In Barron’s January 25th issue we see the choice the banking system offers people;
- Save money in a money-market account at 0.09%;
- Take out a $500,000, 30yr mortgage at 1.98%.
The lesion we learn from history is that we learn nothing from history.
“Liquidity injected” into the financial system flows everywhere. There is no escaping the fact all too many companies trading in the stock market are over burdened by debt, as are our Federal and local governments, and the stores we shop at and their customers. This is not good news for people expecting a return from their many decades investment in pension funds and/or life insurance policies.
Come the next credit crisis, it will be interesting discovering which corporations in the major-market indexes remains open and those forced into receivership in bankruptcy court.
I’m not by anyone’s definition a “market expert” or earned the qualifications to be called an economist. I’m just an old-fashioned type of guy who believes in living well within my means, and sees the wisdom of a society that does likewise. So let’s take a look at what America has done with Alan Greenspan’s “ample liquidity” at “attractive rates” since the end of WWII.
First a little table listing corporate debt with Dow Jones’ earnings and dividend payouts since October 1945. Since October 1945 corporate debt has increased by a factor of 298.74, while earnings and dividend payouts for the Dow Jones have increased by factors of only 97.44 and 91.73.
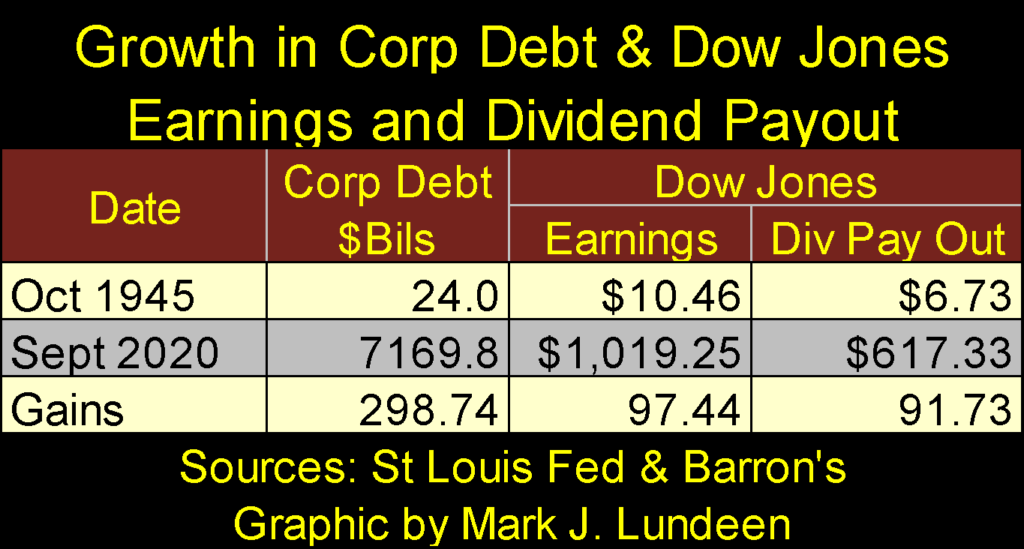
Is this a fair comparison, directly comparing total corporate debt with the earnings and dividend payout for an average maintained by the publisher Dow Jones for its proprietary thirty industrial stock average? Maybe not, but it’s the data I have so let’s go with it.
The problem I see looking at the table above is growth in corporate debt has expanded beyond these companies’ ability to service it. True; in today’s good economy and orderly markets there are no solvency problems apparent. But when the economy begins to contract and business slows down – what then?
In the aftermath of the 2007-09 sub-prime mortgage crisis, it was widely reported by the mainstream-financial media how corporate American, huge companies like IBM and Apple were assuming huge debts to fund their share buyback and dividend programs.
Why did these companies do this? I can’t say with certainty. But for the FOMC to “stimulate” the economy with their “injections of liquidity”, someone has to be willing to burden their balance sheet with increases in debt. In this case with the corporate bond market with additional trillions-of-dollars in bonds corporate American must now service.
The problem I see here is the inevitable impact this ill-considered “policy” will ultimately have on these companies’ dividend payouts. Dividend payouts can be increased or decreased even to $0.00, at the discretion of a corporation’s board-of-directors with no legal consequences to the company.
No so with coupon payouts for bonds issued by a company. Failure to make a full payment for a company’s bonds is the legal definition for corporate bankruptcy. So, a company struggling to service its bonds will first cut its dividend payout to $0.00 before defaulting on its bonds. And in the coming festivities now being planned by Mr Bear, I’m anticipating many, possibly most of corporate America to cut dividend payouts drastically, some down to $0.00.
But as seen below, the current dividend payout for the Dow Jones is at an all-time high as it yields 2.01%. A better rate than banks offer savers, or one could get from best-grade corporate or governments bonds. The problem of using dividends as a source of income is their payouts are at risk. To my knowledge the only exception to that would be a profitable precious metals mining company, companies in a market sector that frequently does very well during a financial crisis.
Currently I’m not looking for income, but growth. Hopefully in a year or two I’ll be looking for a source of income from my gains in the precious metals mining sector, and I’ll shift my funds into a dividend paying gold and silver mining company. Or better yet, see my precious metal growth stock become a dividend paying one.
Like the mining shares in the XAU, gold itself (below) is holding up pretty darned well as it enters the seventh month of a correction that began in early August of last year.
Note I’ve inserted a table listing the details of a decline in the price of gold. A 15% correction would take the price of gold down to its -15% line in the BEV chart below. Specifically; a closing price for gold of $1,752.22, or a $309.22 decline from last August BEV Zero of $2,061.44.
Is that going to happen? It could but so far it hasn’t and is beginning to appear that it won’t. I’ve inserted a red curve to highlight a nice little bottom formation now apparent in the gold market. If gold’s BEV -13.44% bottom from November 30th holds and gold begins to trend back up in the weeks to come, it could see new all-time highs by May.
Comments for gold and its step sum are little changed for the past month. Gold is now resting on a powerful base that formed in the aftermath of the August 2011 to December 2015 mini-bear market in gold. Still, gold closed this week ($1,845) below its last all-time high in August 2011 ($1,888).
It’s hard believing after all the hard work seen below this is all there is to be for the post-July 2019 advance in the gold market. When gold (and silver) finally break the bindings placed on them by the big-Wall Street banks, I believe we’ll look down on the August 2011 all-time high from far above.
Here is the Dow Jones with its step sum below. Dow Jones (market reality) came down this week with its step sum (market sentiment) following close behind.
In my opinion this isn’t the time to become bullish on the stock market. But then of course if the FOMC decides to once again flood the market with “ample liquidity”, things could once again become very exciting for the bulls.
This week the FOMC “injected” $14.08 bil into the financial system. In the next market decline we can be sure they’ll do more than that to “maintain market stability.” Like us, the idiot savants at the FOMC are waiting to see what comes their way in the weeks to come.
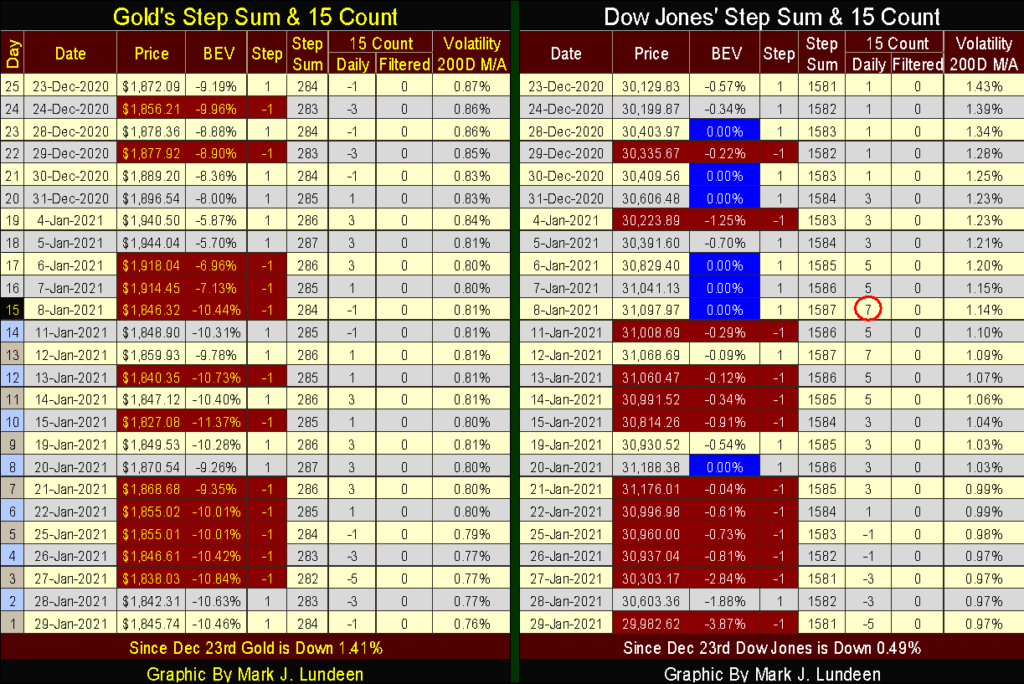
Here’s the step sum tables for gold and the Dow Jones. Looking at gold’s step sum, it hasn’t gone anywhere since December 23rd, and all this week its 15 count has been negative, which as you can see indicates there have been more declining days than advancing. But the thing that catches my attention is how daily volatility for gold continues to decline; down from 0.87% to 0.76%. As I’ve mentioned before, gold bull markets are volatile markets.
Here’s a chart plotting gold and silver’s daily volatility’s 200Dy M/A since 1969. One thing that stands out is when gold (Red Plot) broke above $1000 in March 2008, and again August 2011 when it closed at its then all-time high of $1888, daily volatility was over 1.0%. Not so when it broke above $2000 in August 2020.
That’s odd.
Now we see gold’s volatility coming down to its 0.75% line as it refuses to correct by 15% for almost seven months now. What does this mean? I don’t know, but I suspect that the next time gold’s volatility’s 200Dy M/A breaks far above 1.0%, and someday it will, you’ll be very happy to have purchased gold bullion at today’s discounted price.
Silver’s volatility (Blue Plot) is doing great. Maybe this is why silver in my performance table above was at #2 this week, advancing 92.73% from its March 23rd bottom, while gold has remained glued at #22 for months now, advancing only 16.97% off of its March 23rd bottom.
That’s it for this week.
—
(Featured image by Waldemar Brandt via Unsplash)
DISCLAIMER: This article was written by a third party contributor and does not reflect the opinion of Born2Invest, its management, staff or its associates. Please review our disclaimer for more information.
This article may include forward-looking statements. These forward-looking statements generally are identified by the words “believe,” “project,” “estimate,” “become,” “plan,” “will,” and similar expressions. These forward-looking statements involve known and unknown risks as well as uncertainties, including those discussed in the following cautionary statements and elsewhere in this article and on this site. Although the Company may believe that its expectations are based on reasonable assumptions, the actual results that the Company may achieve may differ materially from any forward-looking statements, which reflect the opinions of the management of the Company only as of the date hereof. Additionally, please make sure to read these important disclosures.


SBTi Net-Zero Standard 2.0 Enhances Corporate Climate Action
The Science Based Targets initiative (SBTi) has released Corporate Net-Zero Standard Version 2.0, a major update to its global framework...


Europe’s Cannabis Shift: Rising Use, and New Risks
EUDA report shows cannabis remains Europe’s most used illegal drug, with 22 million adults trying it. Use is highest among...


Remote Work Reshapes Sales Management: Key Lessons for Moroccan Leaders
Remote work is rapidly expanding among Moroccan managers, yet practices lag behind. Insights from France show higher productivity but weakening...


Corn Prices Slip Amid Strong Crop Conditions and Favorable Weather
Corn was lower again last week on Midwest rains despite a neutral WASDE report. The report showed slightly higher beginning...


Advances in Biomarkers and Targeted Therapies Transform Kidney Care in Autoimmune Disease
New biomarkers and targeted therapies are reshaping the management of kidney damage in autoimmune diseases like lupus and vasculitis. Experts...
 |
|
 |  |
 |
|
-

 Crypto1 week ago
Bitcoin and Ethereum Stabilize as Markets Watch ETF Flows and Institutional Moves
-

 Biotech2 weeks ago
Molecular Health Insolvency Leads to Restructuring Under New Company Name Lucera GmbH
-

 Fintech4 days ago
The German Fintech Market Shows Resilience and Strong Investment Growth in 2026
-

 Cannabis2 weeks ago
Medical Cannabis in England Sees Shift Toward Vaporizers and Pills Amid Rapid Market Growth