Featured
Warning signs ahead: Are we headed for a major stock market crash in 2019?
Recent events around the globe like trade wars are indicators that the world’s financial market is headed toward a crash.

Most of the classic technical indicators favor a continued rally in stocks into 2019.
And that’s still my preferred scenario for a final peak. One that happens in late 2019, coming off of this Trump rally that started in late 2016.
It could be near its peak growth rate after the 4.1 percent GDP report.
But it’s not likely to be sustainable for long given that we are running out of workers to rehire, and the real estate bubble seems to be finally running out of steam due to such high prices making homes and rentals unaffordable.
So, do we peak just ahead, or could it sustain well into 2019 before peaking? And I see low chances of it sustaining past that point where our proven fundamental indicators are the lowest between 2020 and 2023.
The first warning sign for the near-term peak is the sharp collapse in the Smart Money Flow Index over this year’s rally after the late January 2018 peak.
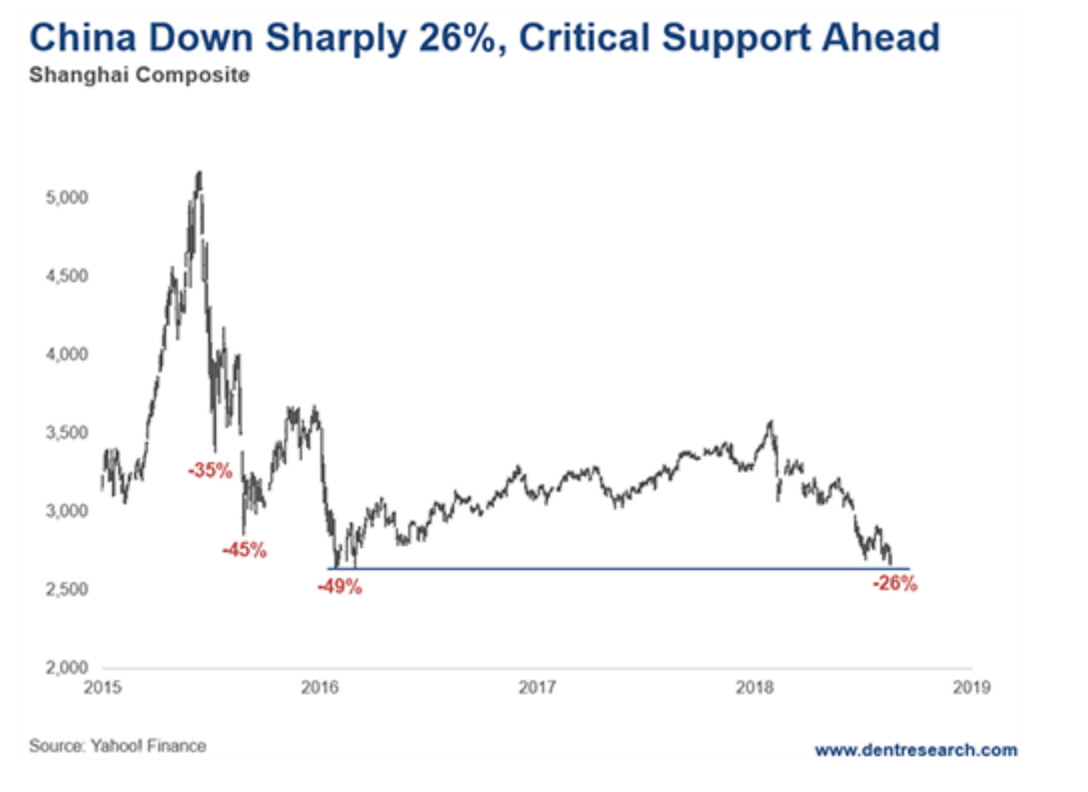
But another warning sign is the collapse in China’s stock prices, down 26 percent recently, after a second bubble peaked in late 2015, and crashed 49 percent into early 2016.
Such a continued crash would be a bad sign for the global economy, not just China. If it breaks much below its major support at 2,638, it’s due to crash to at least 2,000 in the next year, and more likely to 1,000 over the next few years. And it’s just a bit less than 1 percent from that level on Friday, Aug. 17.
© Harry Dent
This has been a classic dead cat bounce scenario ever since that low in early 2016—which is now failing again and approaching the lows of the last crash at 2,638.
The ultimate support level is 1,000, at the bottom in 2006, just before the first great bubble that peaked at 6,200 in late 2007 and crashed 72 percent to follow.
Emerging market stock indices are also down just over 20 percent, with a rising dollar and interest rates that they largely borrow in impacting them negatively.
This could be the next subprime crisis in debt, as most of the global debt came from emerging countries since the 2008 debt crisis when the U.S. had lower interest rates and a lower dollar.
This is important.
It would come with an acceleration of the trade war which is already happening—and rising dollar and interest rates—which looks likely ahead by my longer-term forecast based off of chart patterns.
It’s a crucial trend for me and you to follow. If China’s second bubble heads down again, it would favor a top in late 2018 for the U.S. and global economy, since China has the second-largest, fastest growing economy and is the most leveraged.
China’s Shanghai has bounced a bit recently as we approach this critical level. But a break much below 2,600 could be a curtain call for China.
And yet this is another indicator that stocks in the U.S. could peak earlier in late 2018 rather than late 2019, which is the final deadline for all of my indicators and cycles.
Cryptos like Bitcoin are at critical levels, as is gold and Treasury bonds. These are all indicators of a coming crash if they move down much more.
I’ll keep you updated in this tricky and unprecedented period. Either way, we’ll see a major crash by late 2019 into the early 2020s. It’s already been determined by our most powerful Great Reset Cycle every 90 years. It aligns with the Great Depression, which happened between late 1929 and early 1933.
—
DISCLAIMER: This article expresses my own ideas and opinions. Any information I have shared are from sources that I believe to be reliable and accurate. I did not receive any financial compensation for writing this post, nor do I own any shares in any company I’ve mentioned. I encourage any reader to do their own diligent research first before making any investment decisions.

-

 Business1 week ago
Dow Jones Breaks 50,000 as Bull Market Surges Amid Caution and Volatility
-

 Impact Investing6 days ago
EU Backs 90% Emissions Cut by 2040 and Delays ETS2 Rollout
-

 Crowdfunding2 weeks ago
Newcleo Raises $85 Million to Advance Fourth-Generation Nuclear Reactors
-

 Markets1 day ago
Markets, Jobs, and Precious Metals Show Volatility Amid Uncertainty









You must be logged in to post a comment Login